YBCO Superconductor
The 1987 liquid-nitrogen superconductor YBa₂Cu₃O₇ as a materials-science story: the orthorhombic crystal structure, a resistivity-versus-temperature plot, literature links, and a Channels animation that ties the structure's symmetry directly to the physics.
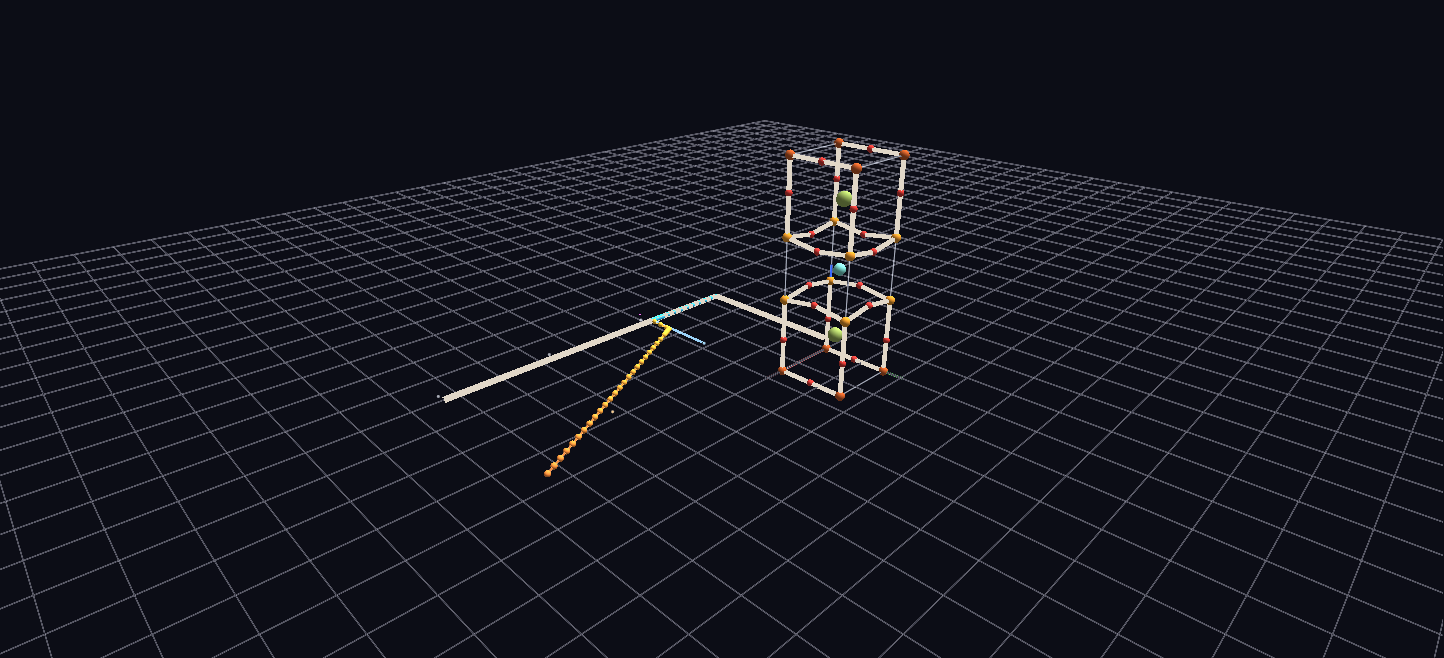
Try it: download this example below (or the full examples set), then open YBCO_Superconductor_Example/ybco_gv_node.csv — or just drag its folder onto the GlyphViz window. Press Space to start the animation.
Download this example (320 KB)
What it is
In 1987 a ceramic of yttrium, barium, copper and oxygen, YBa₂Cu₃O₇, became the first material to superconduct at the temperature of liquid nitrogen (about 92 K). This scene tells its story in one navigable place: the crystal structure, a plot of its resistivity against temperature, links to the literature, and an animation that ties the structure to the physics.
It is GlyphViz's first crystallography example, and it is deliberately not a general crystal-structure viewer. It builds one well-documented structure by hand to test whether structure, property, citation and animation together in a single scene is a worthwhile format.
The crystal
One conventional unit cell, drawn the way published figures draw it: a full atom at every symmetry-equivalent corner and edge site of the box. Along the long c axis the layers stack in the classic "1-2-3" perovskite order:
| Height (fraction of c) | Layer |
|---|---|
| 0 | CuO chain (Cu(1) and O(1)) |
| 0.18 | BaO |
| 0.38 | CuO₂ plane (Cu(2), O(2), O(3)) |
| 0.5 | Y |
| 0.62 | CuO₂ plane |
| 0.82 | BaO |
| 1 | CuO chain again, drawn to close the box |
The pairs of CuO₂ planes with the yttrium between them are where the superconductivity happens. The cell is anisotropic by nature, about three times taller than it is wide (c/a ≈ 3.05), a layered, nearly two-dimensional structure which is the heart of the physics and is preserved exactly.
Copper–oxygen bonds (chain, apical and in-plane: 43 links) are drawn as tubes, because that is the network that matters for conduction. Barium and yttrium are left unbonded, being highly ionic. The chain copper and the plane copper are coloured differently on purpose, because that distinction is the physically important one. Each distinct atomic site (Y, Ba, Cu(1), Cu(2), O(1) to O(4)) is labelled once, and U on the yttrium atom or the unit-cell box opens a reference.
The resistivity plot
Beside the crystal, a Plot-topology line shows resistivity in the ab-plane against temperature. In the normal state it rises in a straight line with temperature, the famous "strange metal" behaviour (an ordinary metal would curve as T²), then drops sharply to exactly zero at the critical temperature. The transition is drawn 2 K wide for legibility, where a real single crystal's is often under 1 K.
The oxygen animation
Press Space. A 240-frame loop sweeps the oxygen deficiency δ in YBa₂Cu₃O₍₇₋δ₎ from 0 (fully oxygenated, orthorhombic, superconducting at about 92.5 K) to 1 (fully reduced, tetragonal, not superconducting) and back. The structural symmetry change is the mechanism that switches superconductivity on, and you watch it:
- The chain oxygens fade to dim ghosts of themselves, exactly as (1 − δ), which is real stoichiometry, and the Cu(1)–O(1) bonds fade with them.
- The cell squares up. The lattice parameters a and b converge toward one common value as δ rises, so the box visibly becomes tetragonal as the chains empty.
- A marker slides along the plot's temperature axis to the critical temperature at that δ. It sits at the 92 K end at δ = 0, drops to the famous "60 K plateau" and falls to zero by δ ≈ 0.65, so you can read superconductivity off the structure. The plotted curve itself always stays the δ = 0 reference.
A stopped or reset scene is identical to the static structure, because every node's saved values are the δ = 0 case.
Things to try
- Pause on the plateau. Stop the sweep partway and compare the box and the marker.
- Orbit the chains. Fly in to the bottom layer and watch the chain oxygens fade, with the bonds fading along with them.
- Read the links. U on a labelled atom or the box opens its reference, such as the original Nature structure paper and the Materials Project entry.
How it is built
The scene is 177 nodes. The animation uses a pattern worth borrowing: a single Channel In can carry several bindings at once (a position track and an opacity track, for example), so about 39 moving atoms collapse onto only 8 shared tracks (23 bindings over 240 frames) instead of one channel per atom. Bonds need no tracks of their own for position, because a link is always drawn from its two ends' current positions, so moving the atoms drags the bonds with them.
What it is and is not
The lattice constants and atom positions are representative published values (Jorgensen and colleagues, Physical Review B, 1990), cross-checked against the Materials Project and the original Nature paper, rounded for a clean model. It is an illustrative model rather than a research-grade refinement. The critical-temperature curve and the lattice interpolation capture the well-known qualitative shape of the real behaviour, not a specific dataset; the real transition is sharper, and the real c axis also shifts slightly with δ, which is left out for clarity. The generator, build_ybco_scene.py, builds the whole scene, including its own checks.