Vehicle Sales — Depreciation Grid
A make × model-year bar field: bar height is median selling price, so every make's depreciation curve stands in relief; bar radius is sales volume.
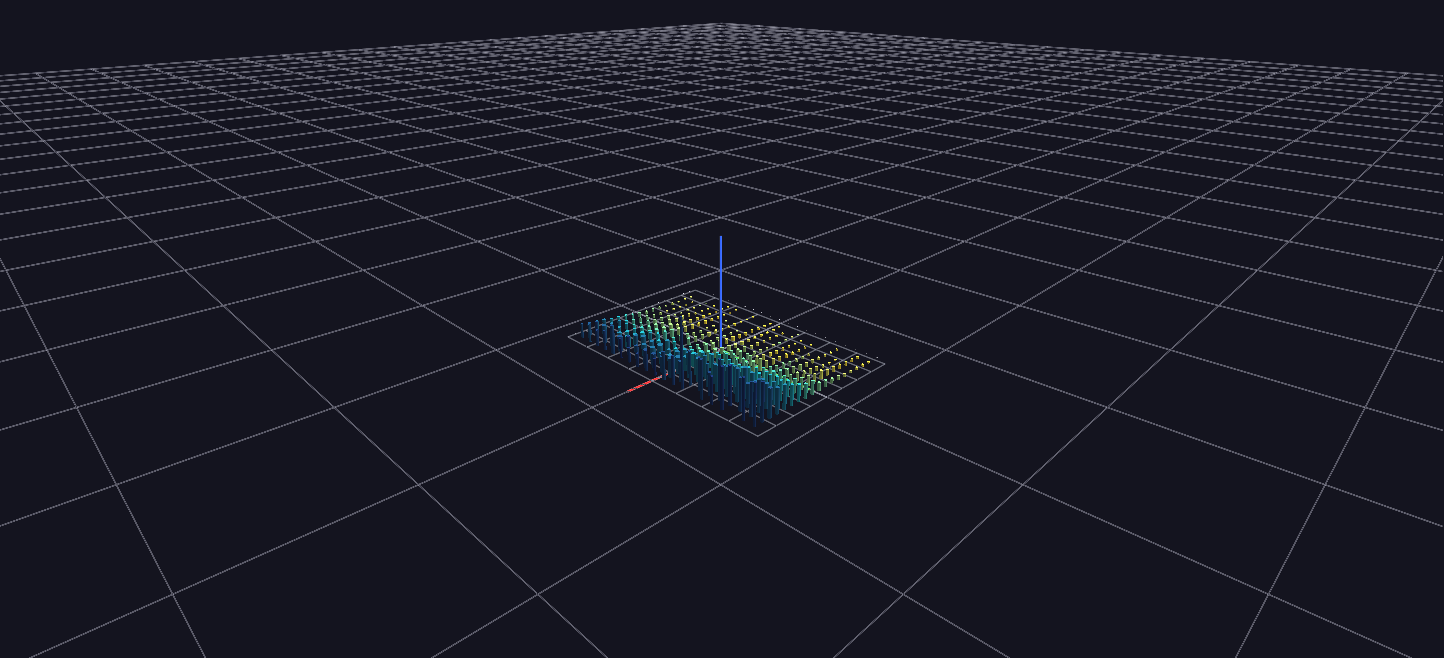
Data: Kaggle used-vehicle auction dataset (~559,000 sale records).
Try it: download this example below (or the full examples set), then open Vehicle_Sales_Example/Depreciation_Grid/DepreciationGrid_gv_node.csv — or just drag its folder onto the GlyphViz window.
A full write-up of this example is coming soon.