GlyphViz
A 3D hierarchical visualization toolkit for hyperdimensional data.
GlyphViz renders structured data — node hierarchies, time series, gene networks, EEG signal fields, strange attractors — as navigable 3D scenes. It is built in the lineage of ANTz, extending its node/tag model into a modern Python toolkit while preserving exact rendering fidelity with the original.
GlyphViz is not a charting library. It treats data structure as scene structure — hierarchy becomes spatial nesting, relationships become topology, and dimensions beyond the third are recovered through projective geometry rather than discarded.
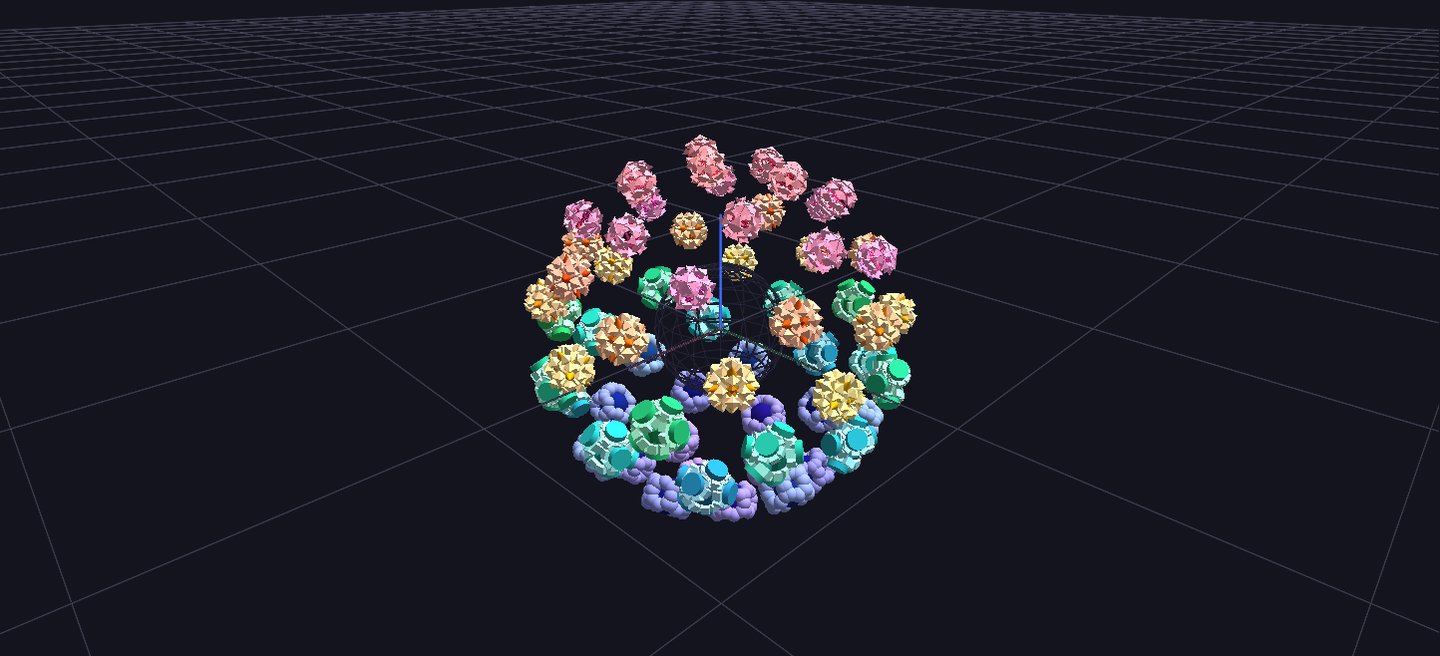
Drag to orbit — this is a live render of GlyphViz's own node hierarchy: parent, children, and one grandchild.
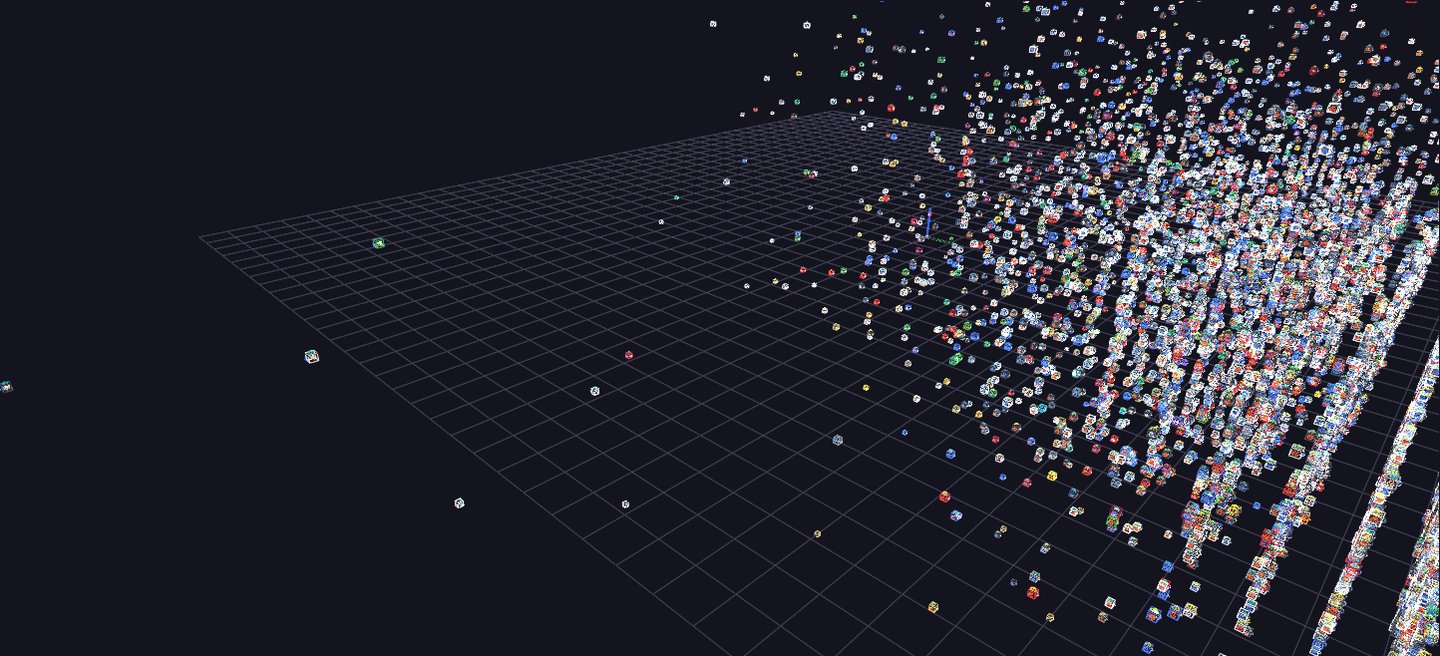
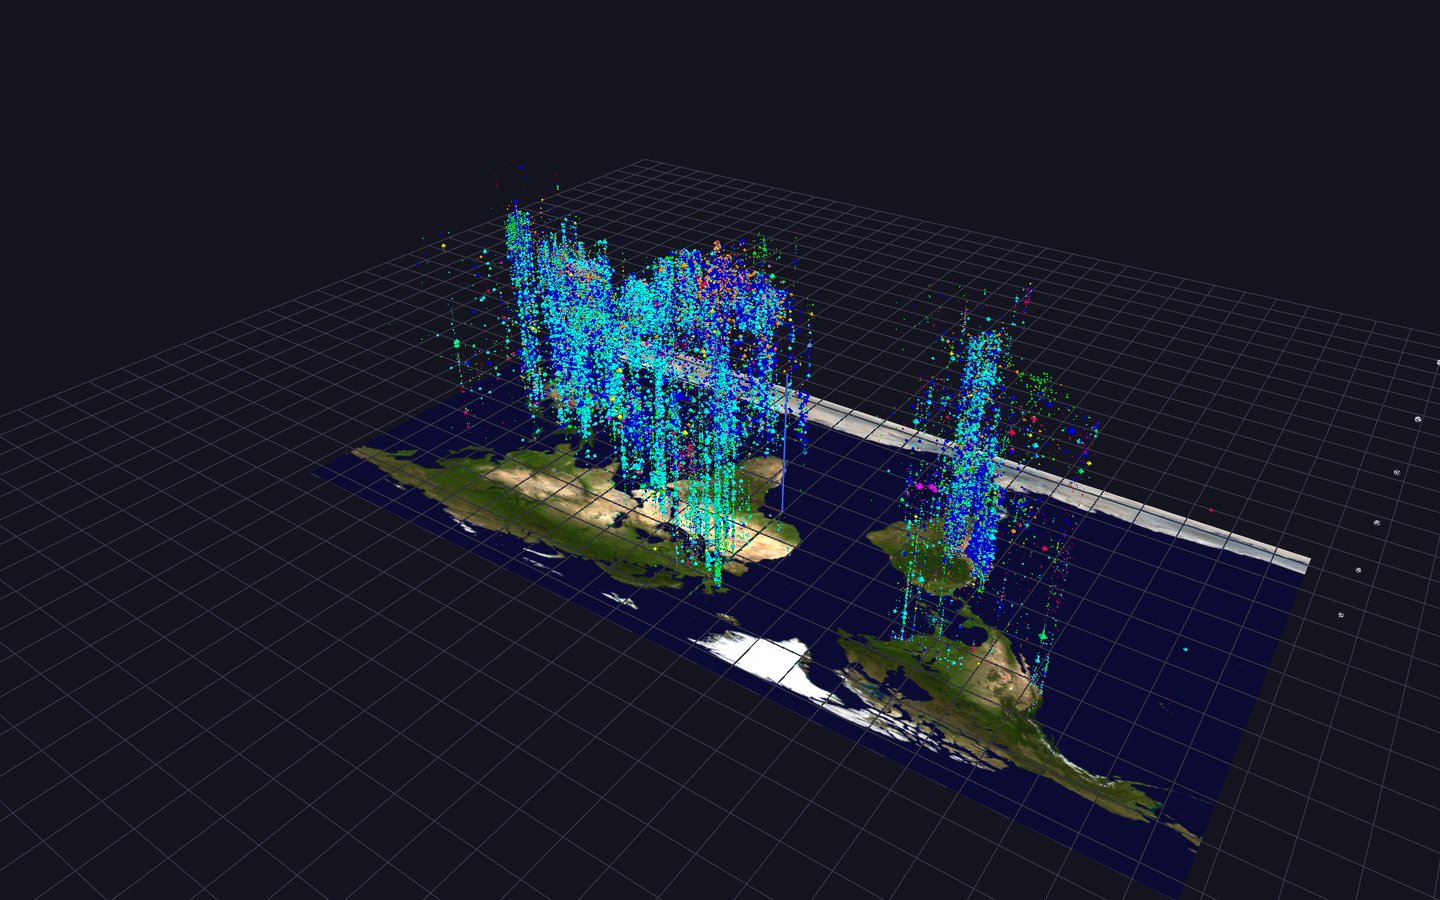
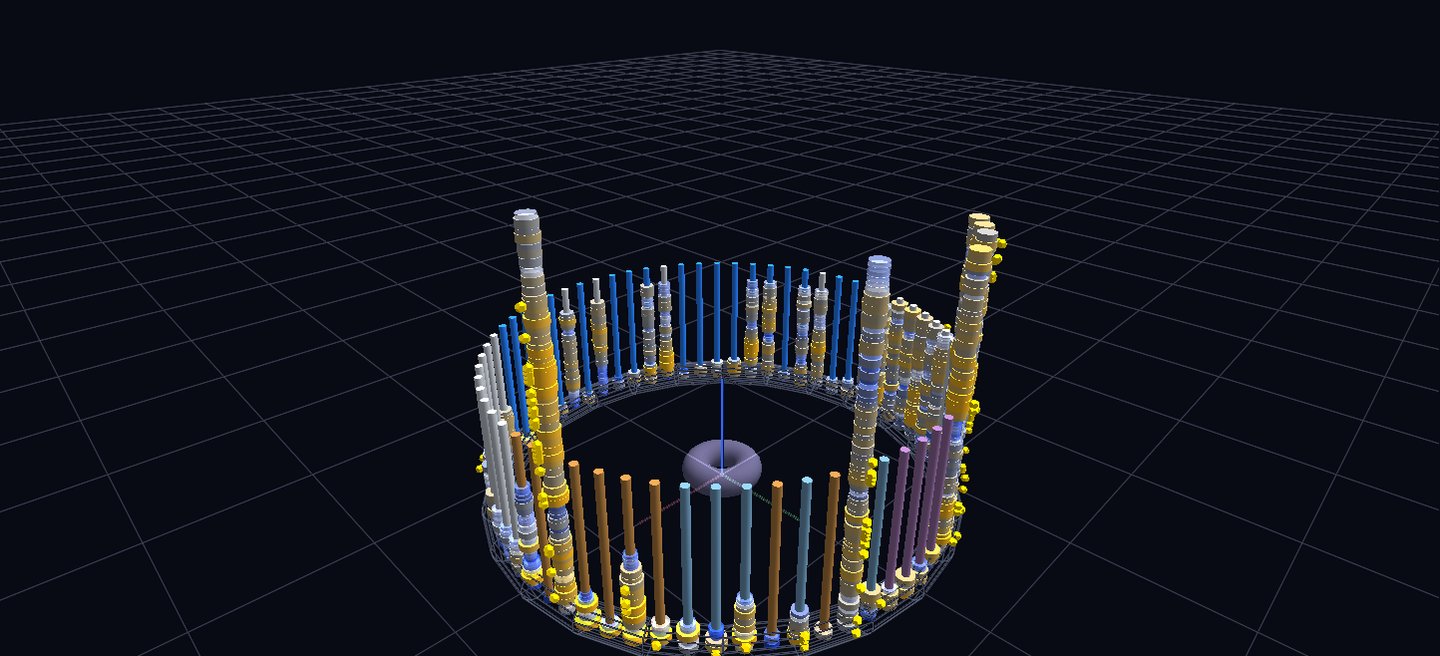
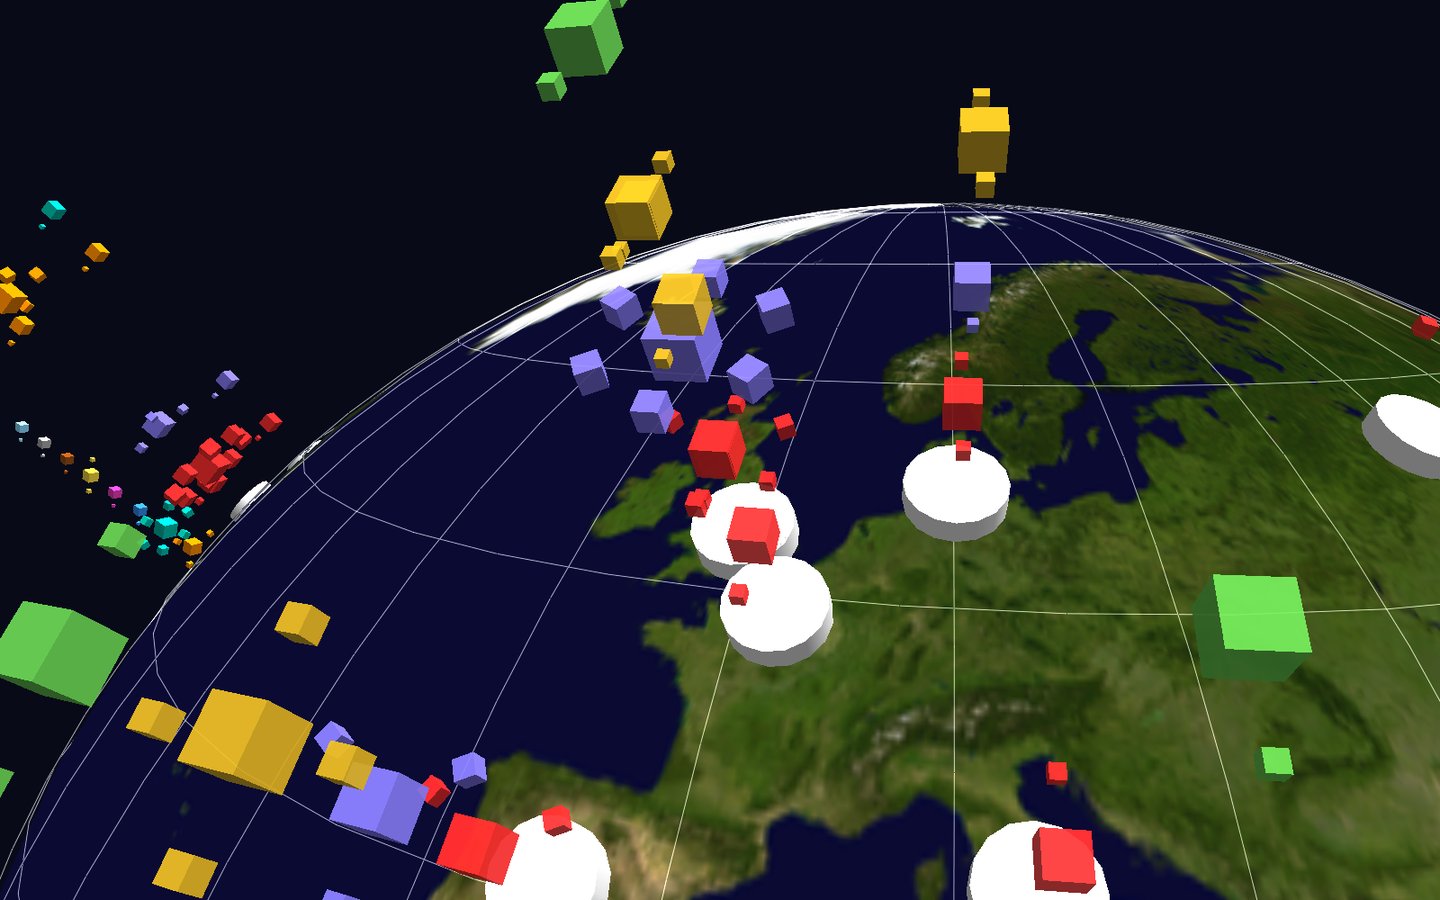
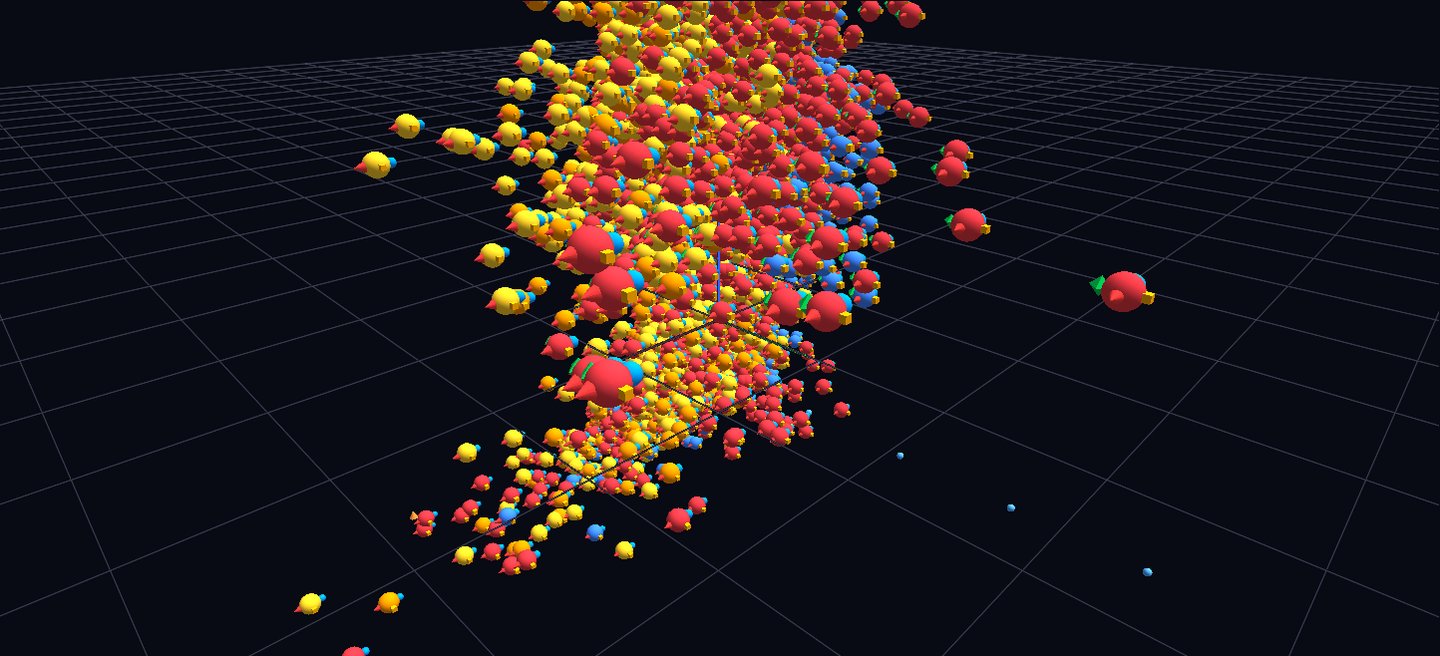
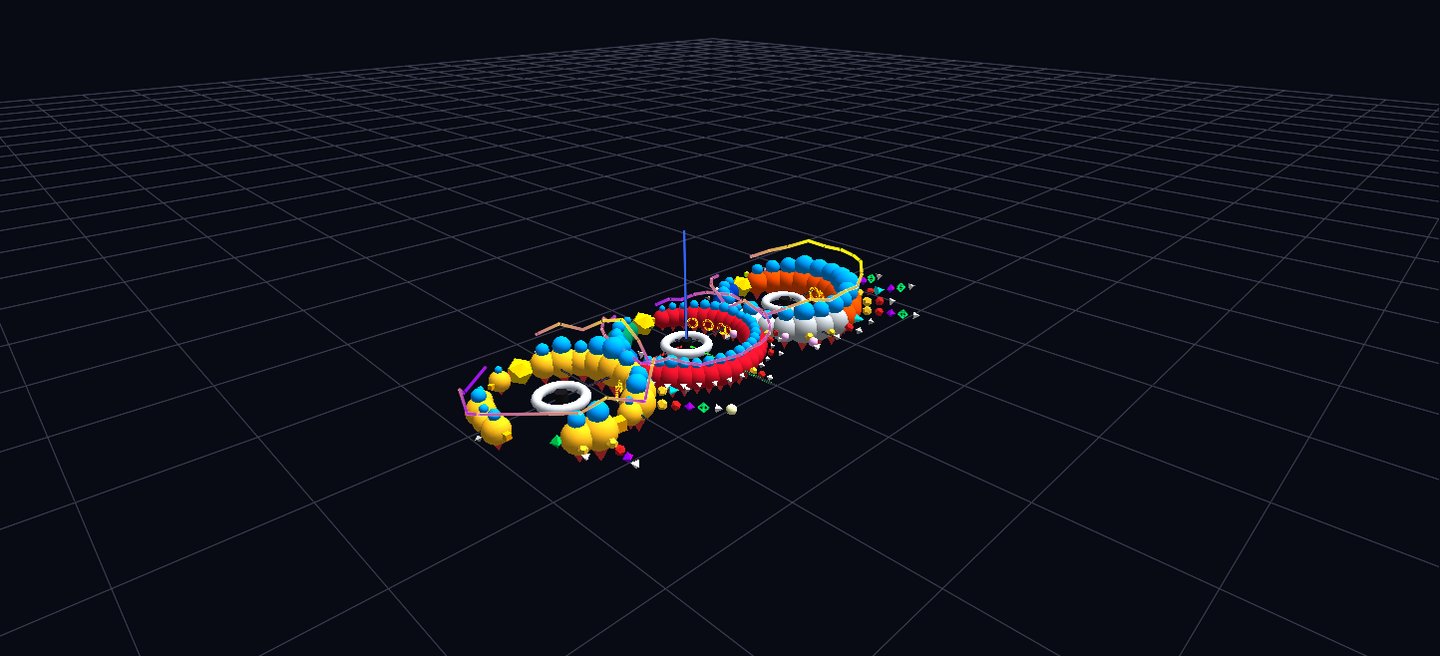
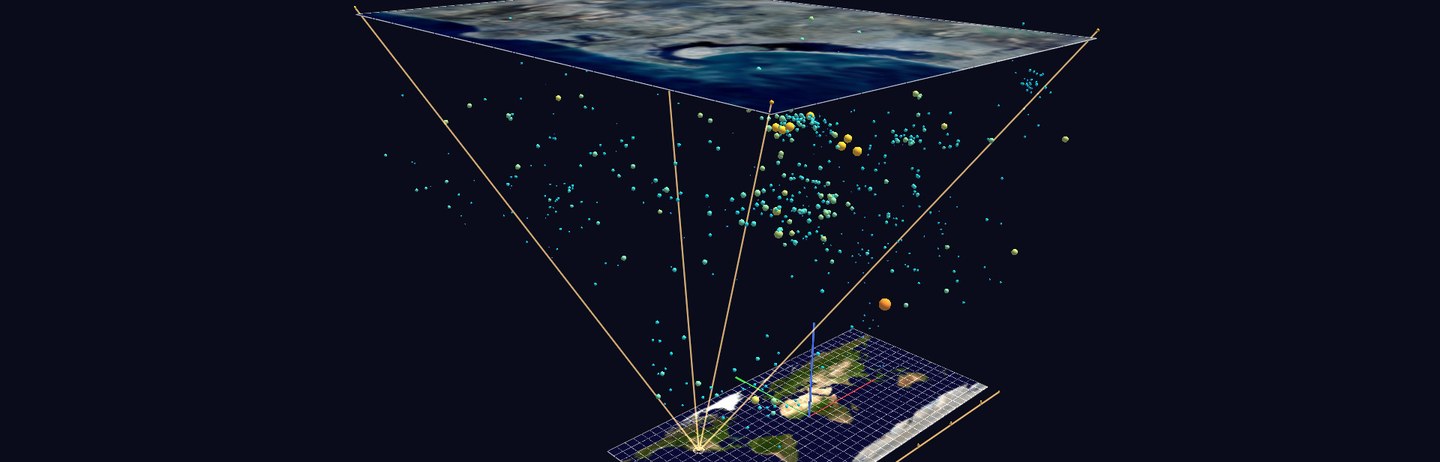
Every frame in the carousel above is an actual GlyphViz scene — no mockups. Full source and data for each ships in the Examples Gallery.
Try it right now — no install
GlyphViz Web is a full browser implementation: open the link, drag in a node CSV, and you're in a live scene — nothing to download, nothing to install. It's a from-scratch WebGL rewrite (Three.js), not a stripped-down port, reading the same native gv_ scene format as desktop, and it has closed most of the gap with the desktop app — node creation and editing, selection, tags, Channels animation, color palettes, even cross-eye stereo 3D all work in-browser today.
…including in VR
Open that same link in a headset's browser and press Enter VR, and you are standing inside the scene — fly through it, grab and resize it with both hands, point at a glyph to select it, all from a wrist-mounted control panel. It's WebXR: no app to sideload, no PC-VR link, no cable. Confirmed on a Meta Quest 3; any WebXR-capable headset browser, Apple Vision Pro included, should work the same way.
Launch GlyphViz Web VR controls Prefer the desktop app?
Why GlyphViz
- Hierarchical by design — node and tag relationships map directly onto 3D spatial hierarchy, the way ANTz originally intended.
- Validated, not just tested — every release is checked against a golden-master oracle: the original ANTz C renderer, instrumented to dump its exact transformation matrices, compared frame-for-frame against GlyphViz's output.
- Built for real scientific data — spatiotemporal EEG, RNA-seq expression networks, longitudinal health records, and chaotic dynamical systems are first-class use cases, not afterthoughts.
- Hyperdimensional-aware — when your data has more than three dimensions, GlyphViz doesn't just drop the rest. Projective geometry and phase-space embedding techniques (Takens delay embedding, strange attractor reconstruction) bring higher-dimensional structure into a space you can actually navigate.
- Everywhere you want it — the desktop renderer (
glyphviz_gl) and the OpenXR spike (glyphviz_xr) share one core engine (glyphviz_core); GlyphViz Web is a separate, browser-native implementation of that same scene format, with its own WebXR immersive mode. So the same CSV opens in the full desktop app, in a browser tab with no install, or in a headset — from one link.
Where to start
-
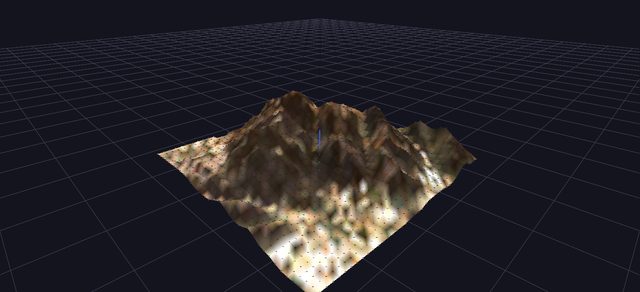
New to GlyphViz?
Get it installed and render your first scene in a few minutes.
-
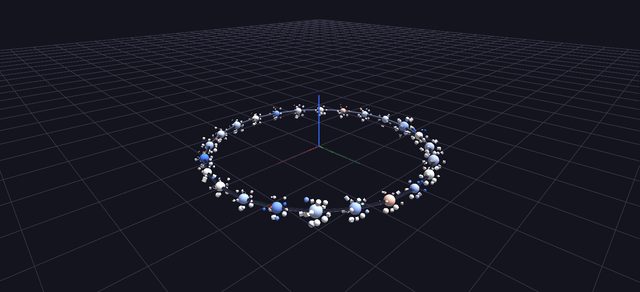
Want to understand the model first?
Nodes, tags, hierarchy, and how the ANTz lineage shapes everything.
-
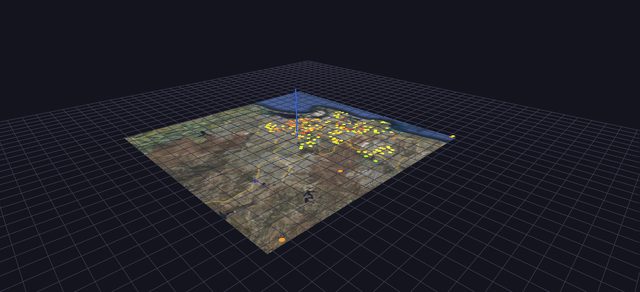
Want to see what's possible?
Real visualizations — EEG fields, gene networks, strange attractors — with full source.
-
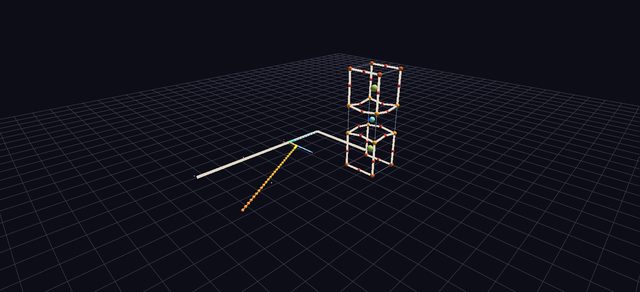
Curious where this is headed?
WebXR deployment, an AI-to-topology bridge, and the long-range plan.
GlyphViz is under active development. This documentation site is a working scaffold — most sections are placeholders being filled in incrementally.