Hyperglyph Visualization Examples
This visualization work was done by Jeff Sale, much of it in collaboration with Dave Warner, who helped inspire much of the vision behind ANTz. Shane Saxon gets credit for developing the tool with help from others including Lucas Erickson. If you have questions or comments about this work, please send email to esale @ ucsd dot edu.
Check out some of my latest work.
Explore more pics on my Picasa site.
ANTz has now spun off into a business, SynGlyphX. Visit their site to see more of my work.
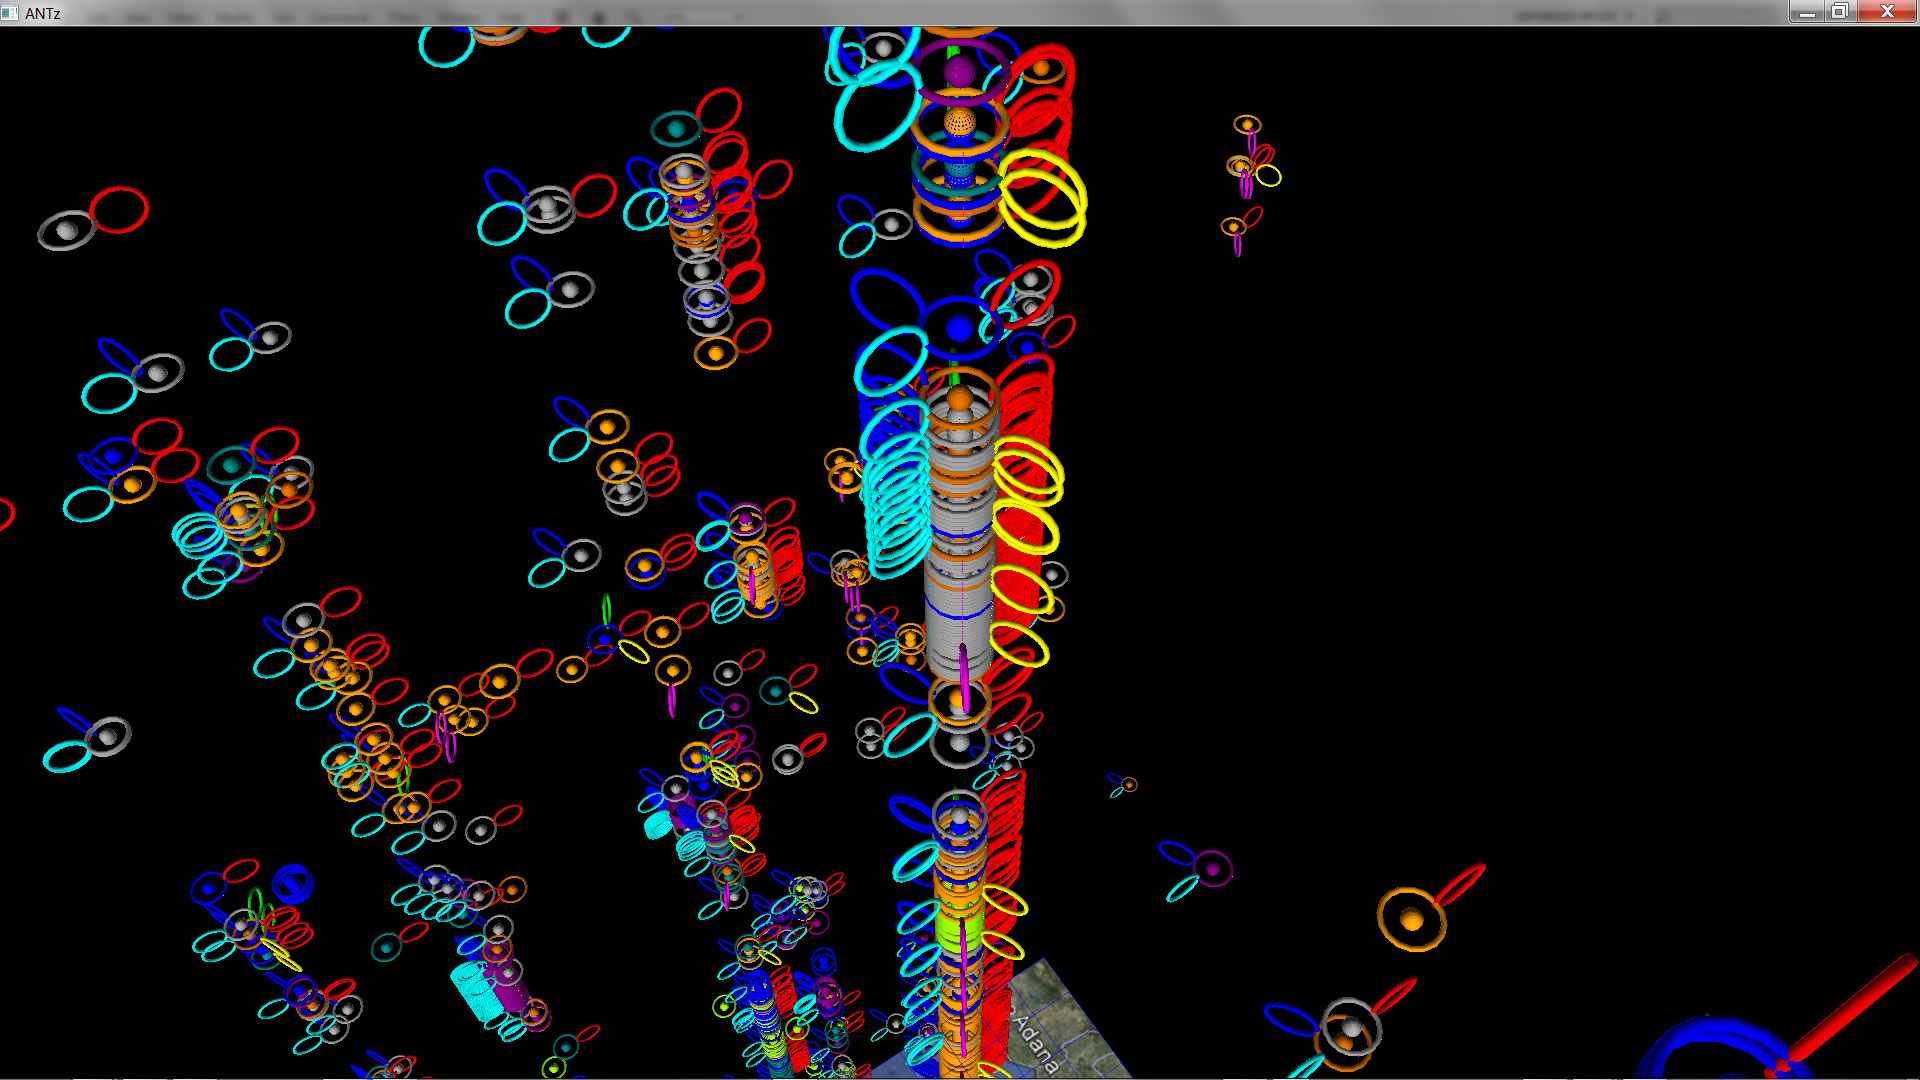
These examples use the ANTz visualization tool to generate the images. *
Downloadable zip files are usually complete with all files needed to view the visualizations, but versions of ANTz have changed frequently so any one particular antz.exe may not open every ANTZ0001.CSV file.
Projects |
|
|
Tutorial, Demo, Data Download.
|
|
|
|
|
|
|
|
|
|
|
|
|
|
|
|
|
|
|
|
|
|
|
|
|
|
|
|
|
|
|
|
|
|
|
|
|
|
|
|
|
|
|
|
|
|
|
|
|
|
|
|
|
|
|
|
|
|
|
|
Explanation, Examples, Data Download.
|
|
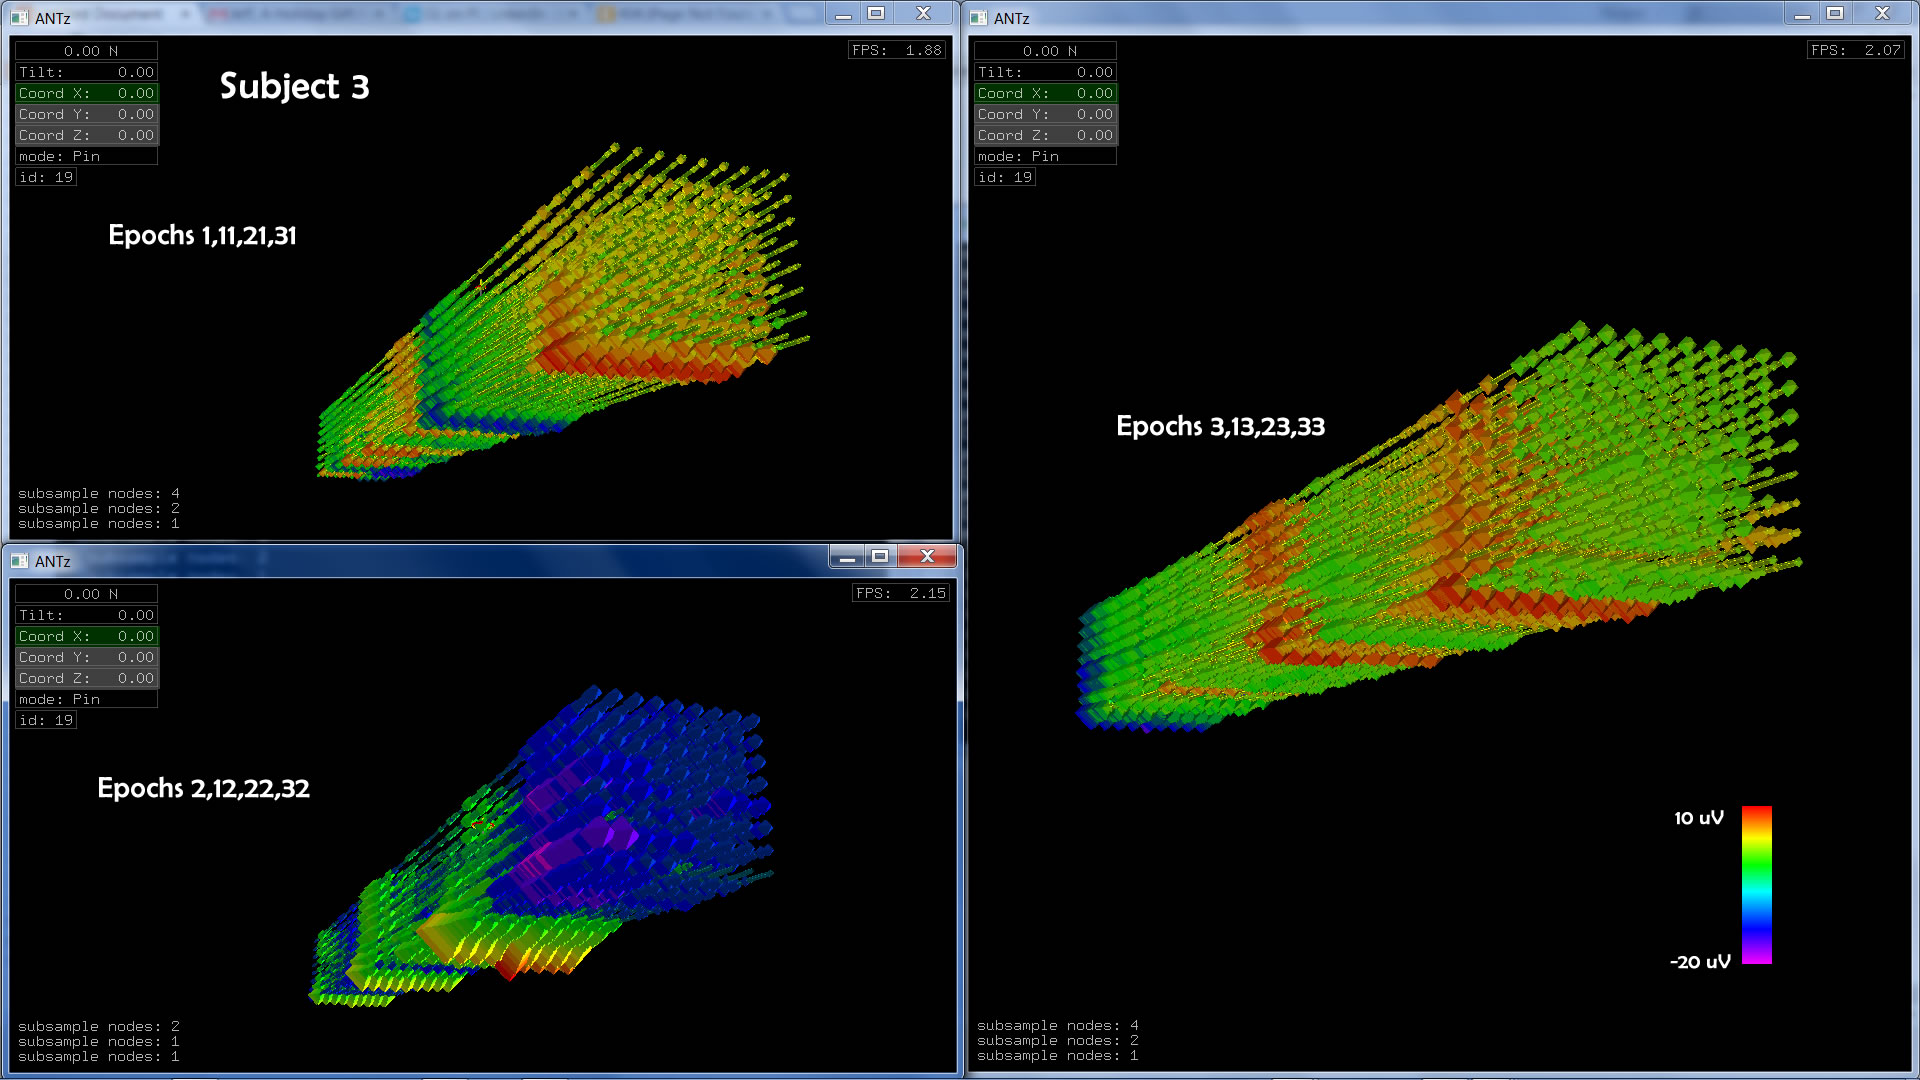
Physiometric Data
|
|
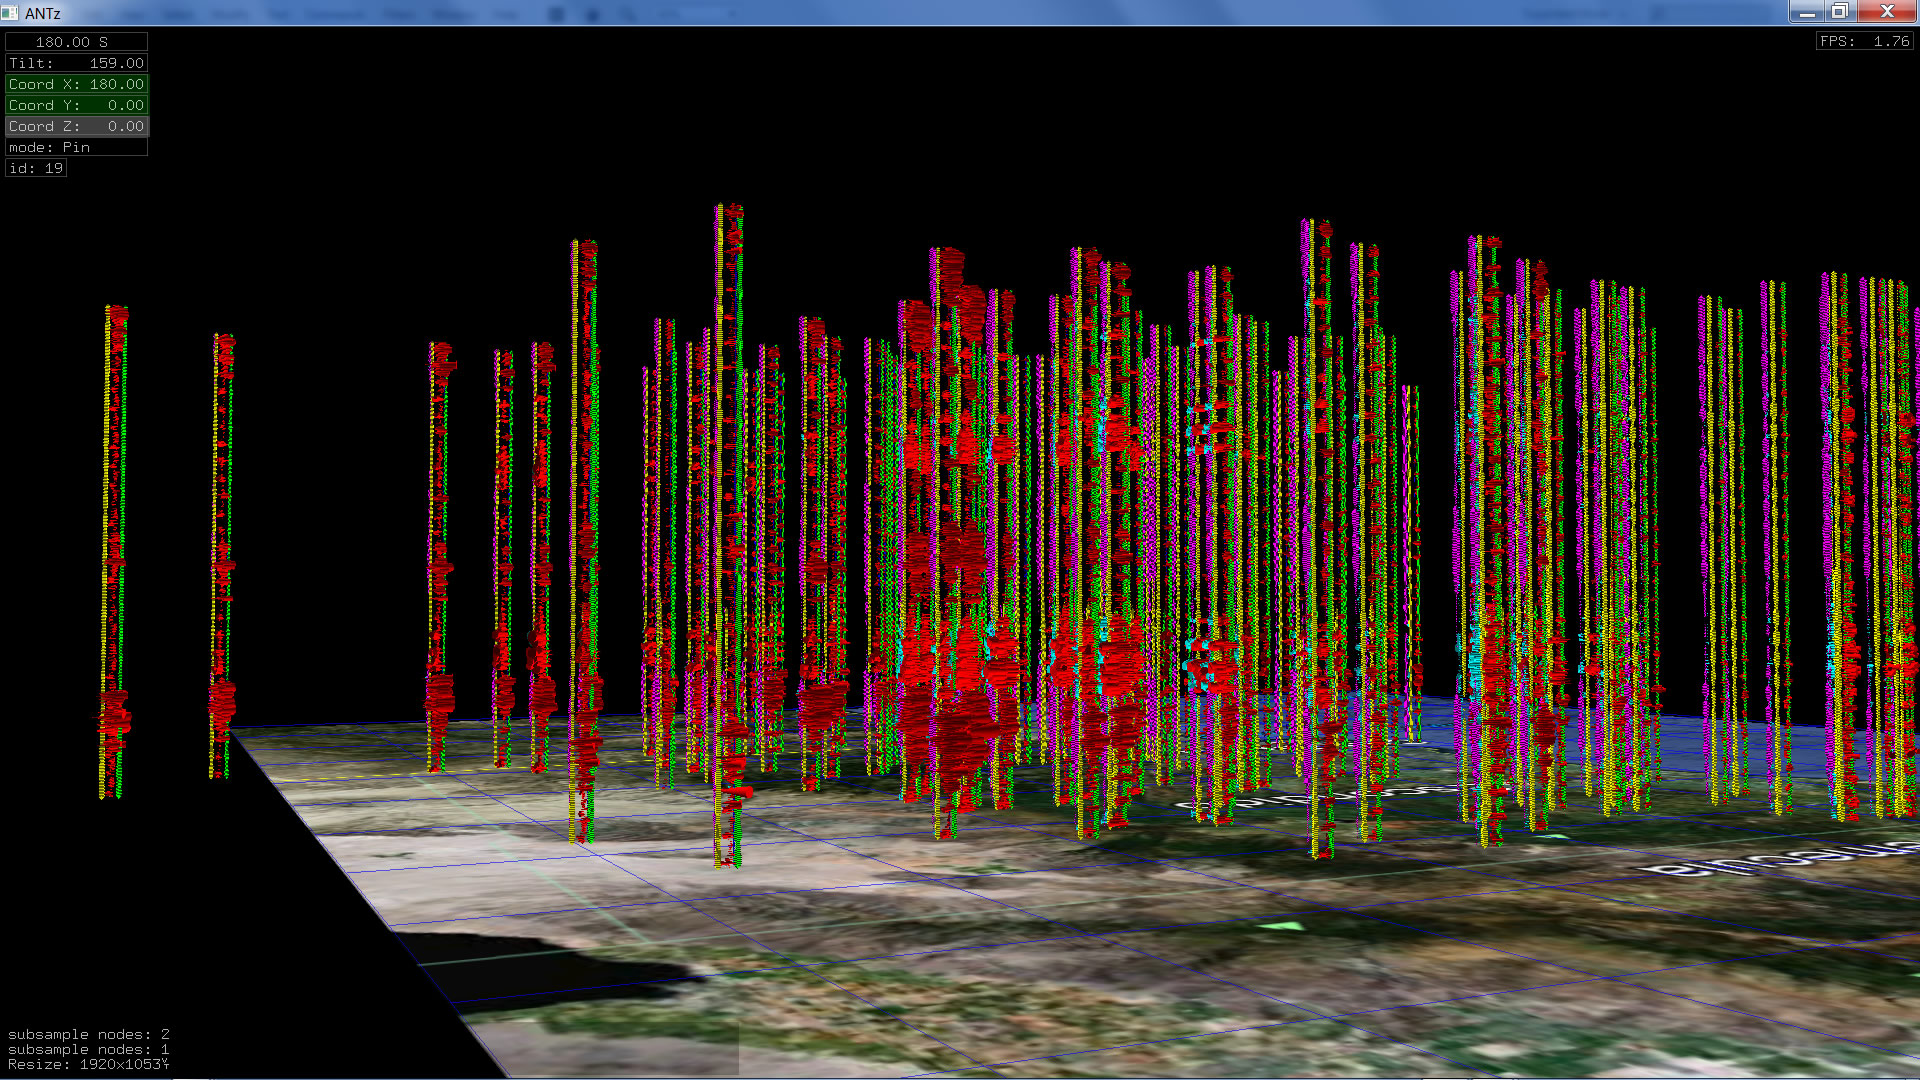
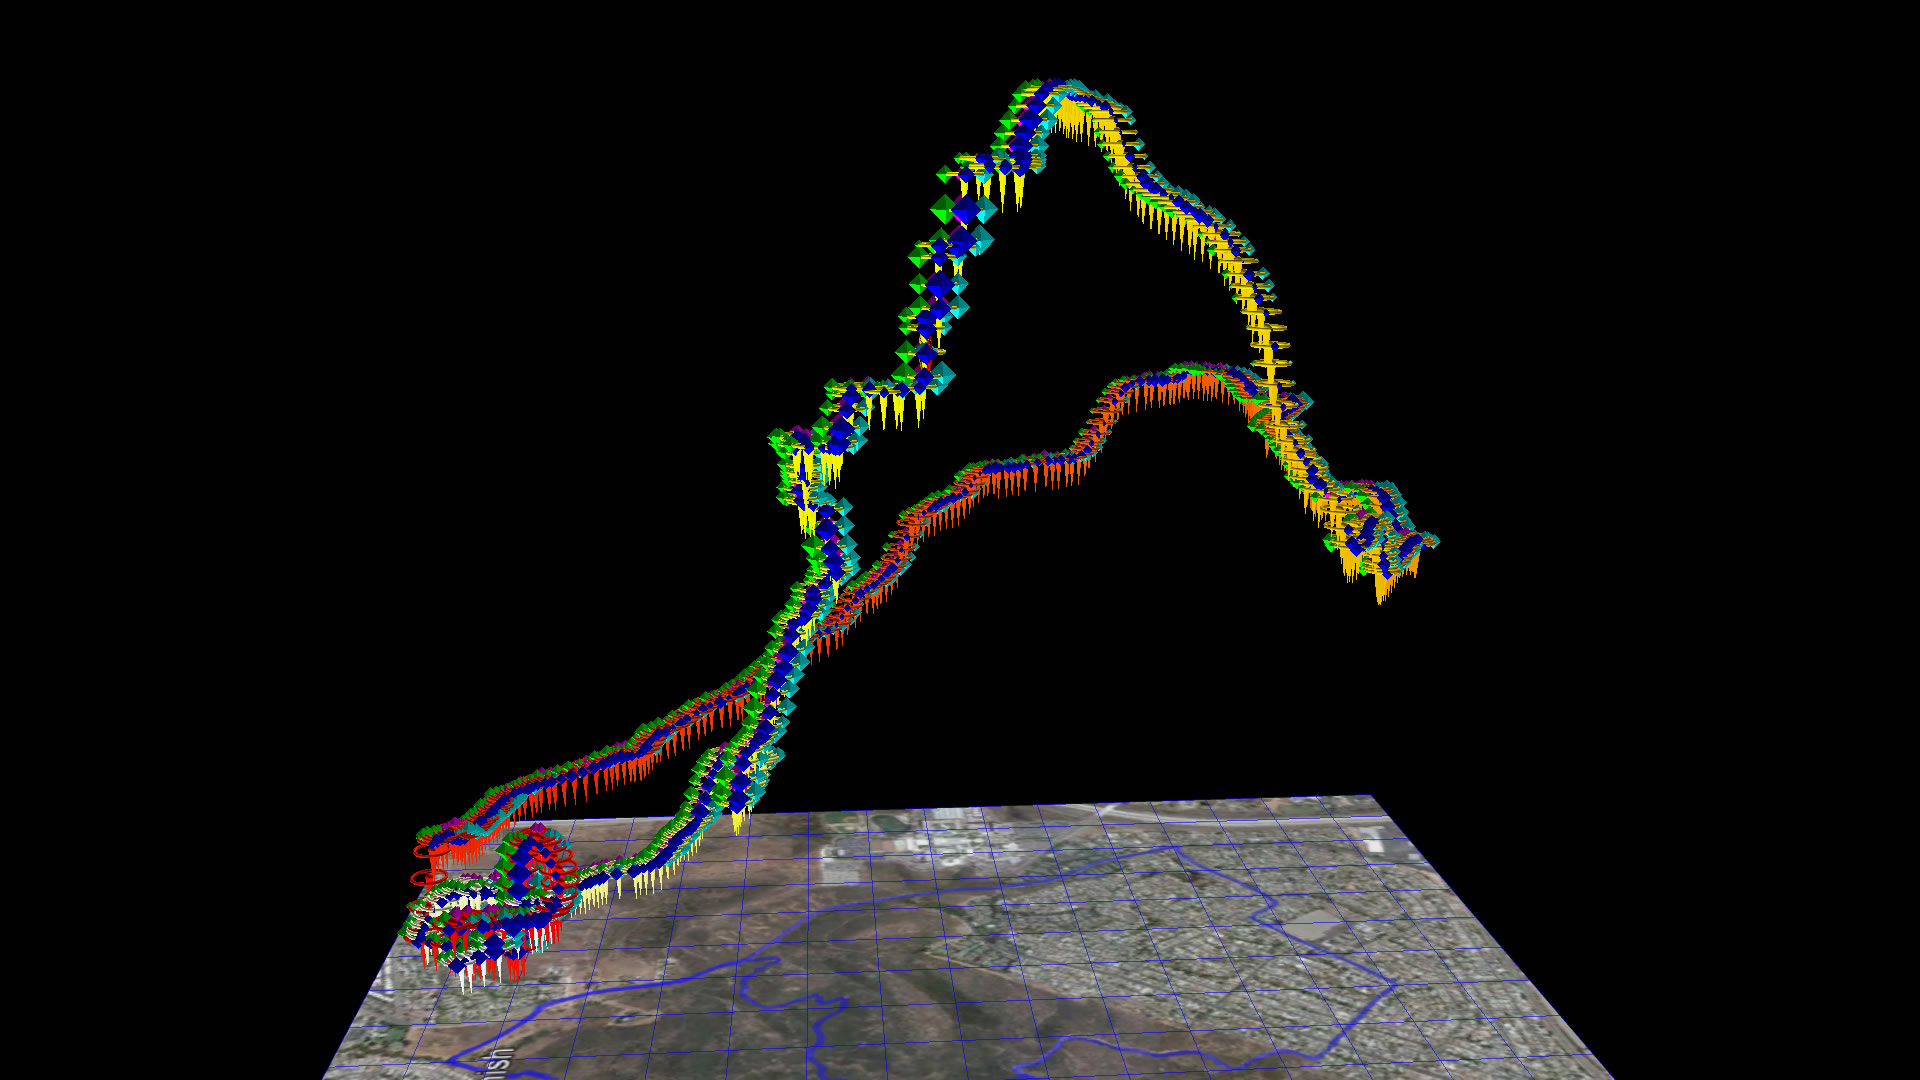
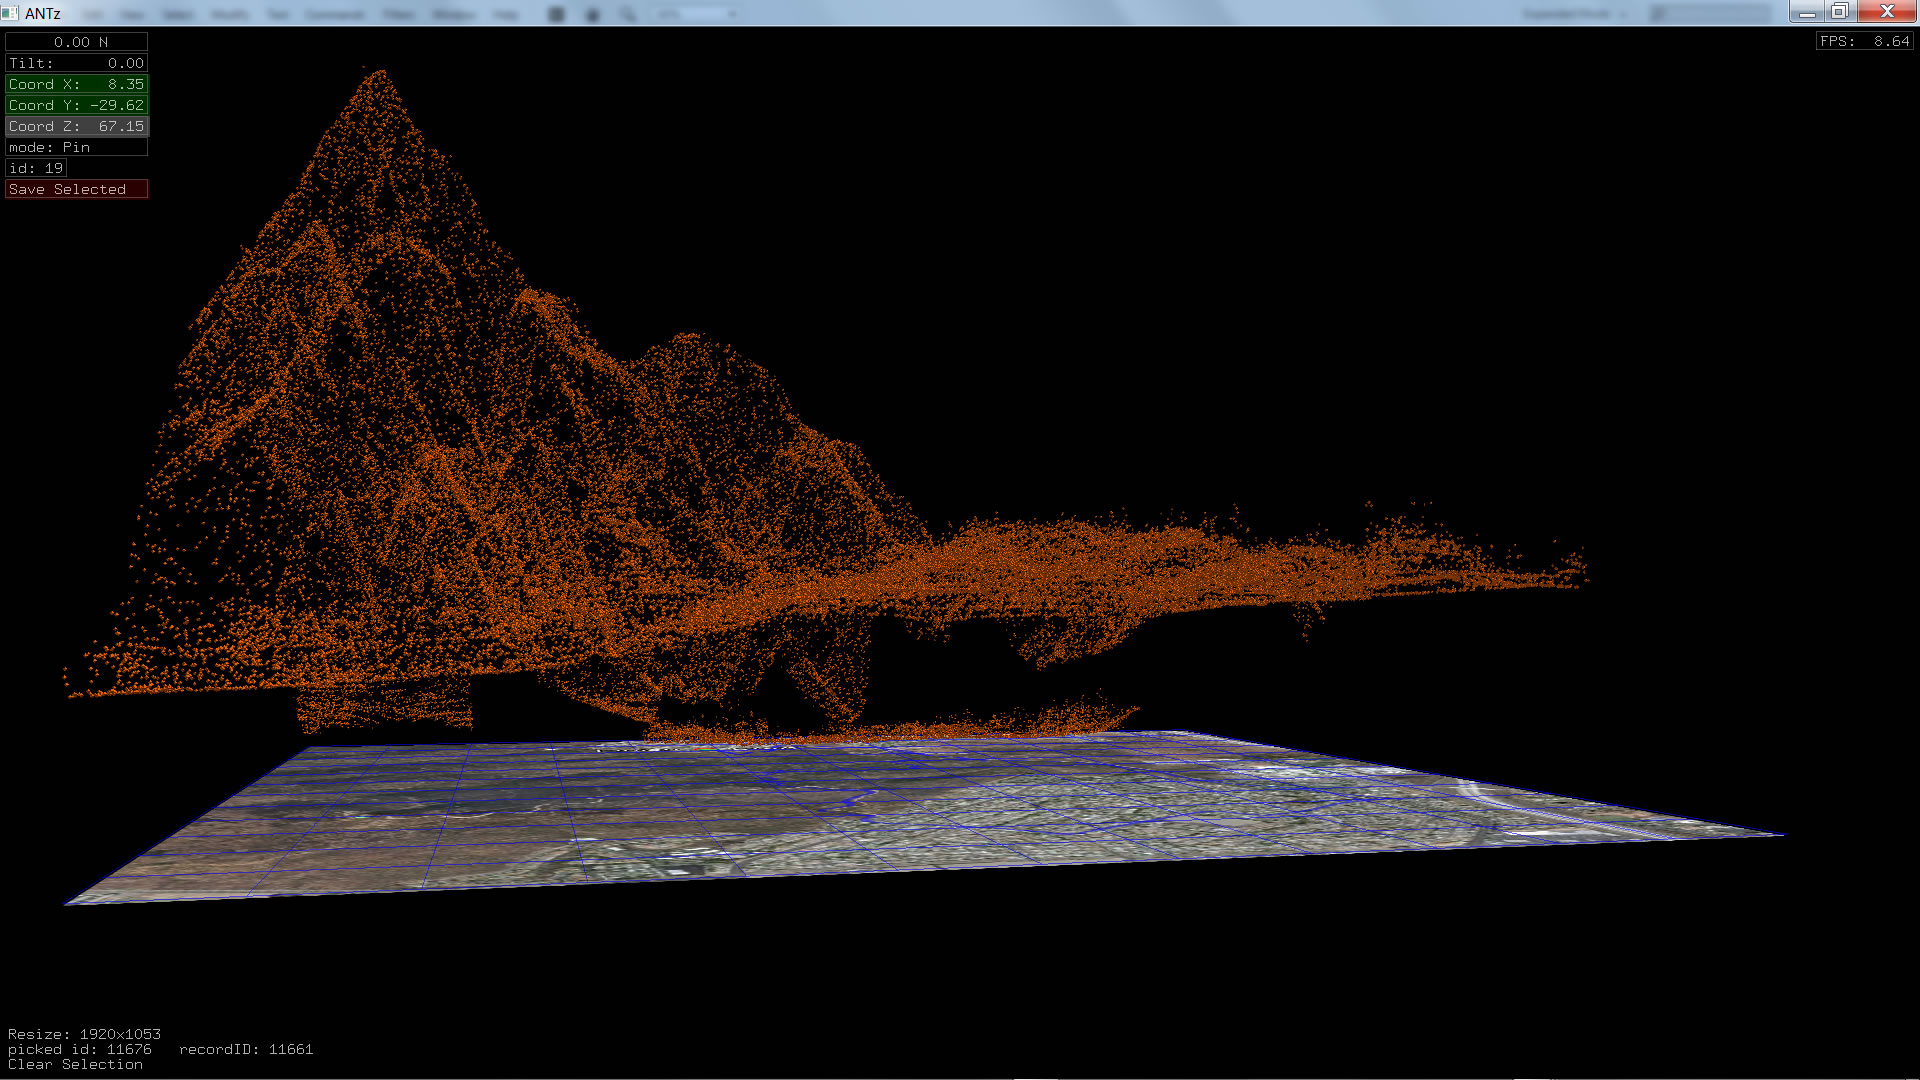
LIDAR
|
|
|
|
 |
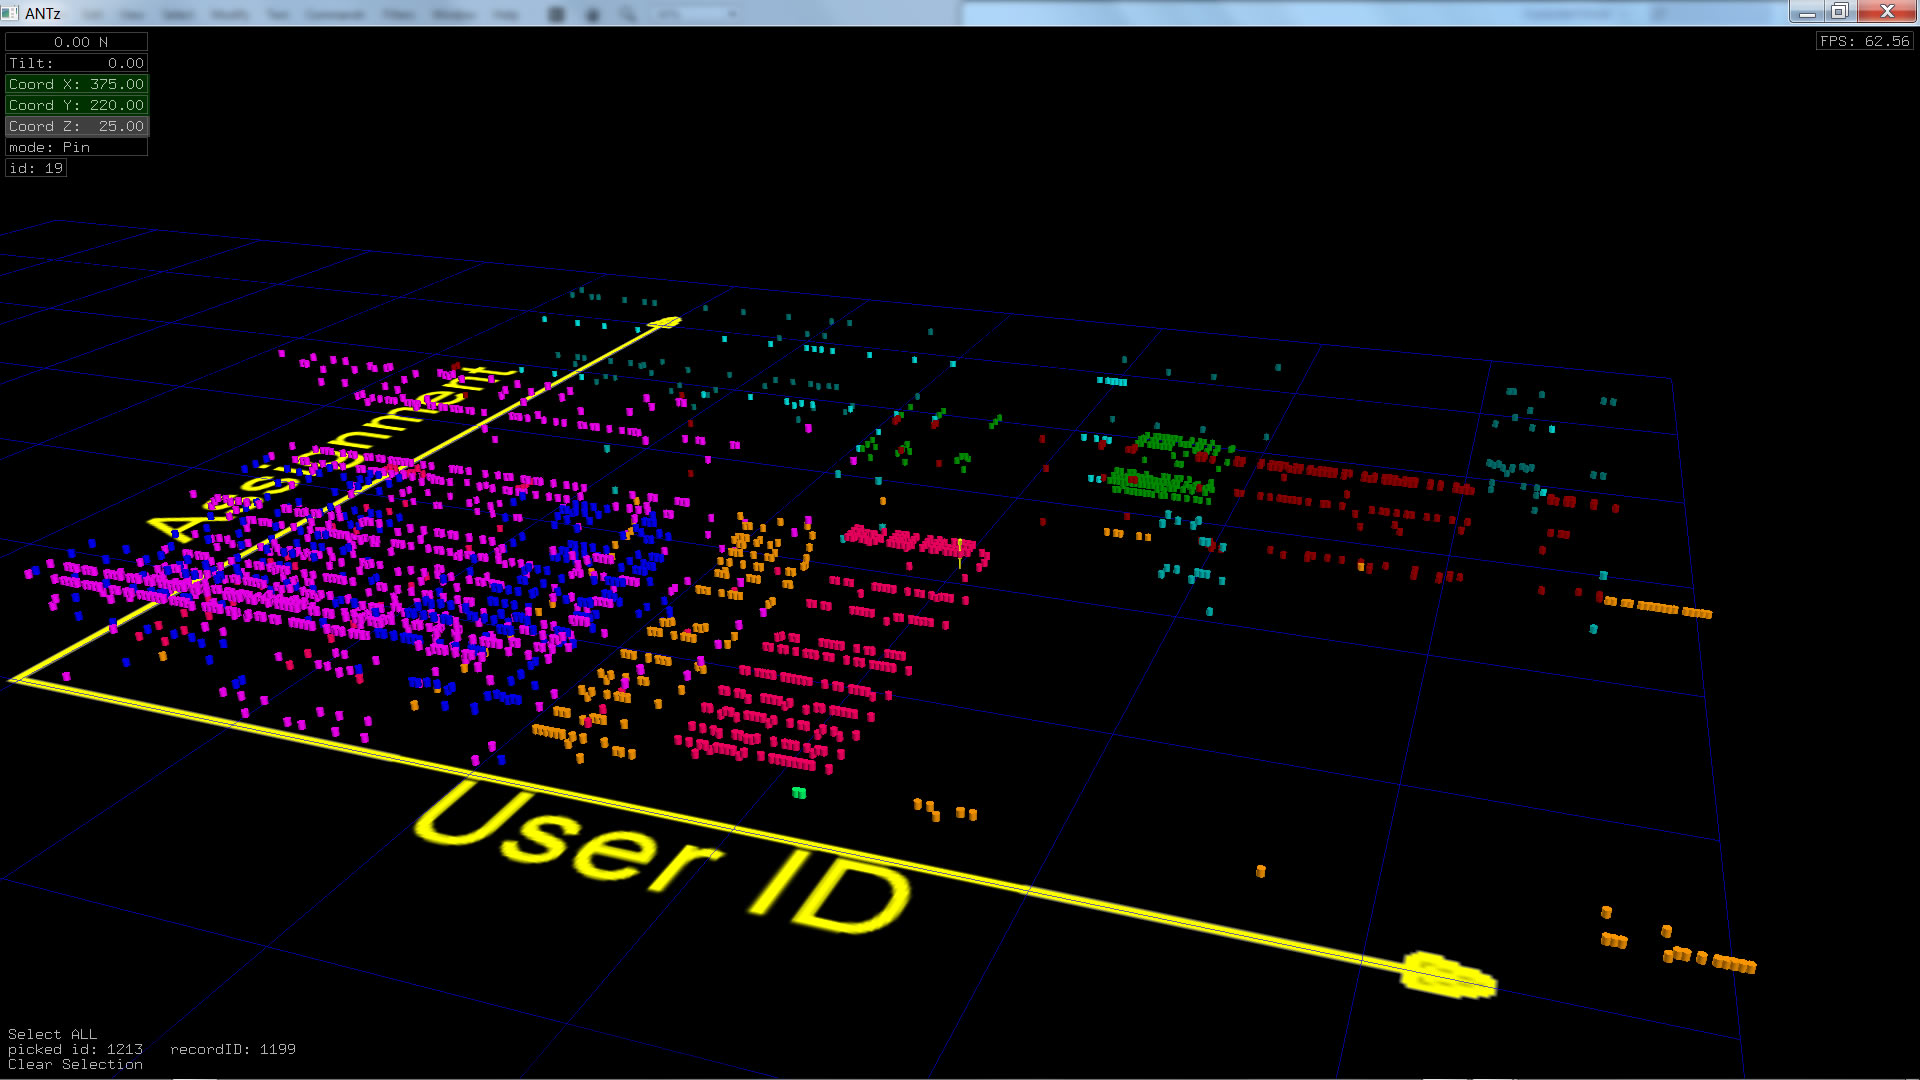
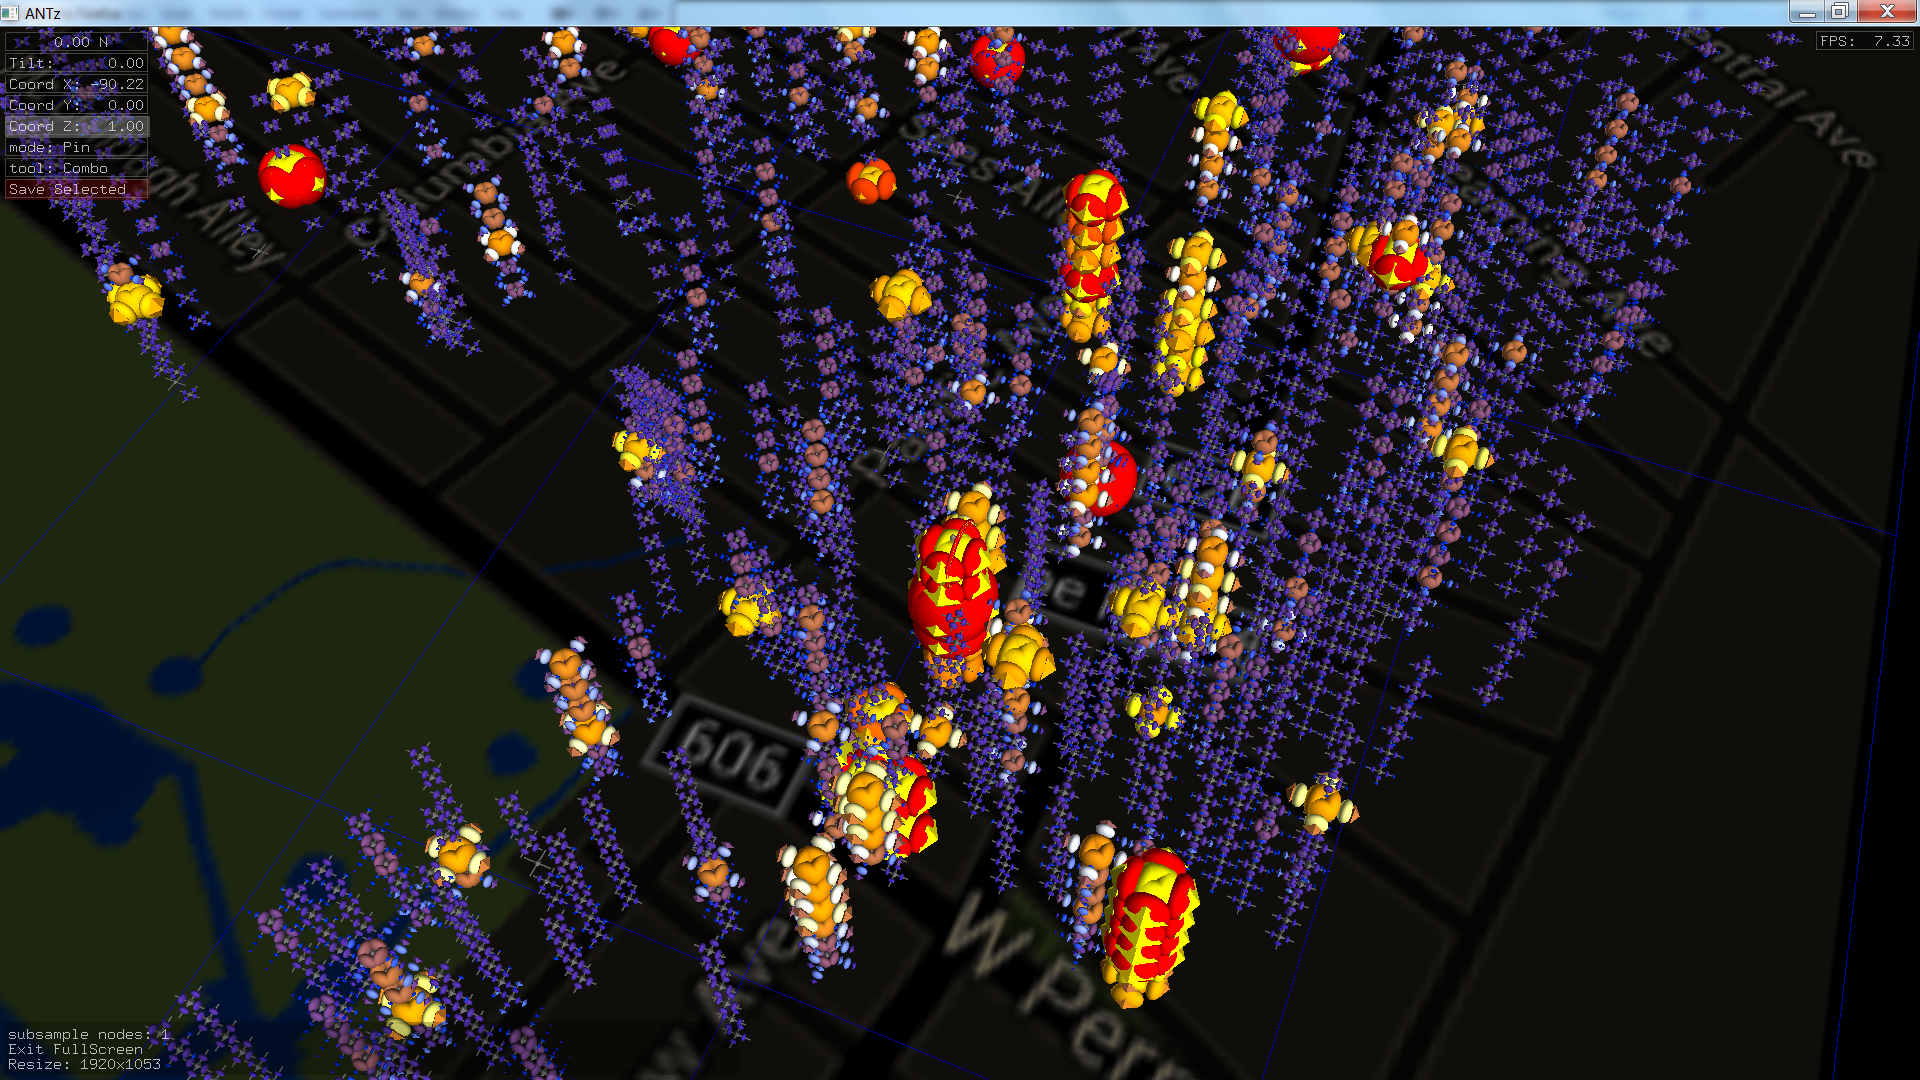
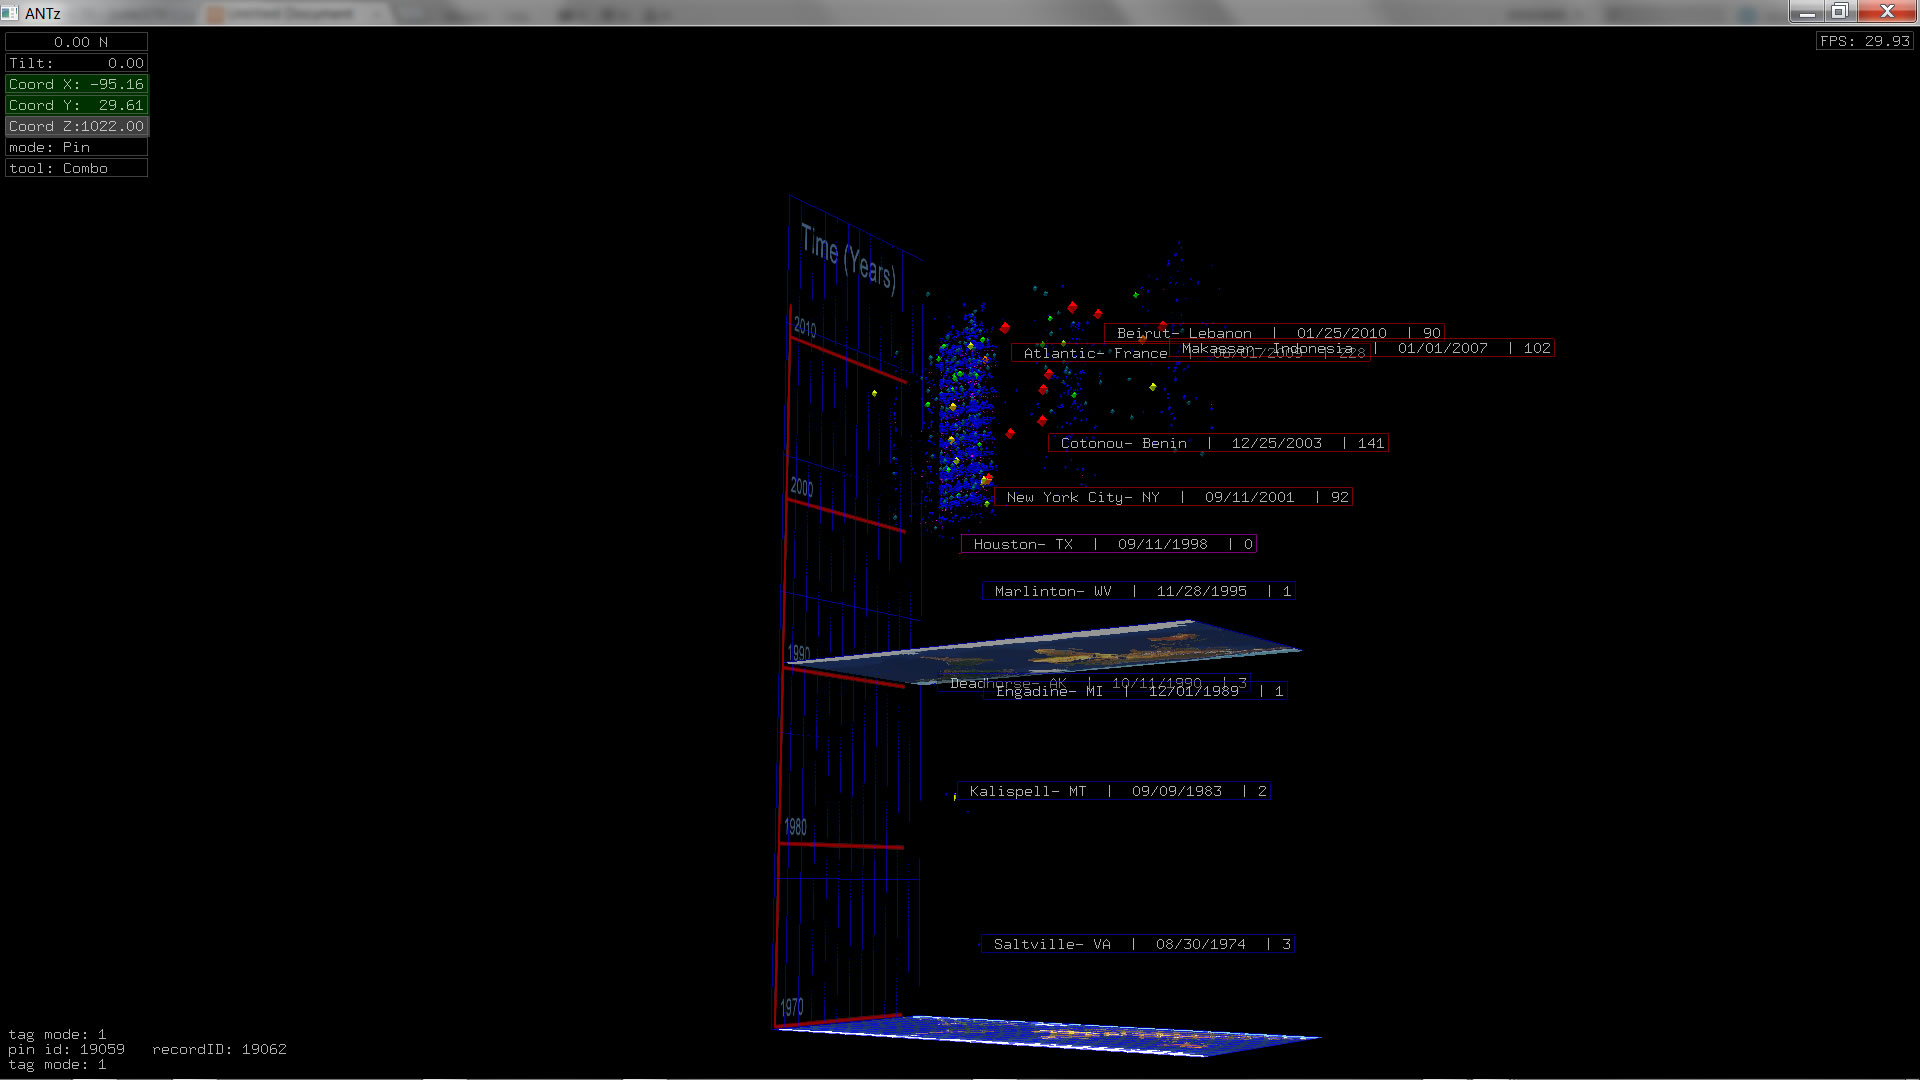
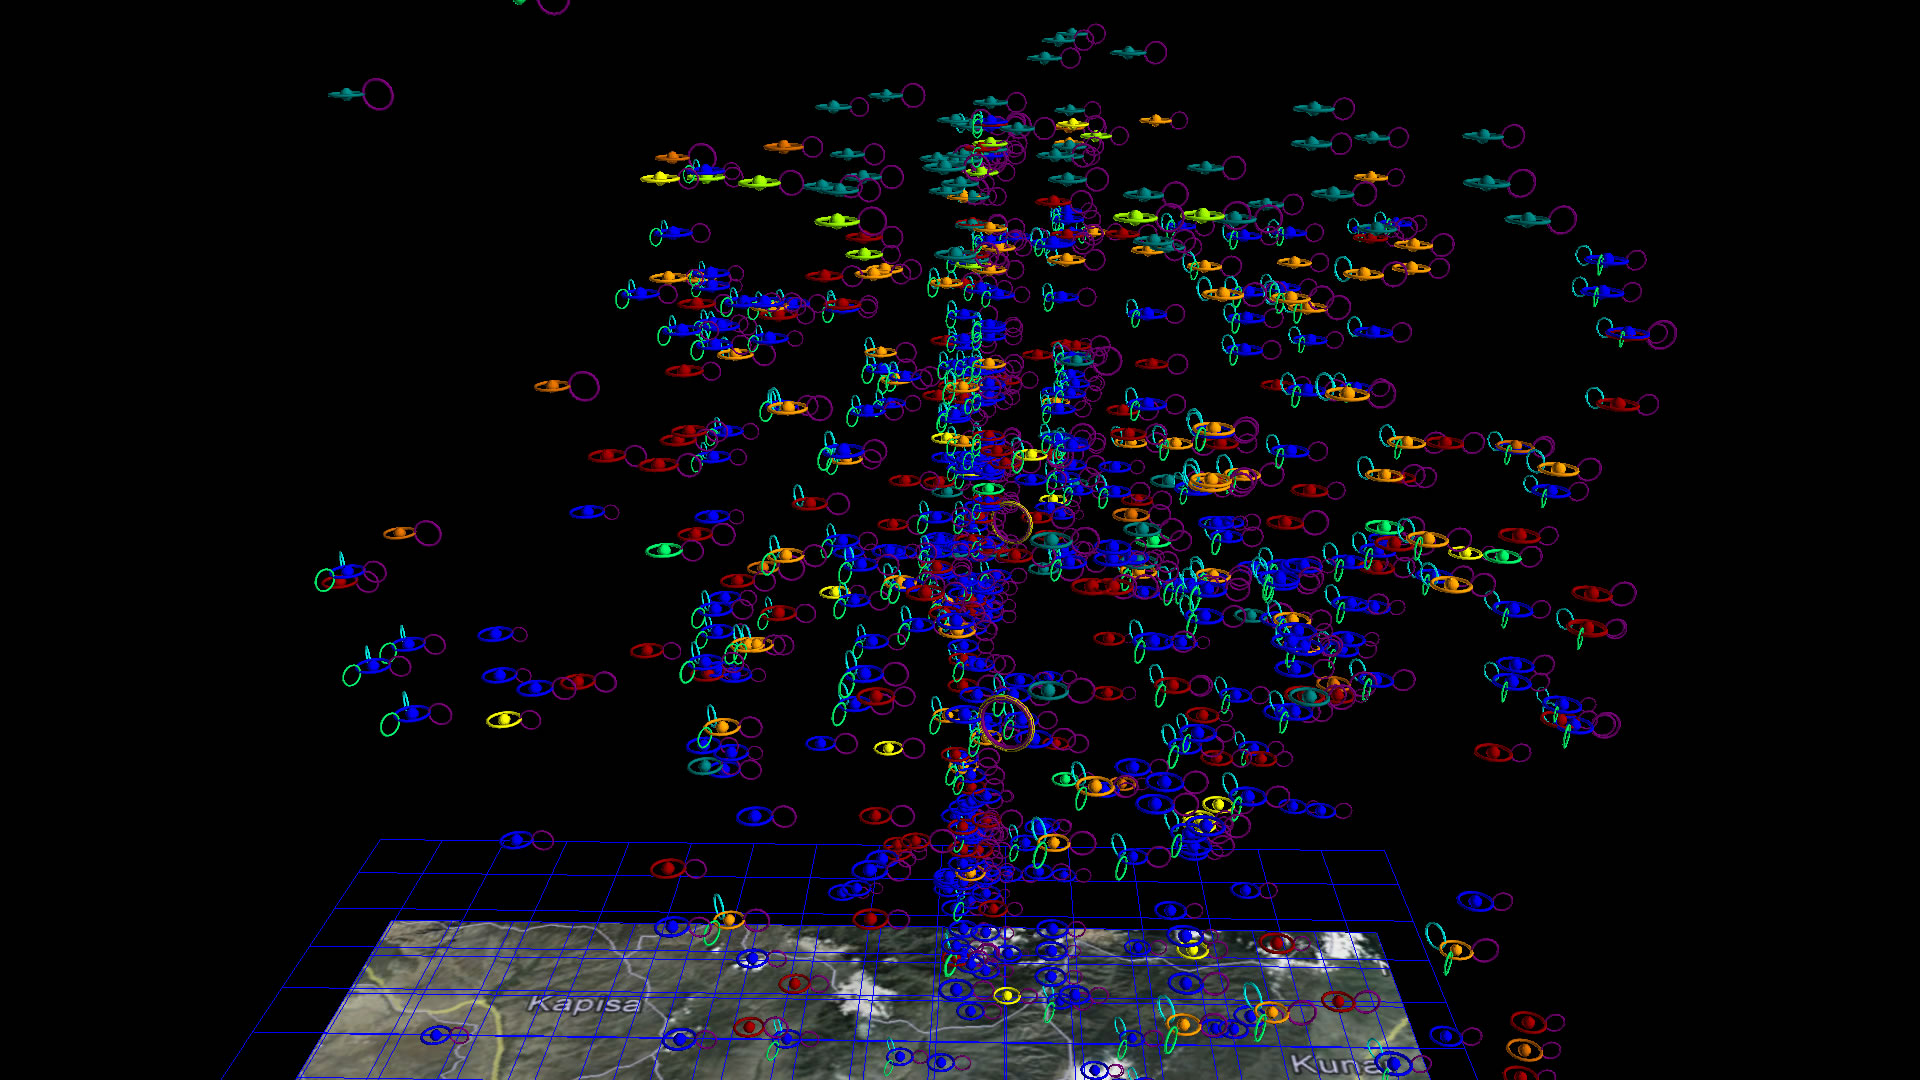
Aviation Accidents, 1970 to present
|
|
|
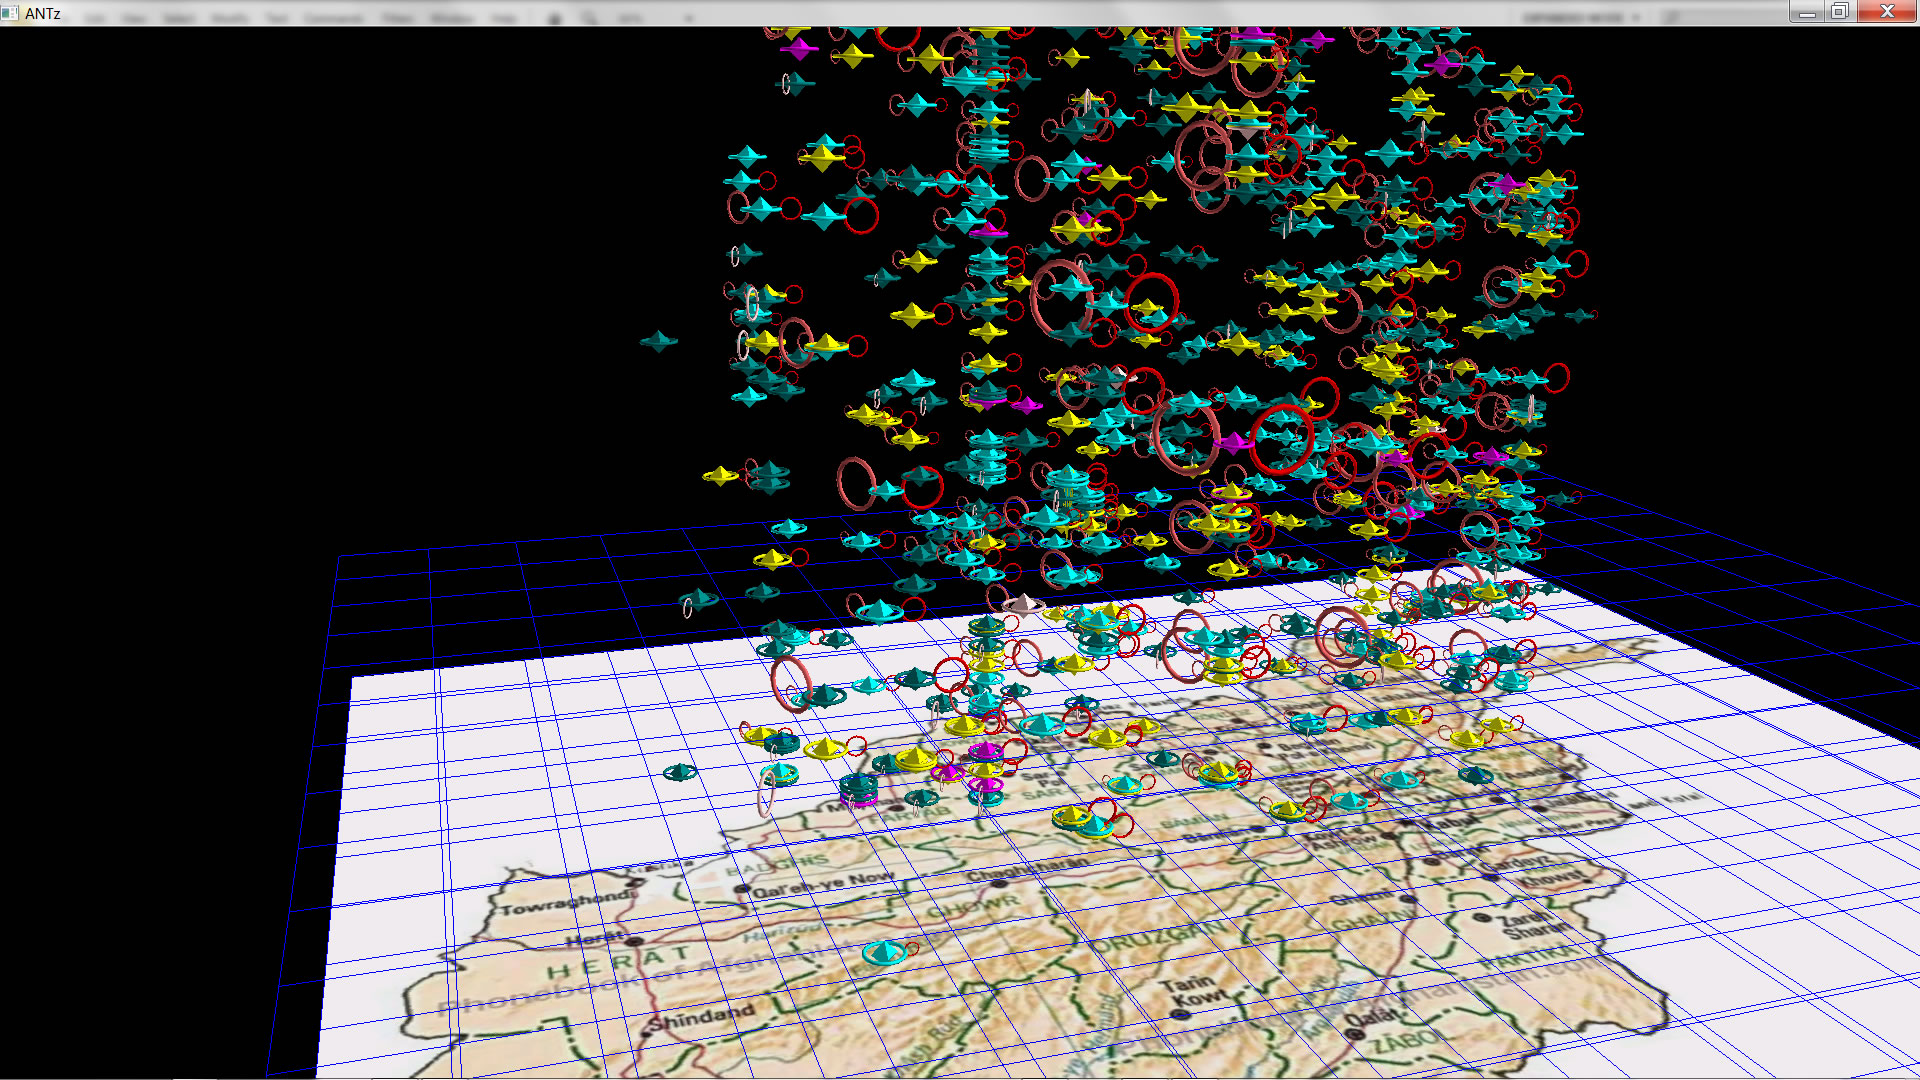
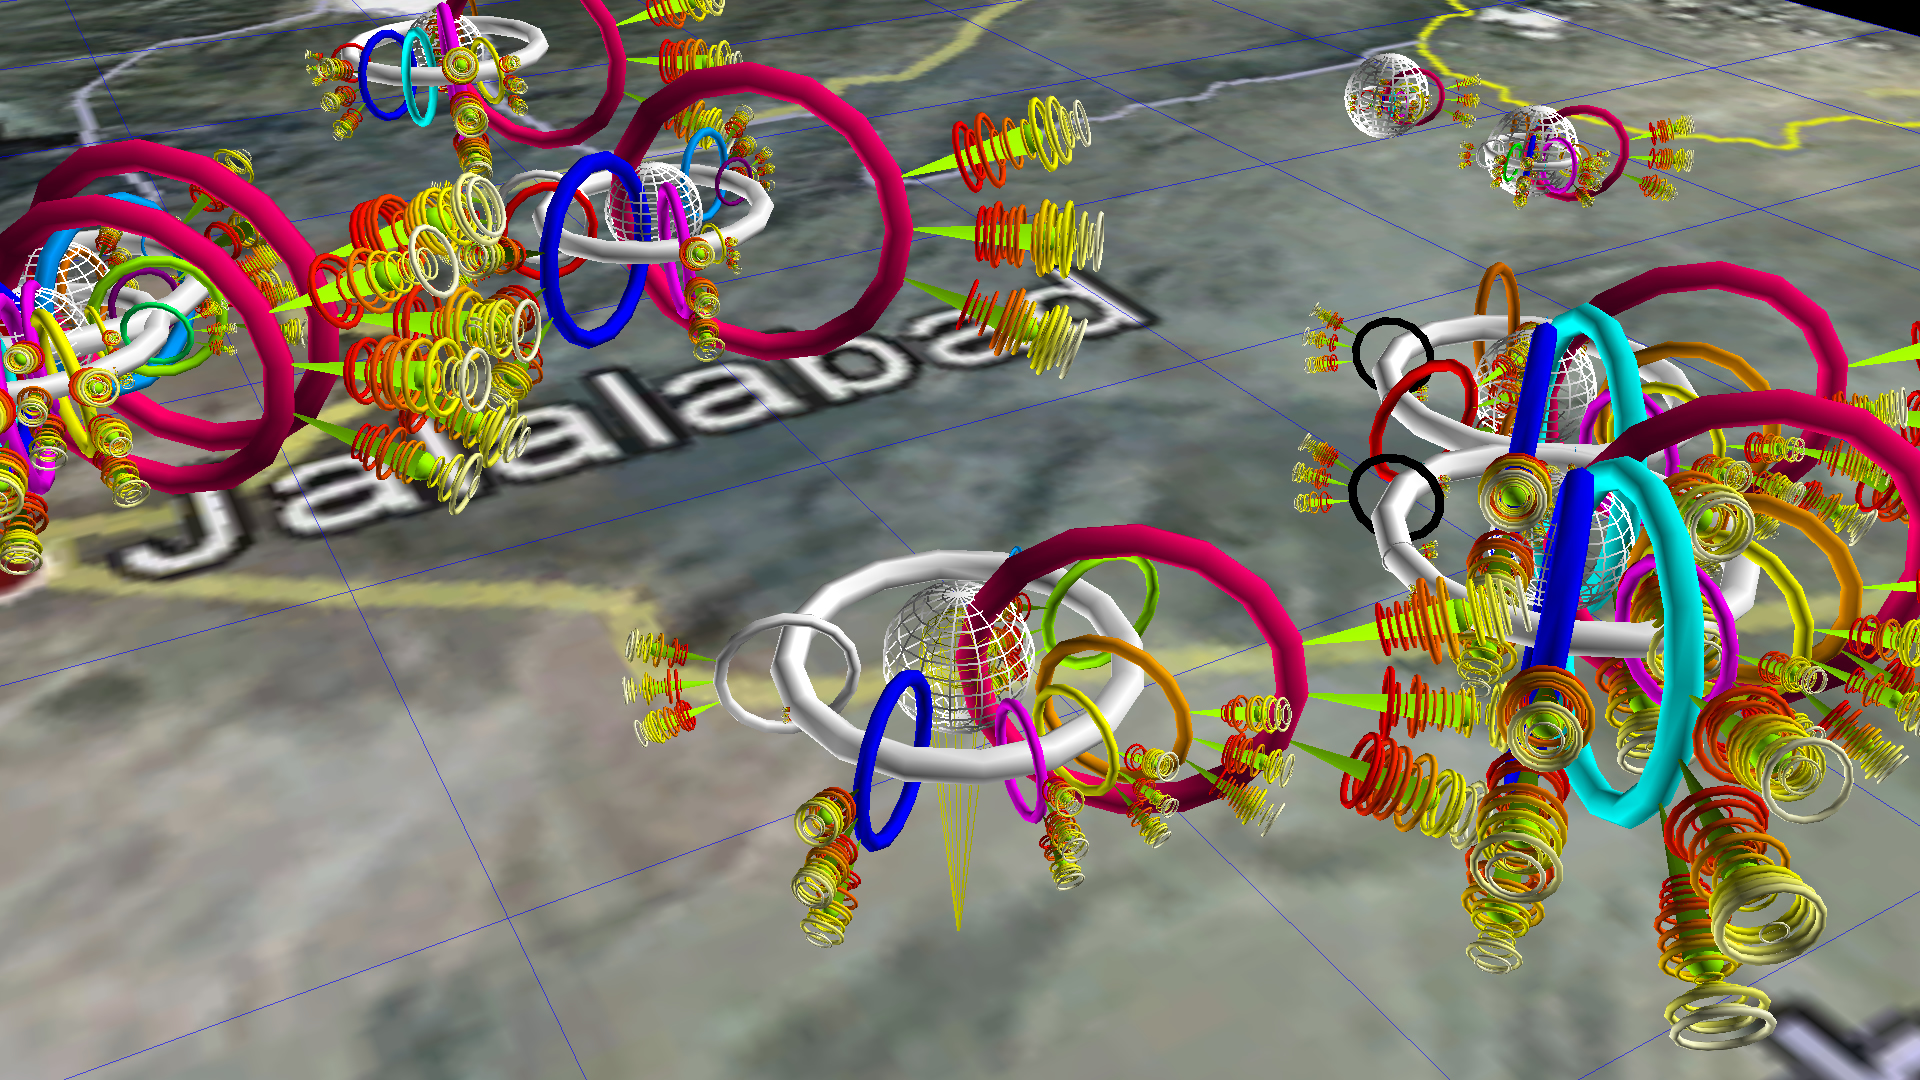
Get more data, more pics, etc. Learn more about this dataset and related research at the SUNY-Binghamton CIRI Human Rights site. |
 |
 |
|
 |
|
|
|
|
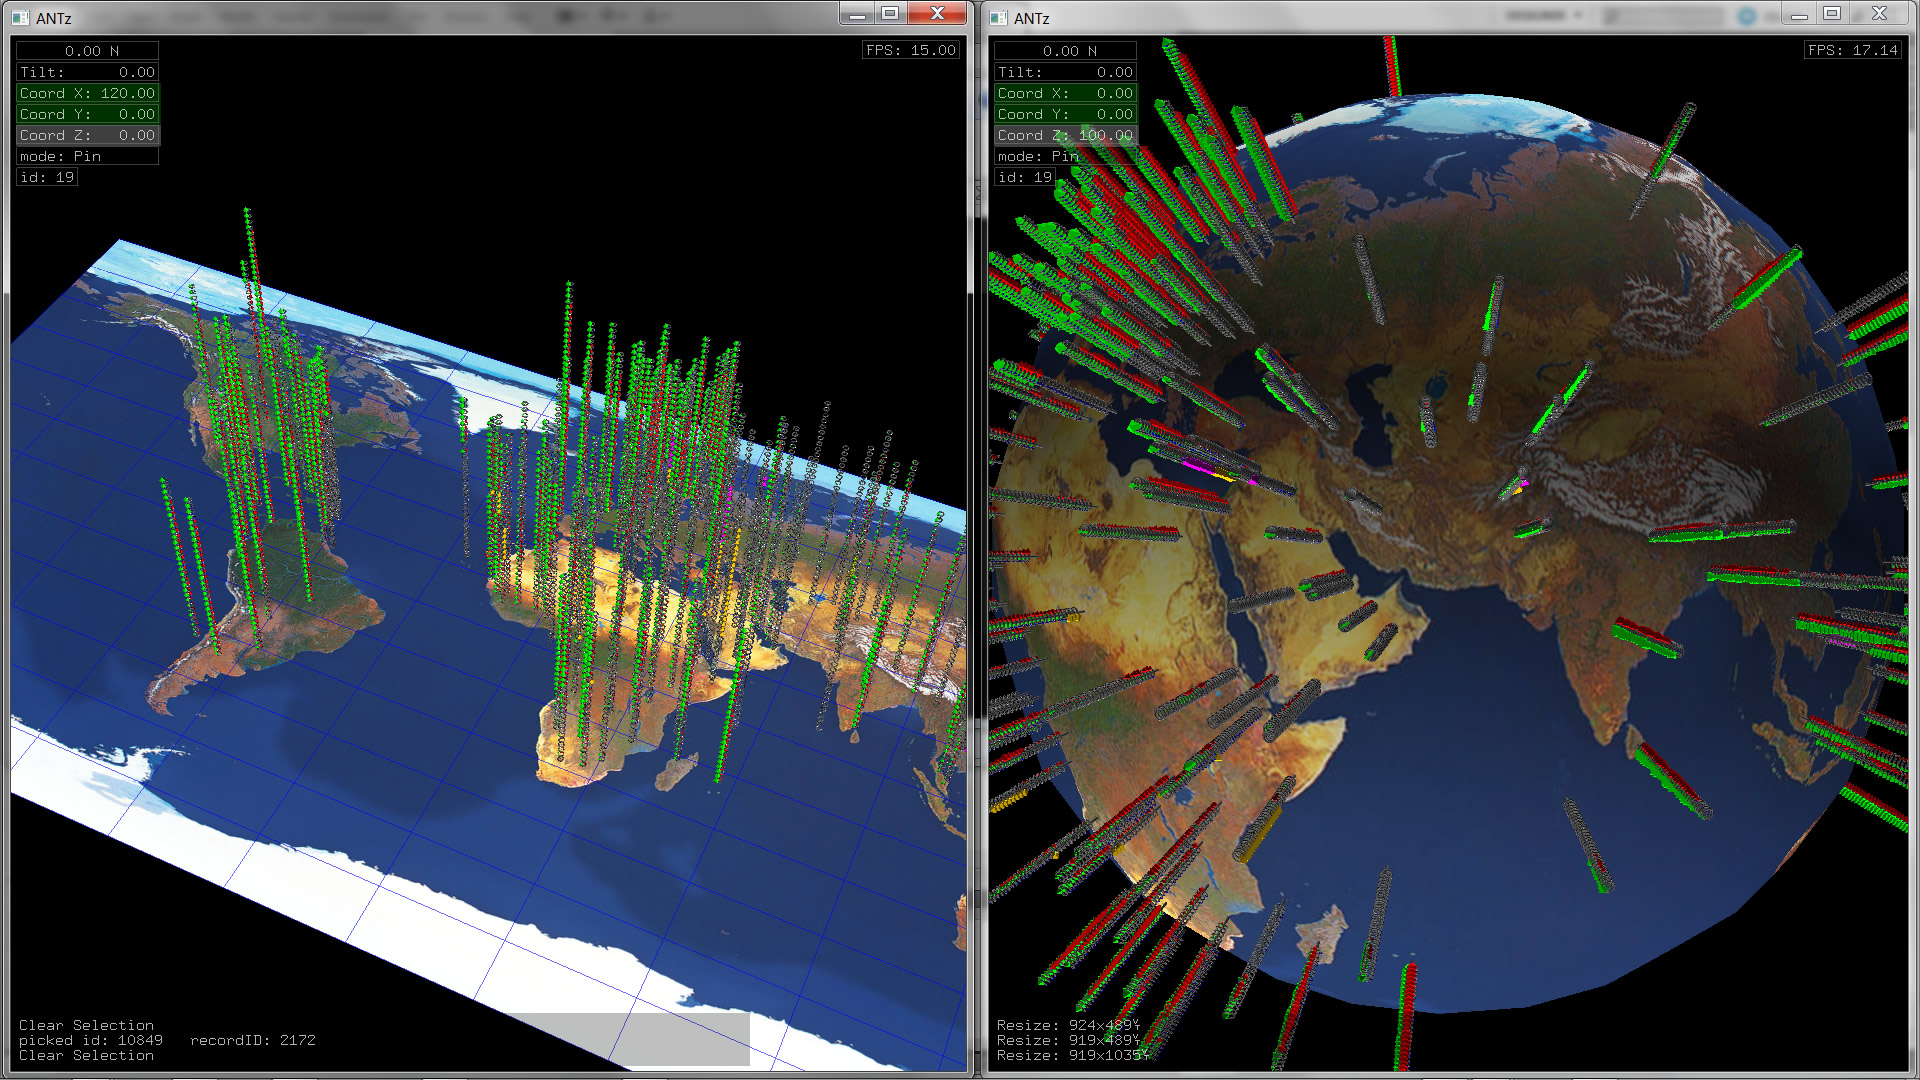
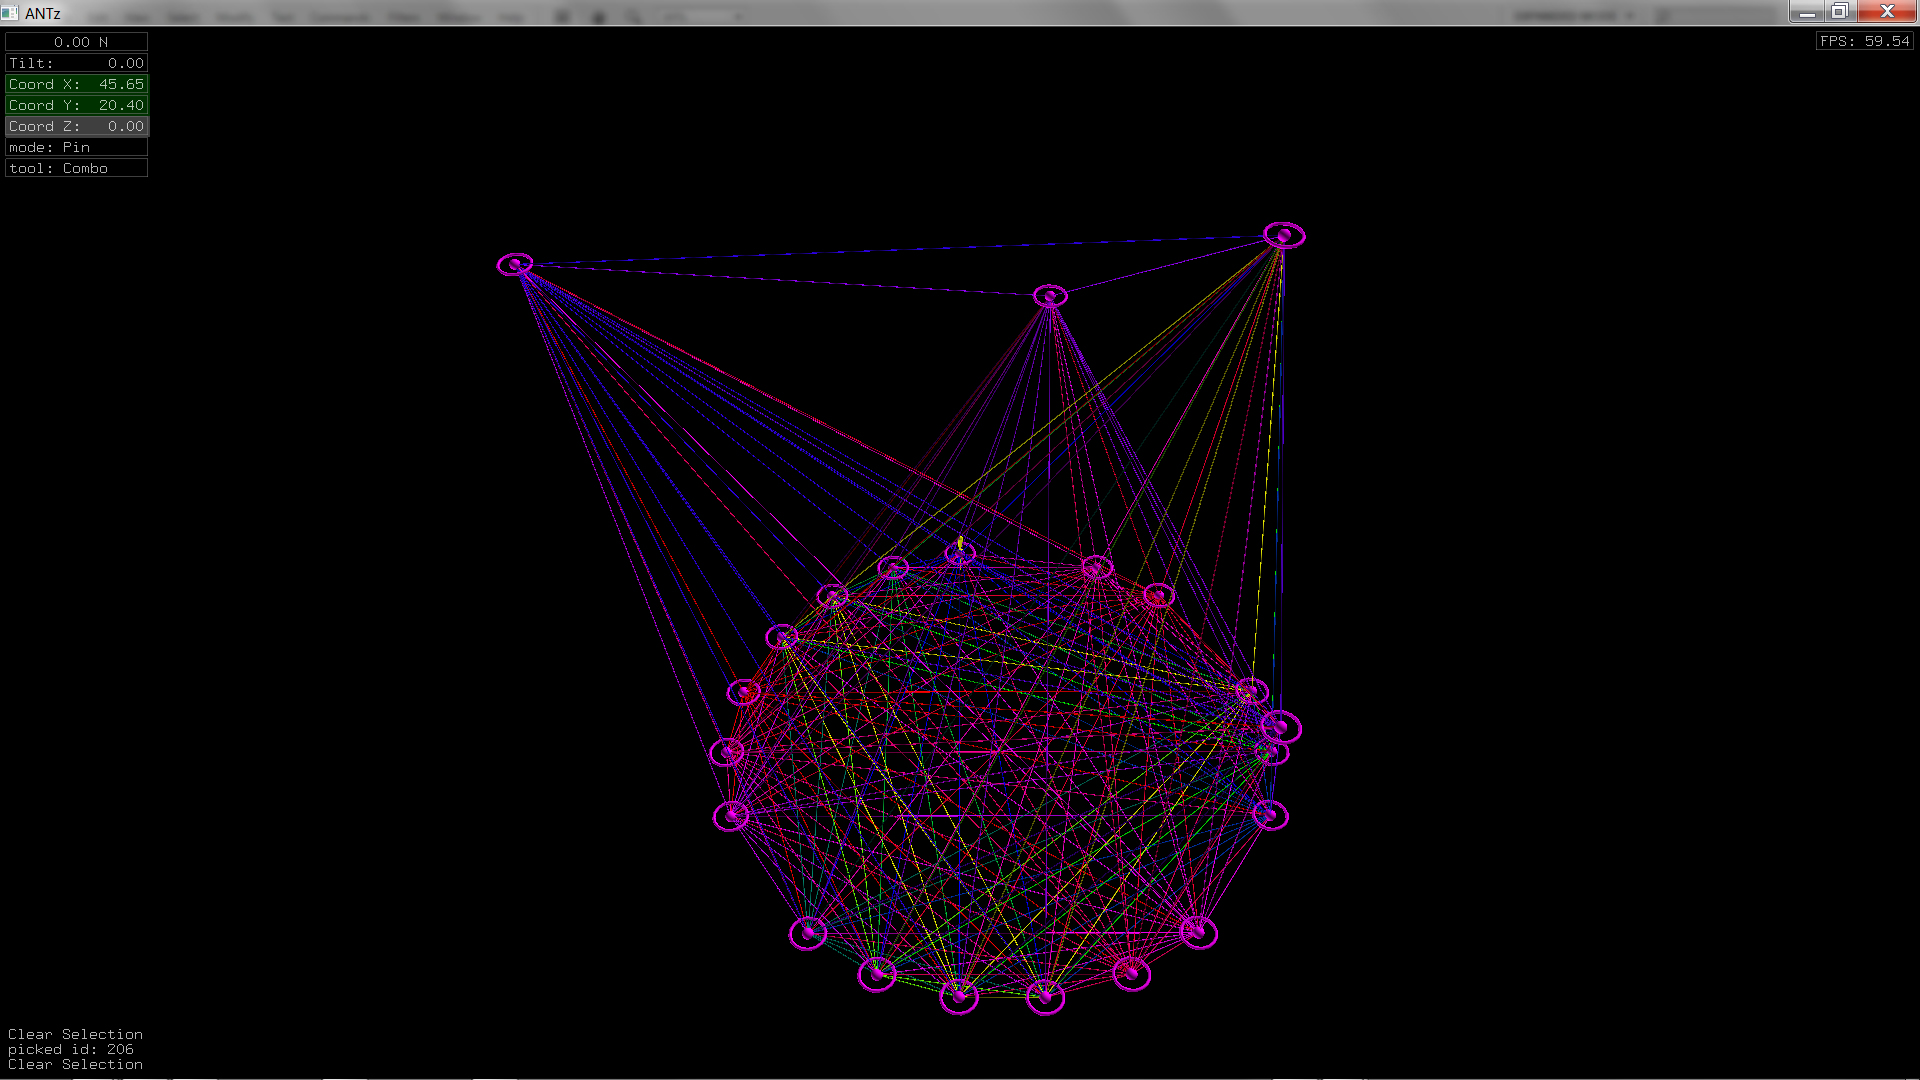
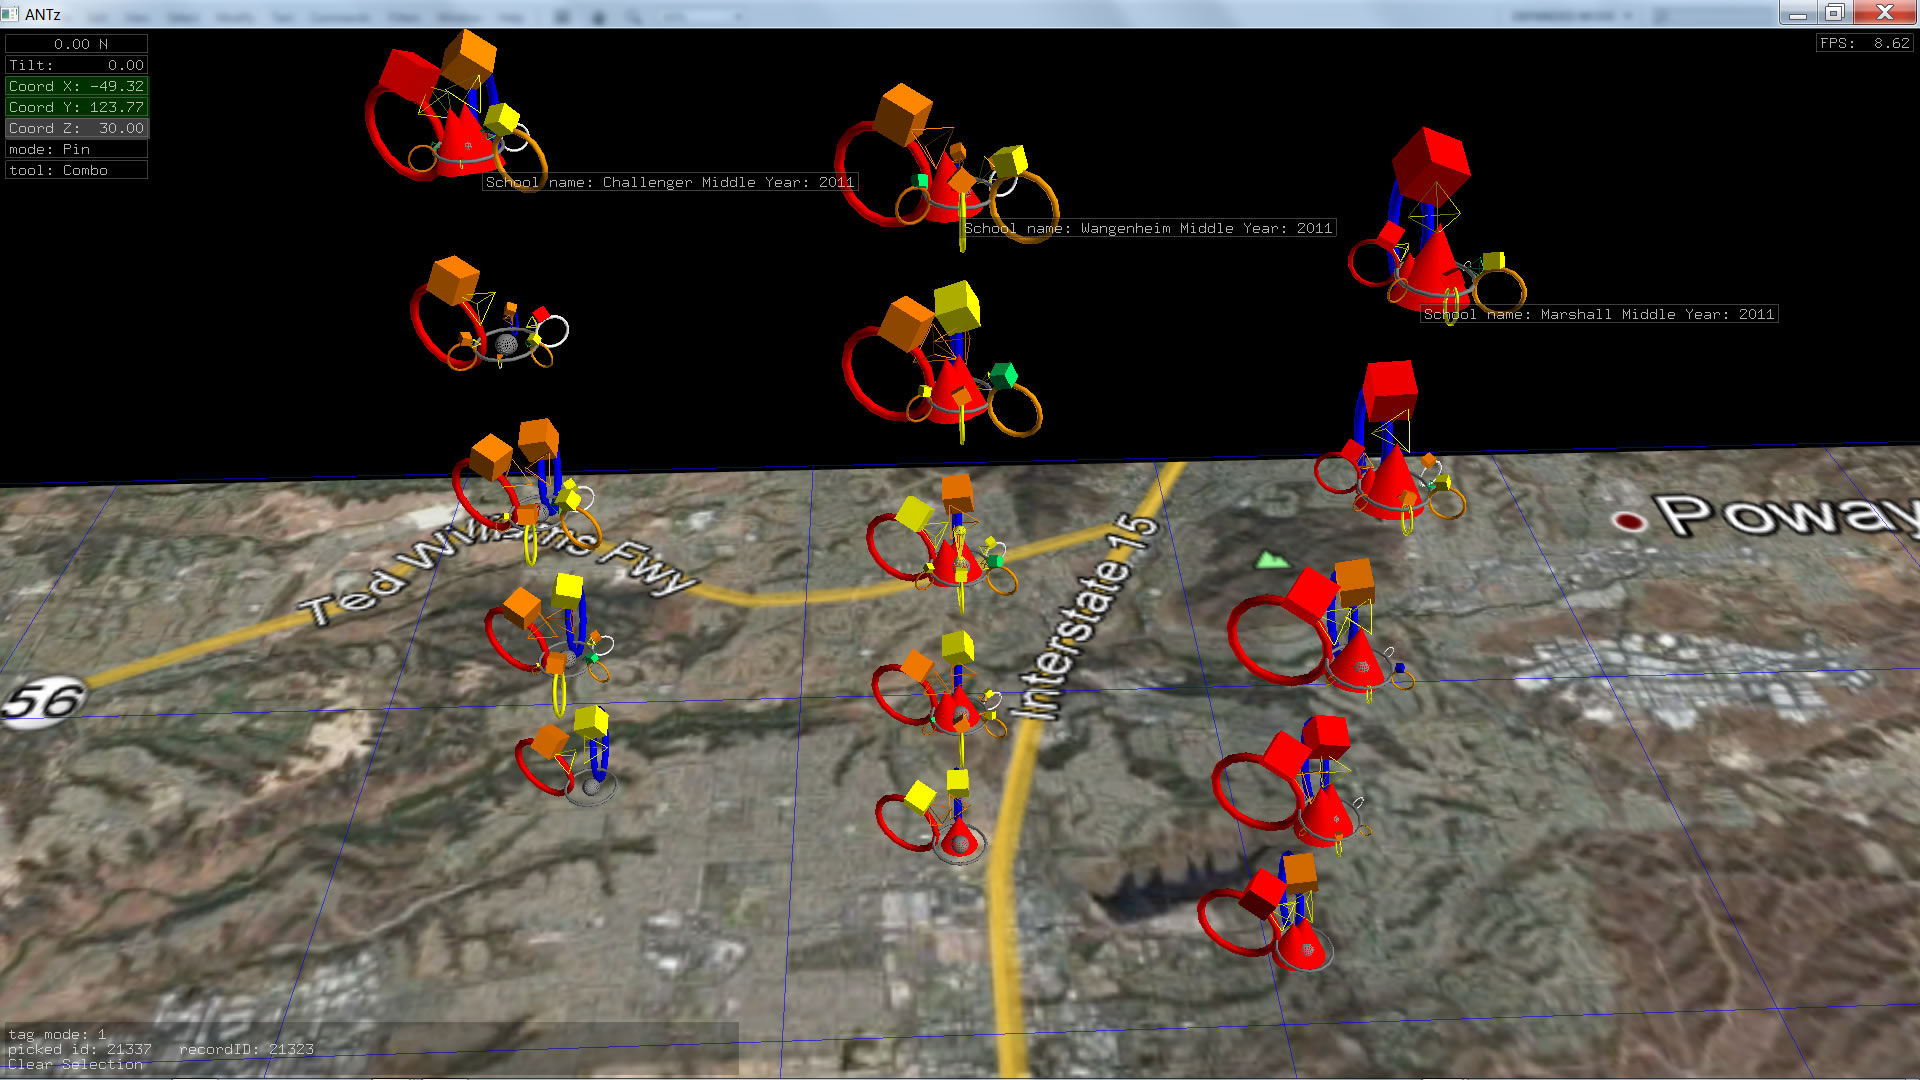
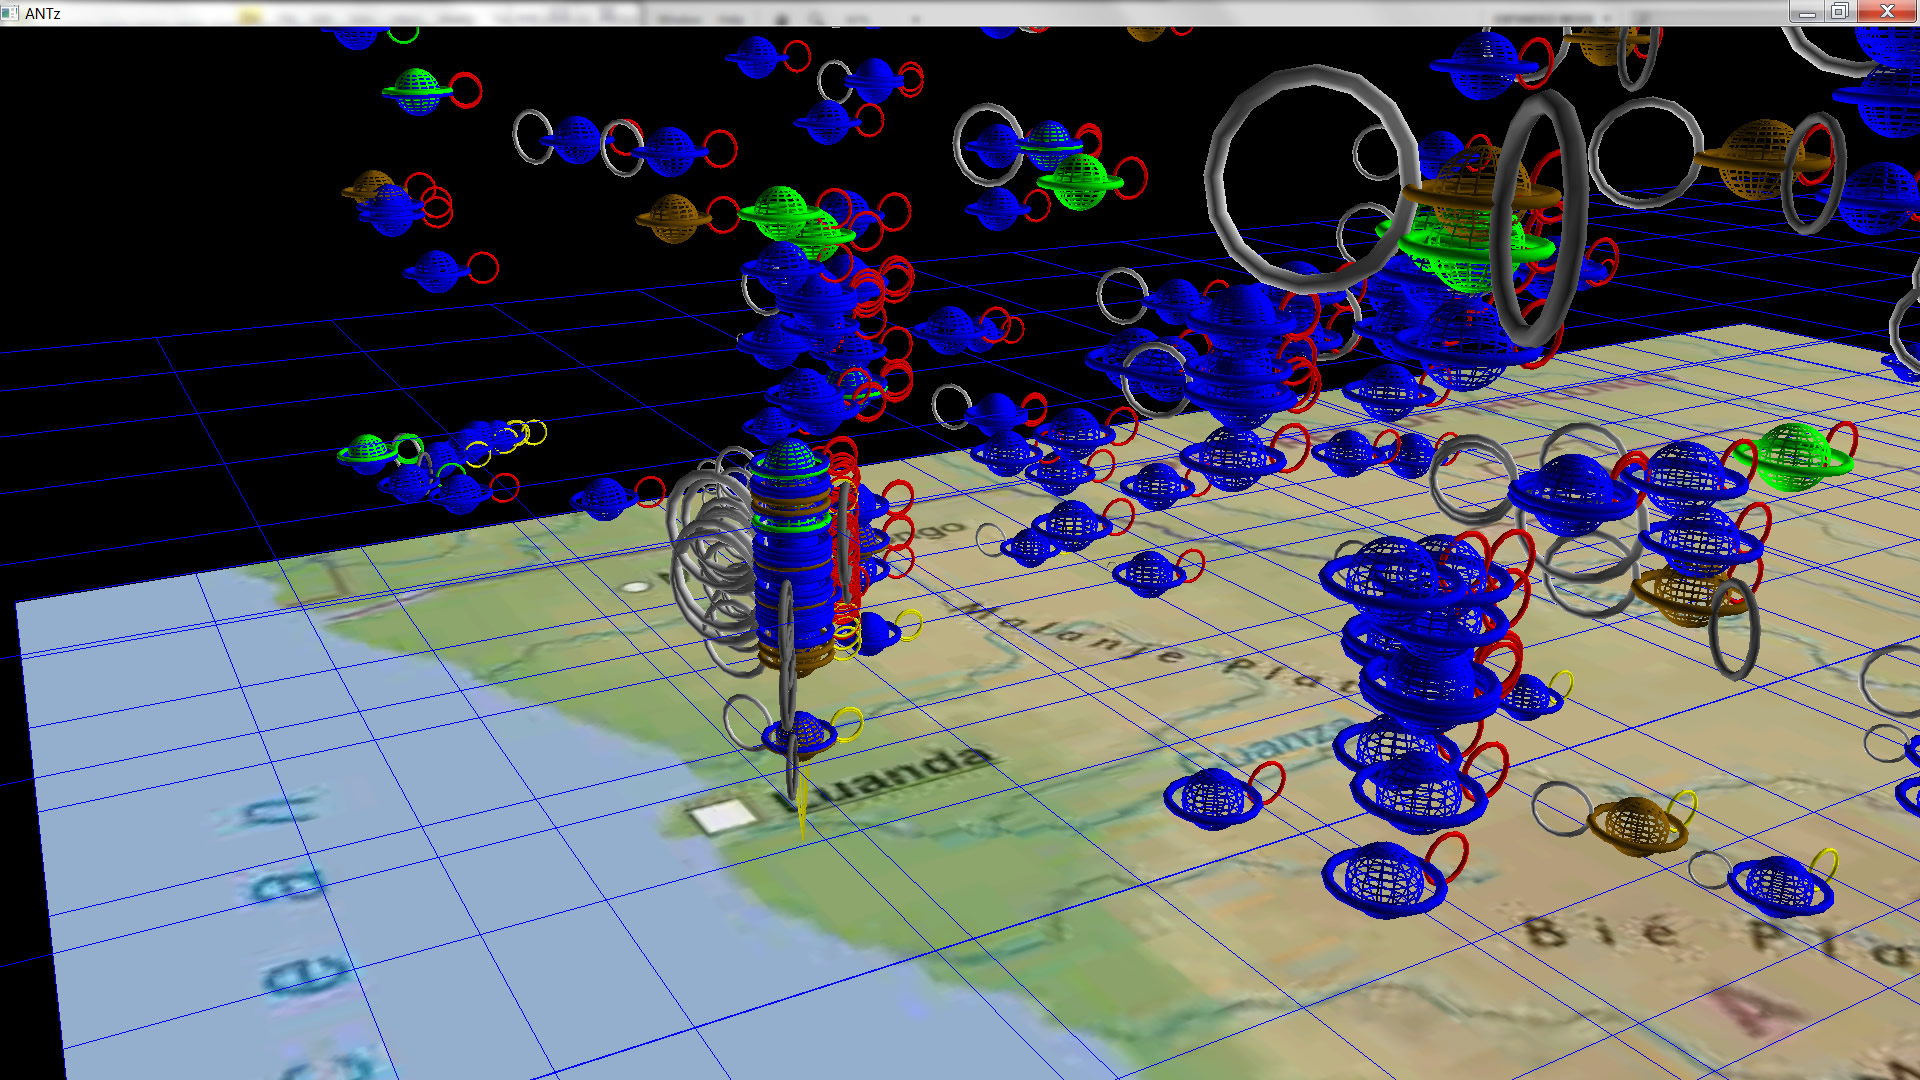
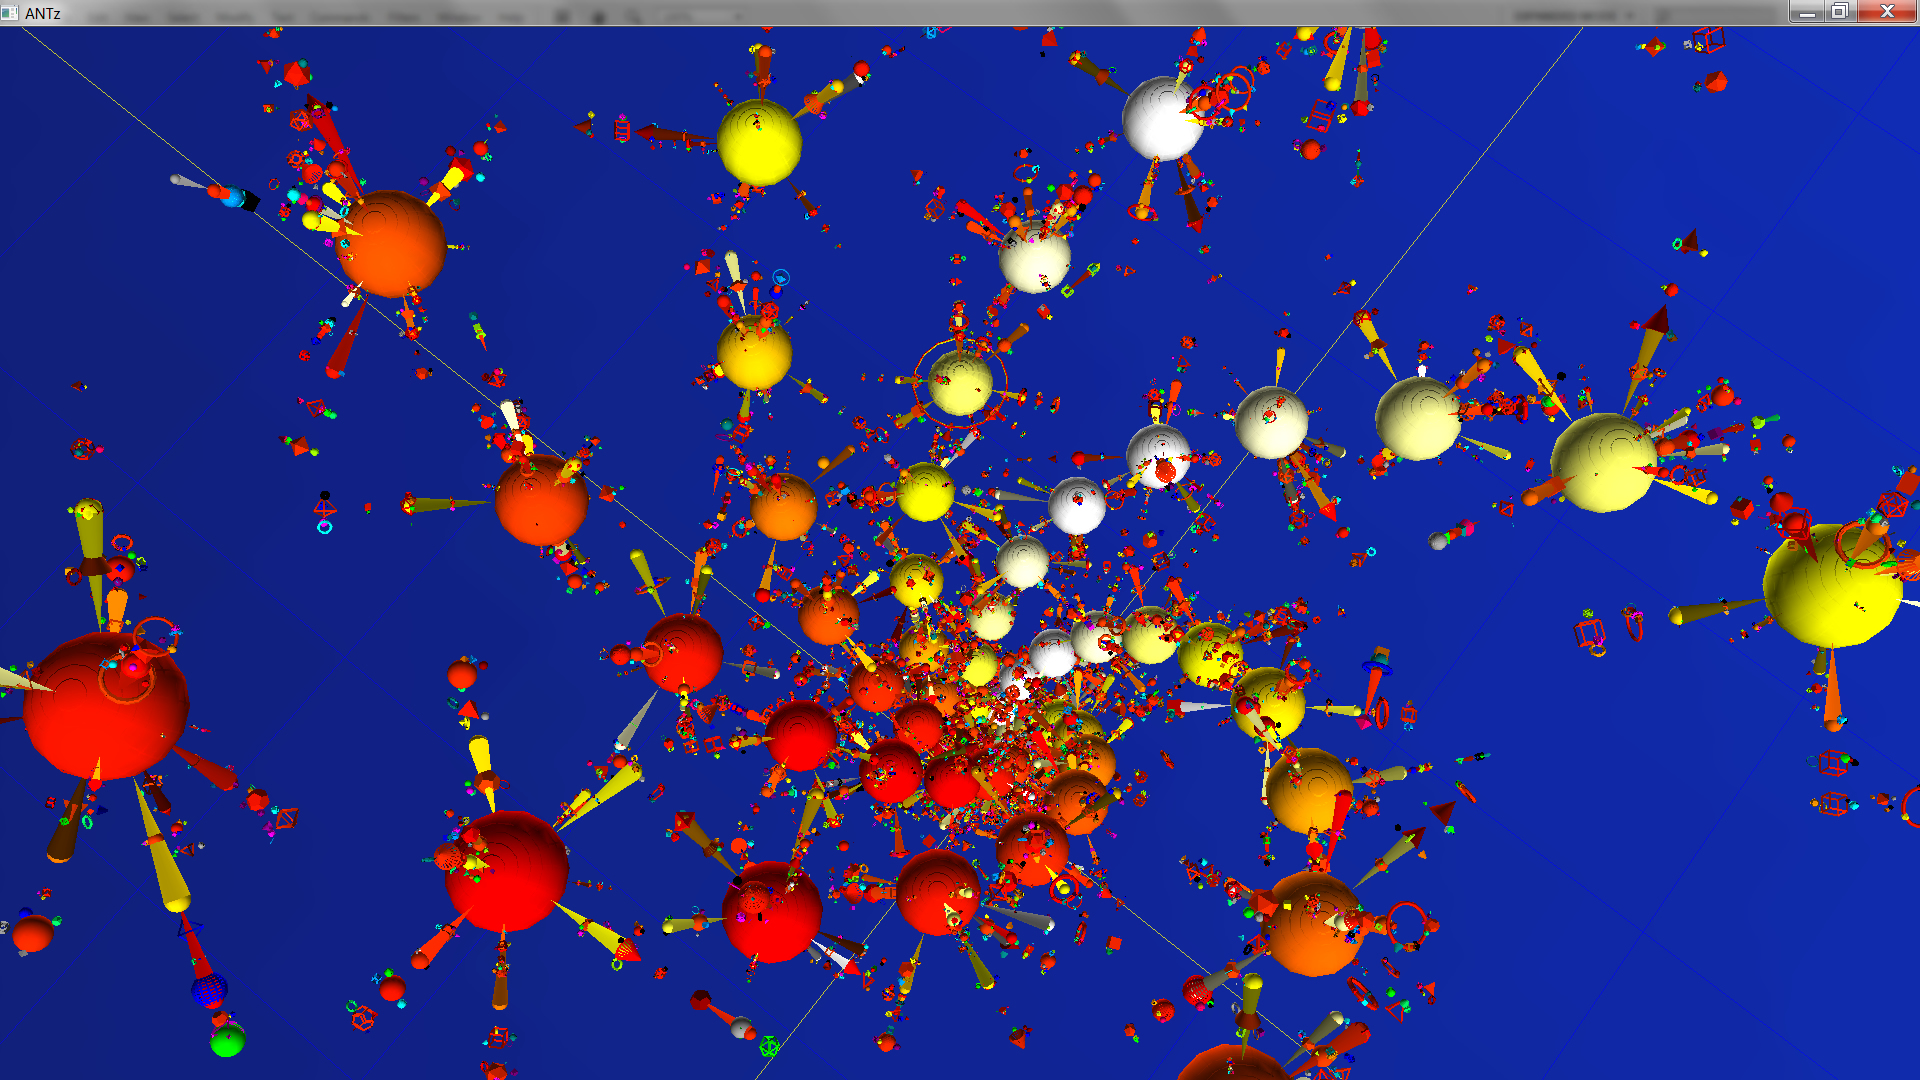
Hypothetical visualization of current state of global economy by country, or corporation, or major city. |
|
|
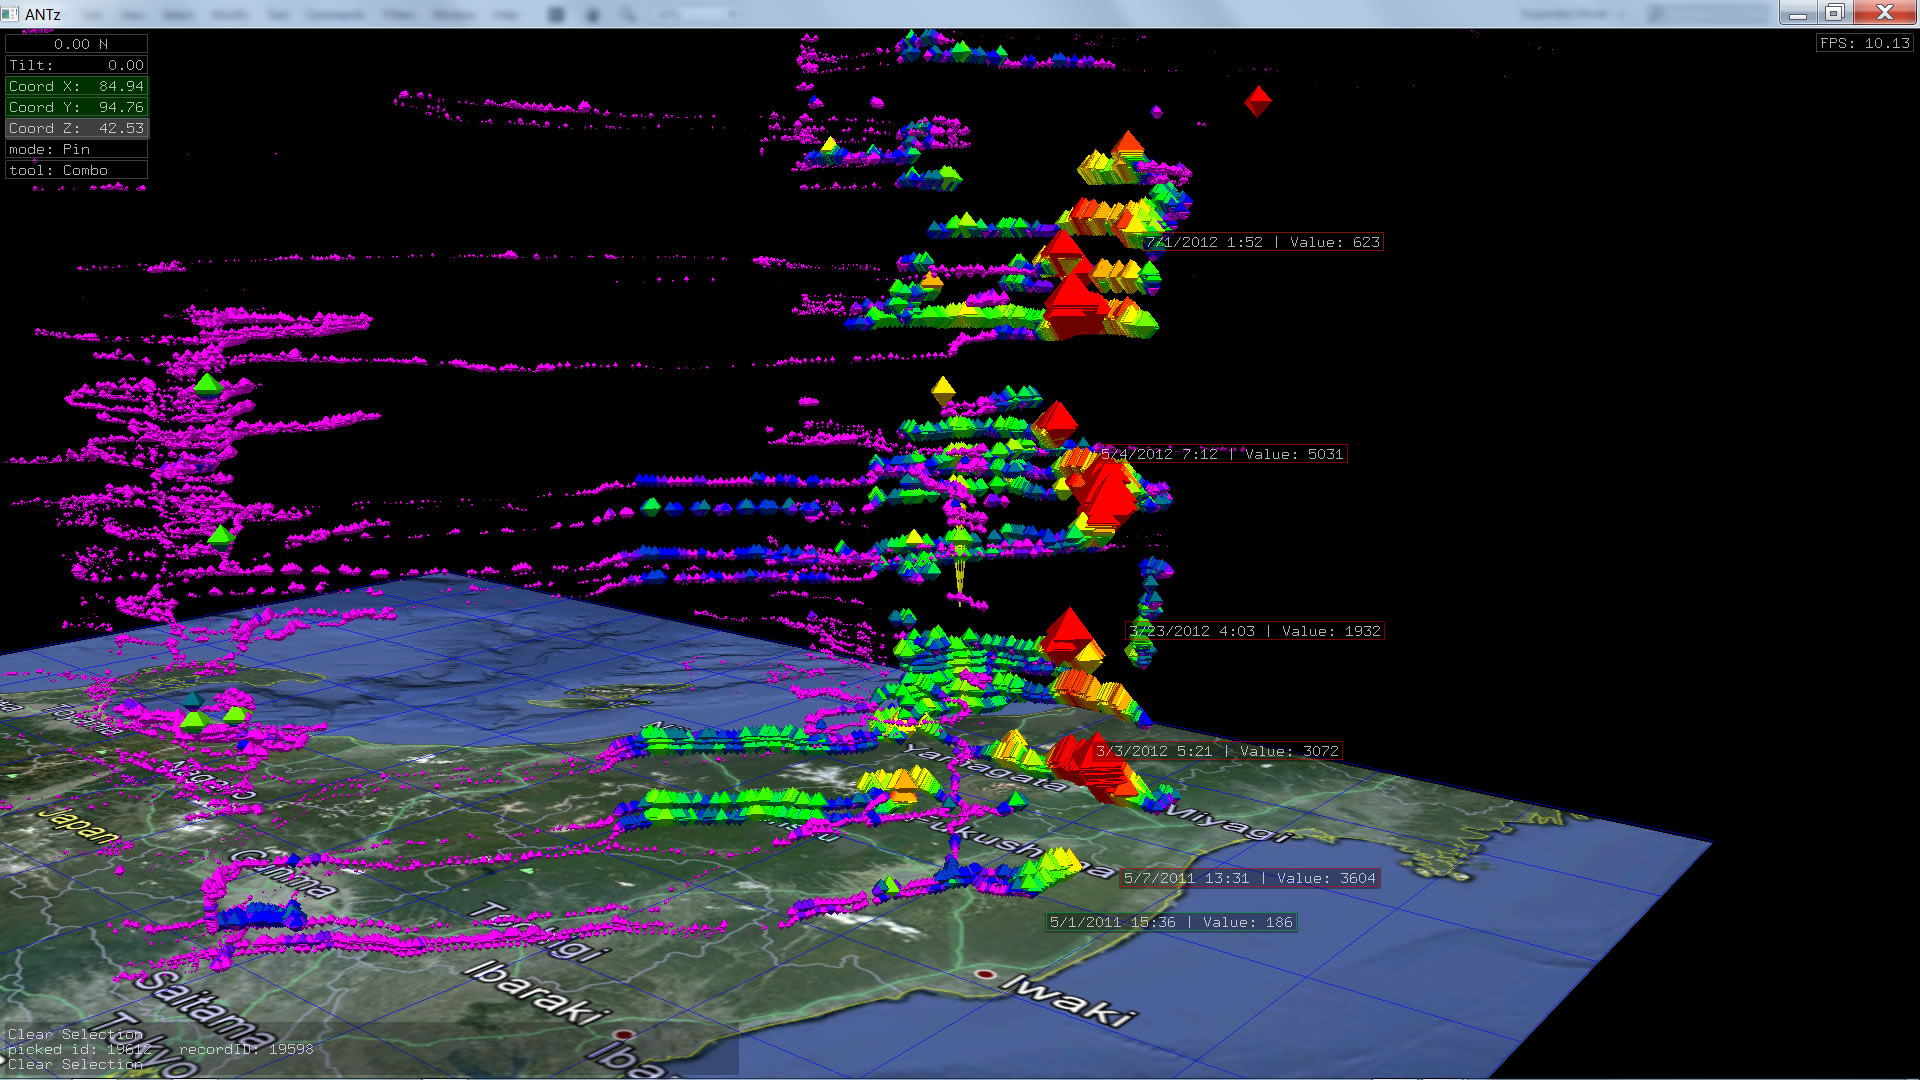
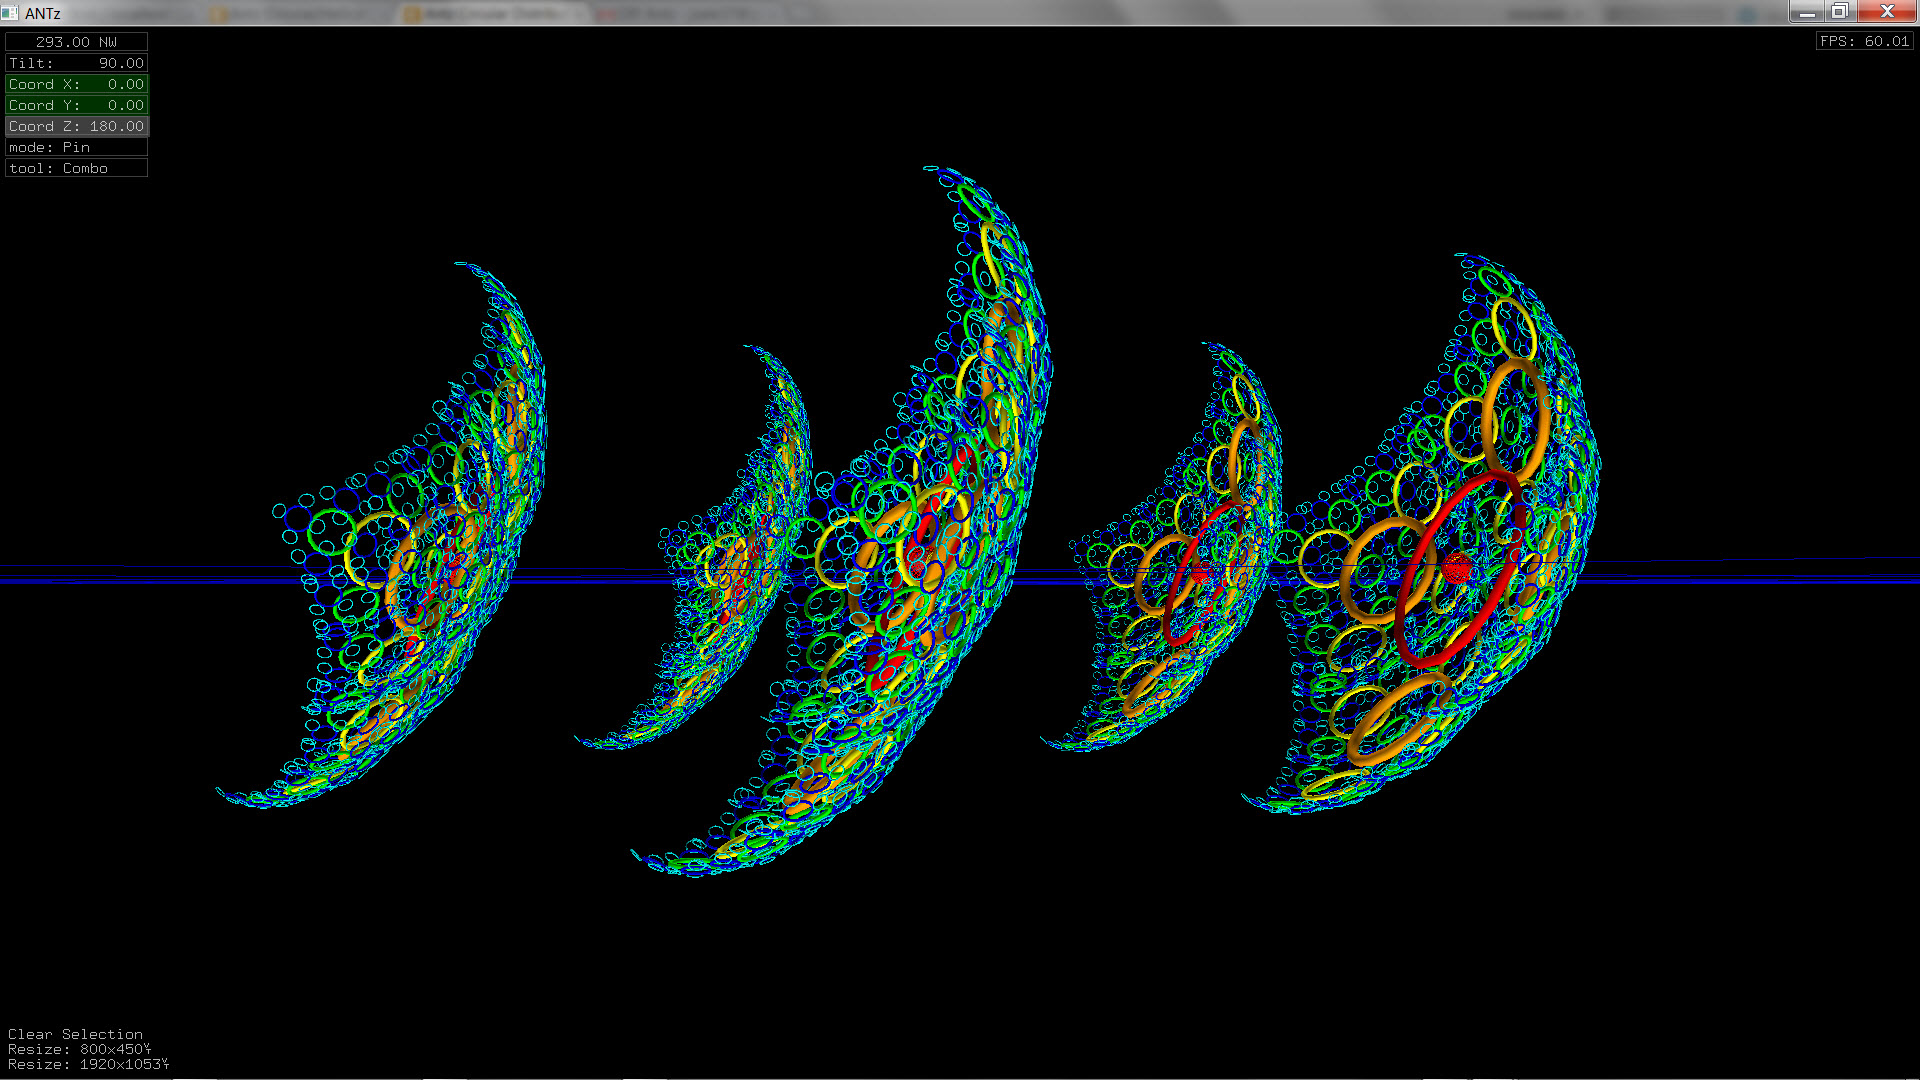
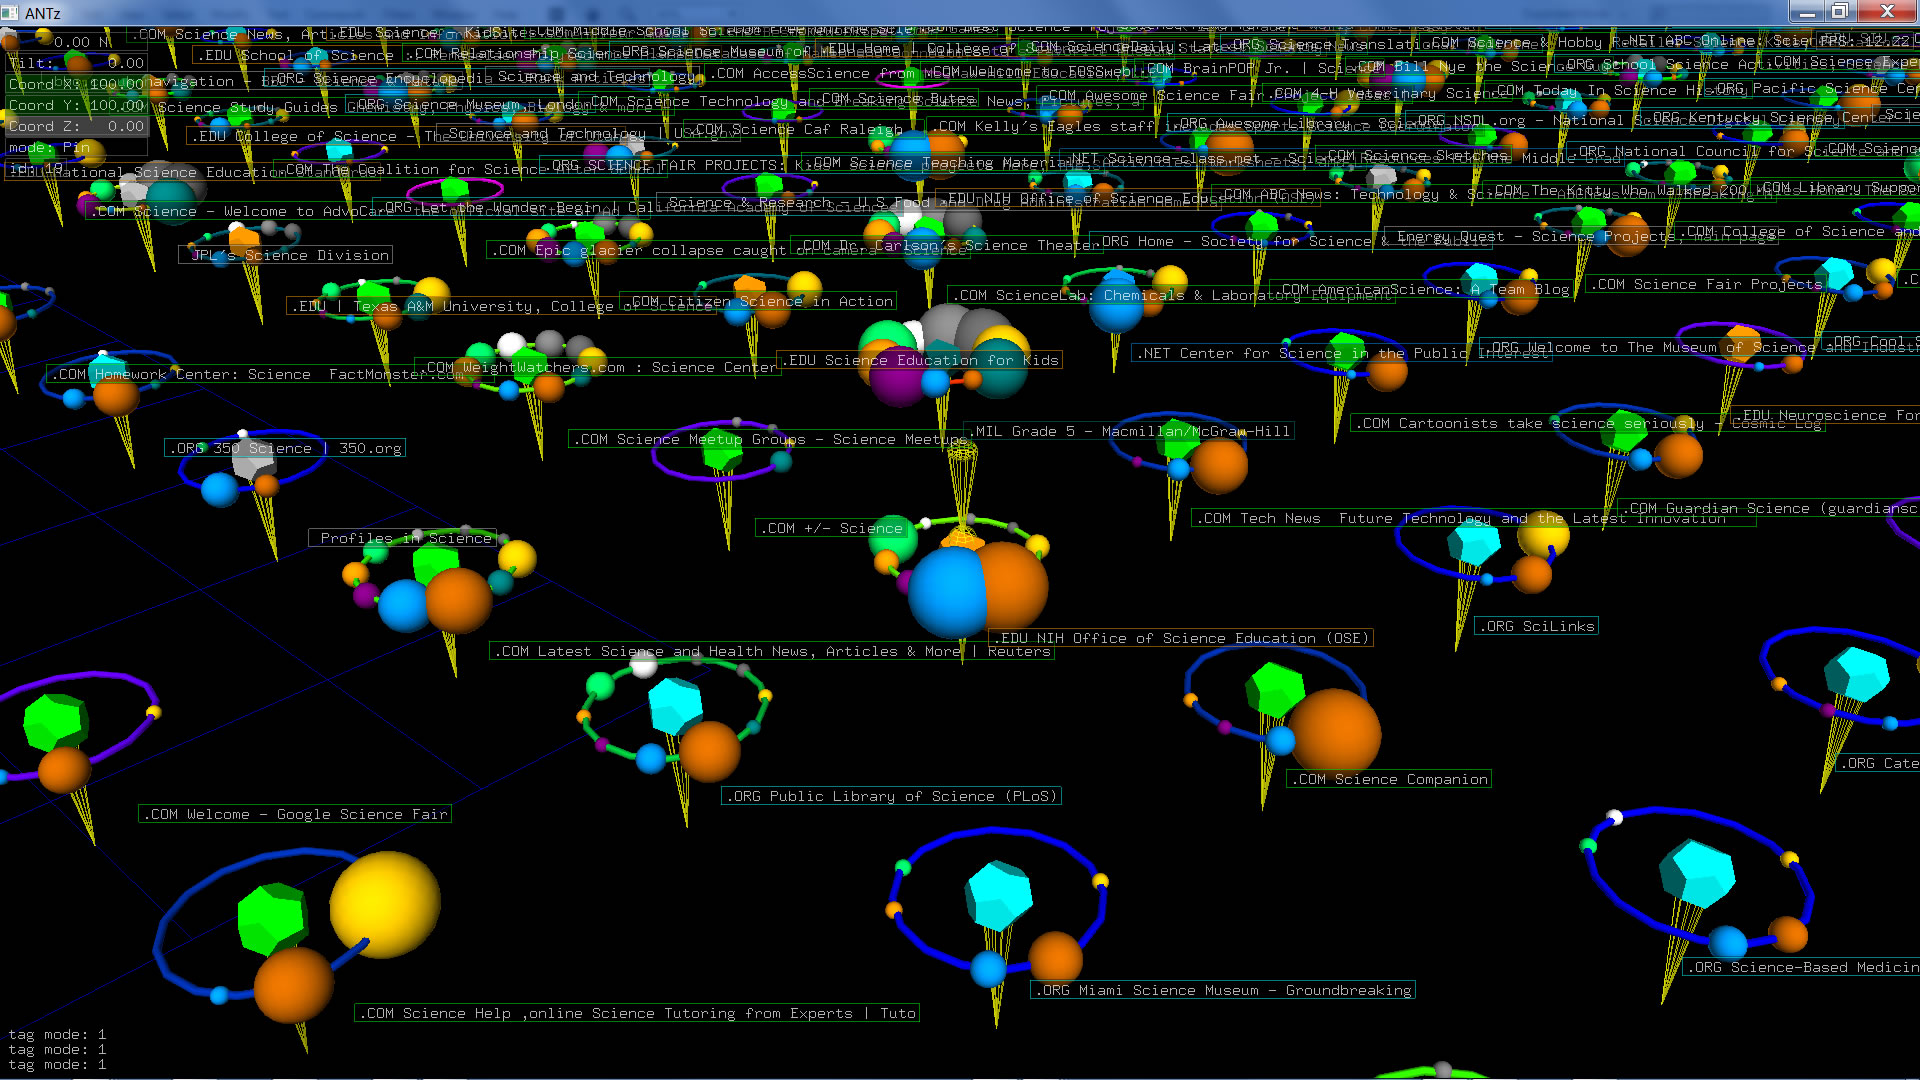
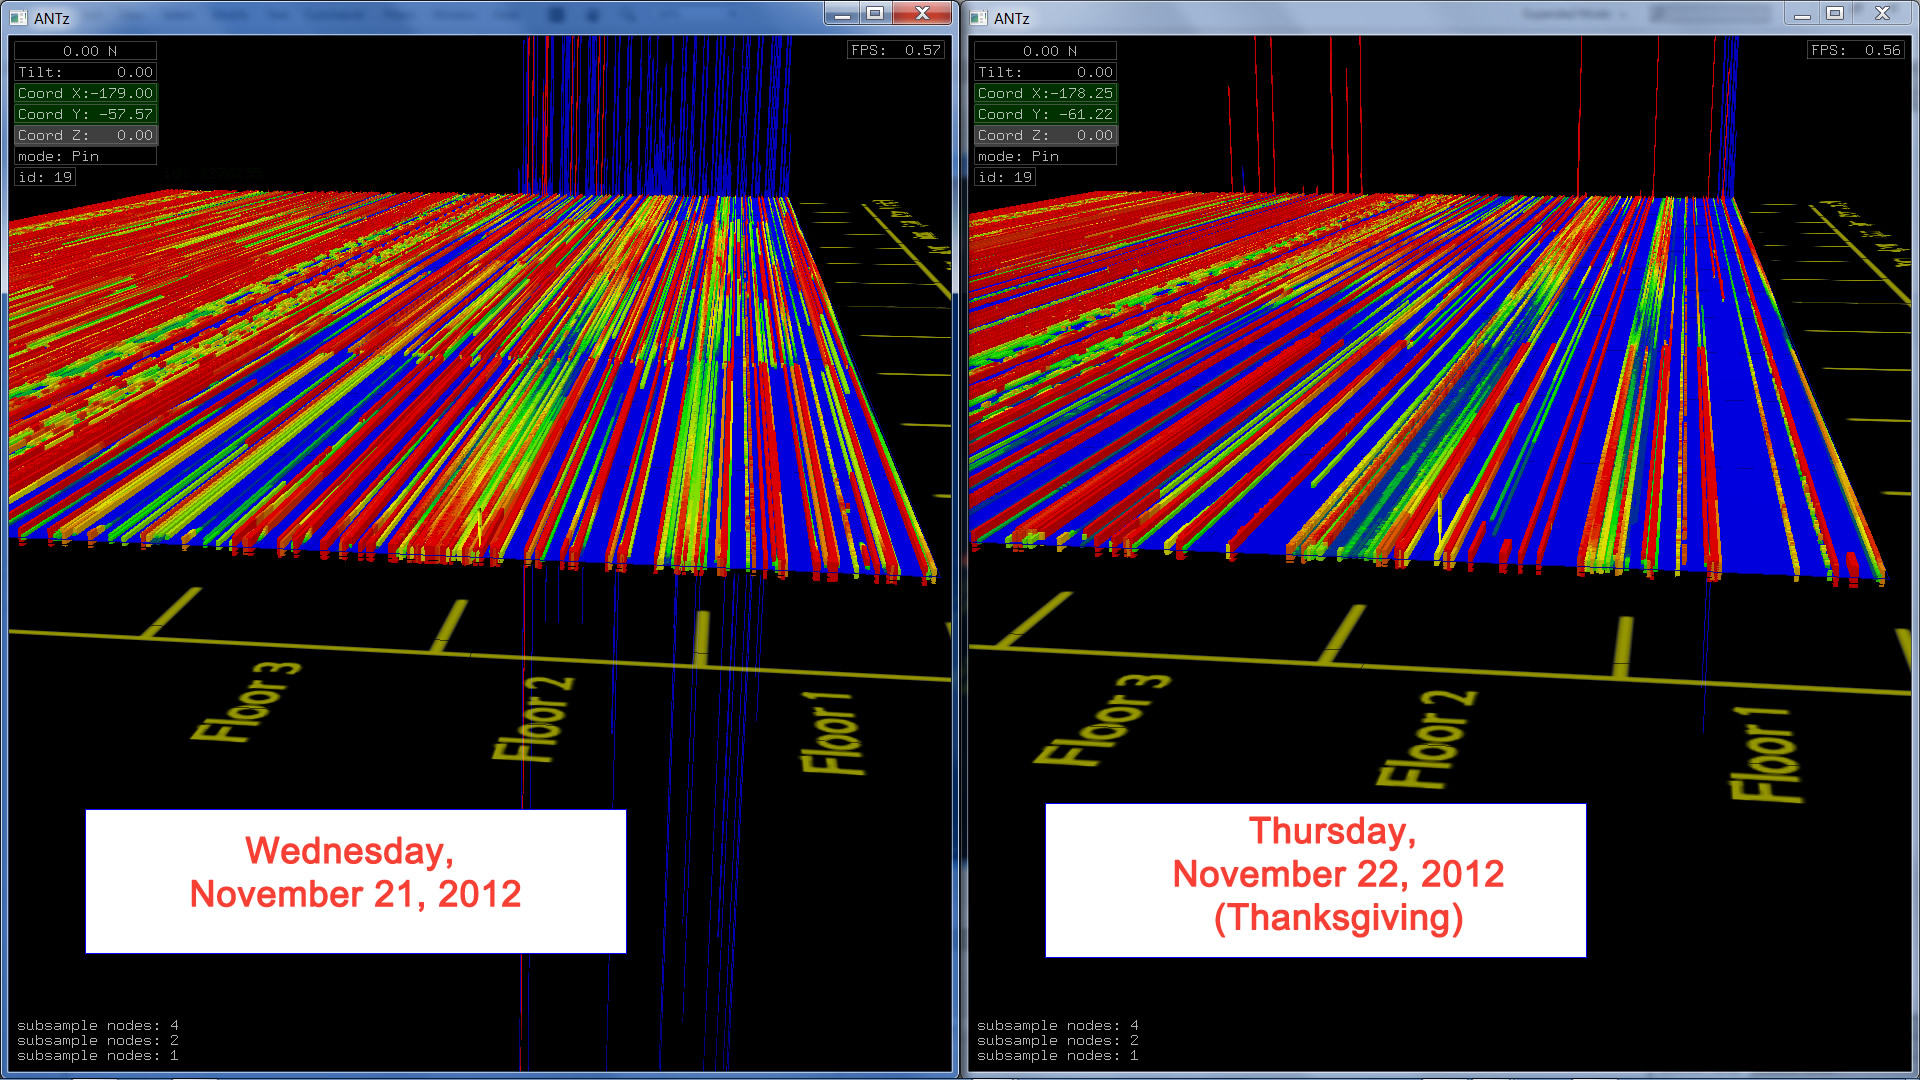
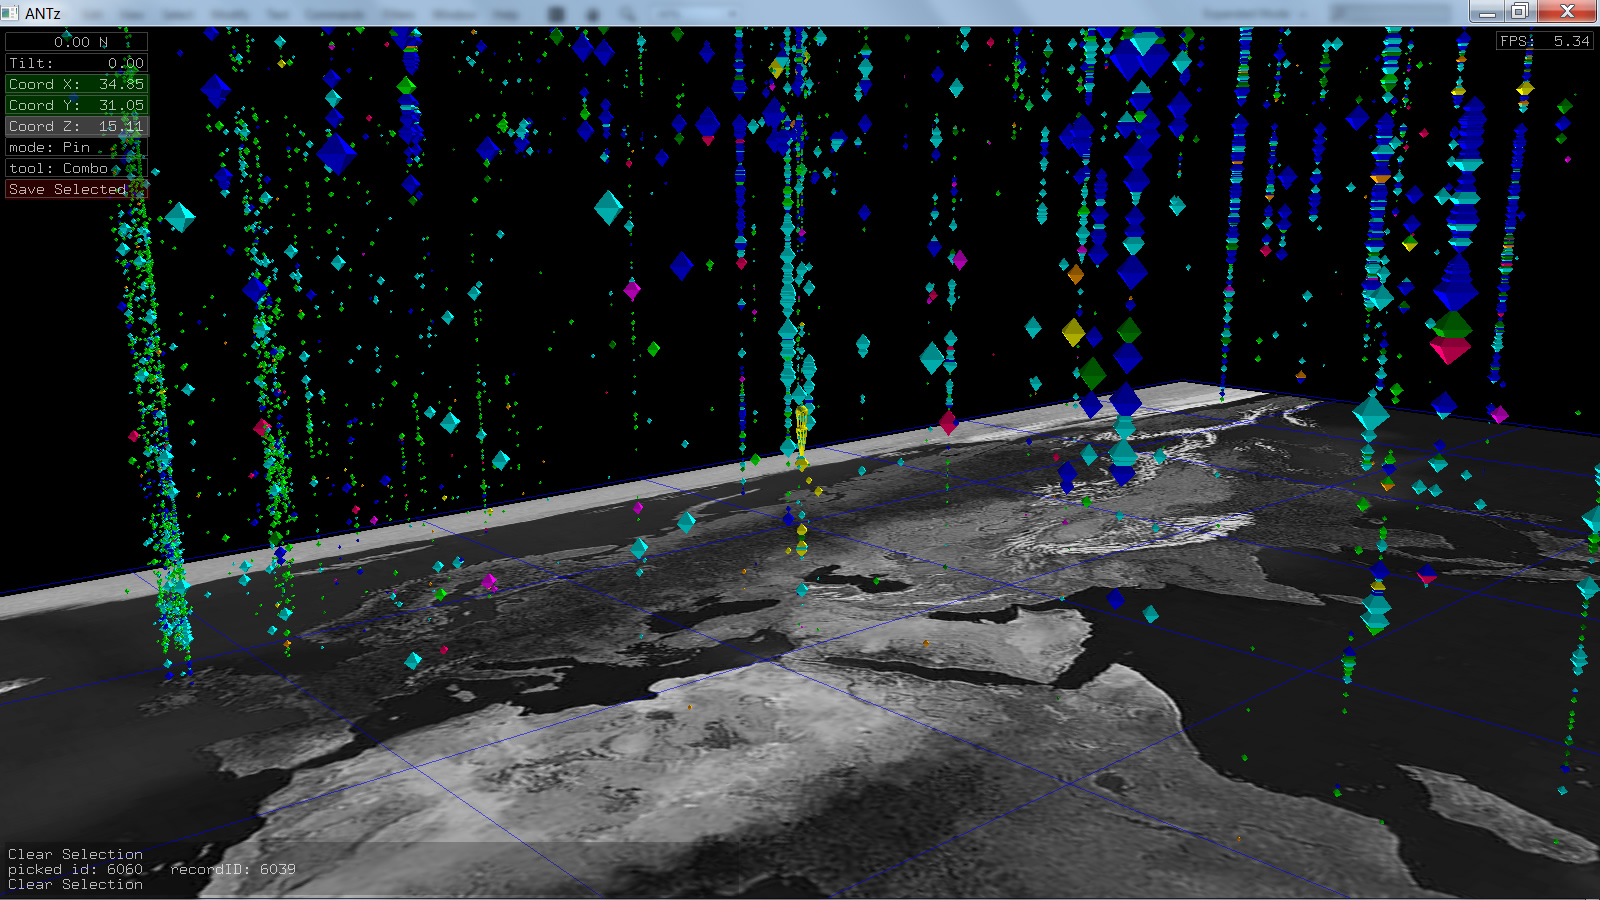
Hypothetical visualization of change over time of a complex global system, such as bi-monthly global public health figures over the course of several years. |
|
|
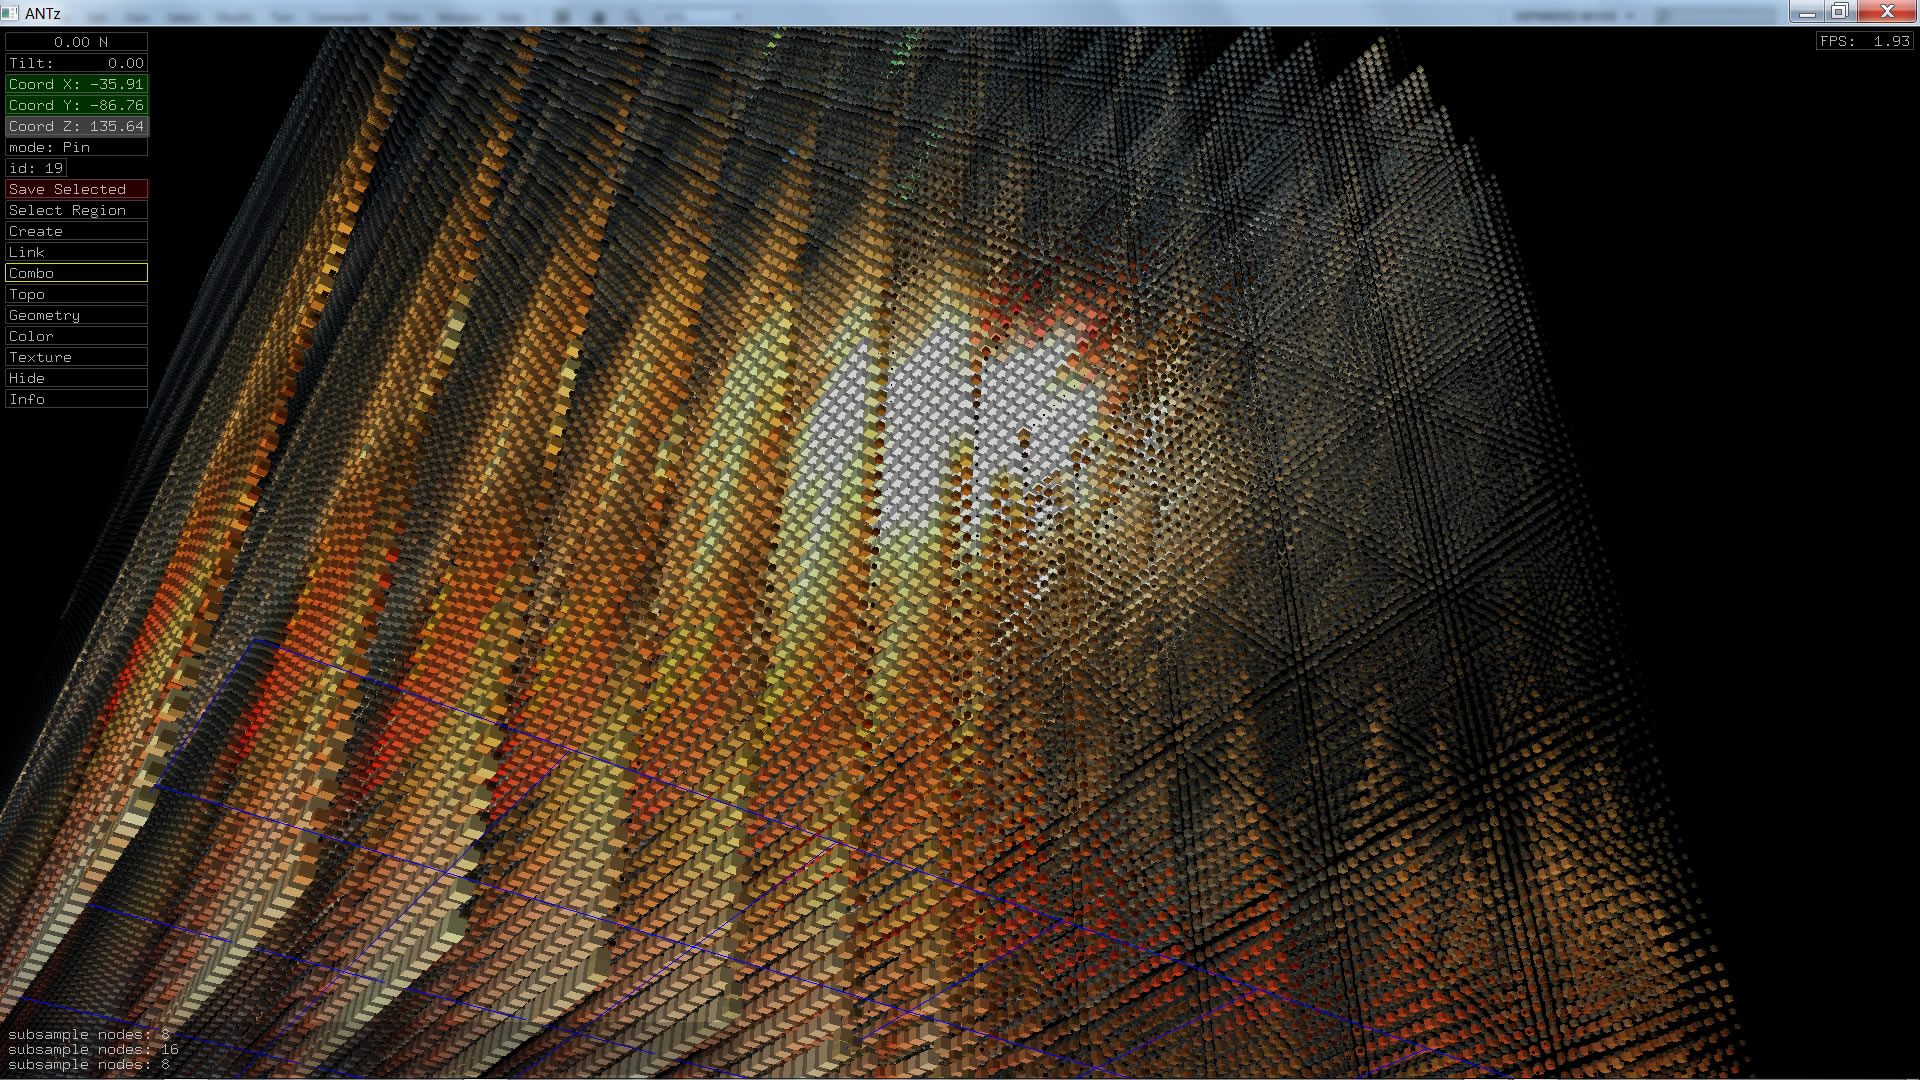
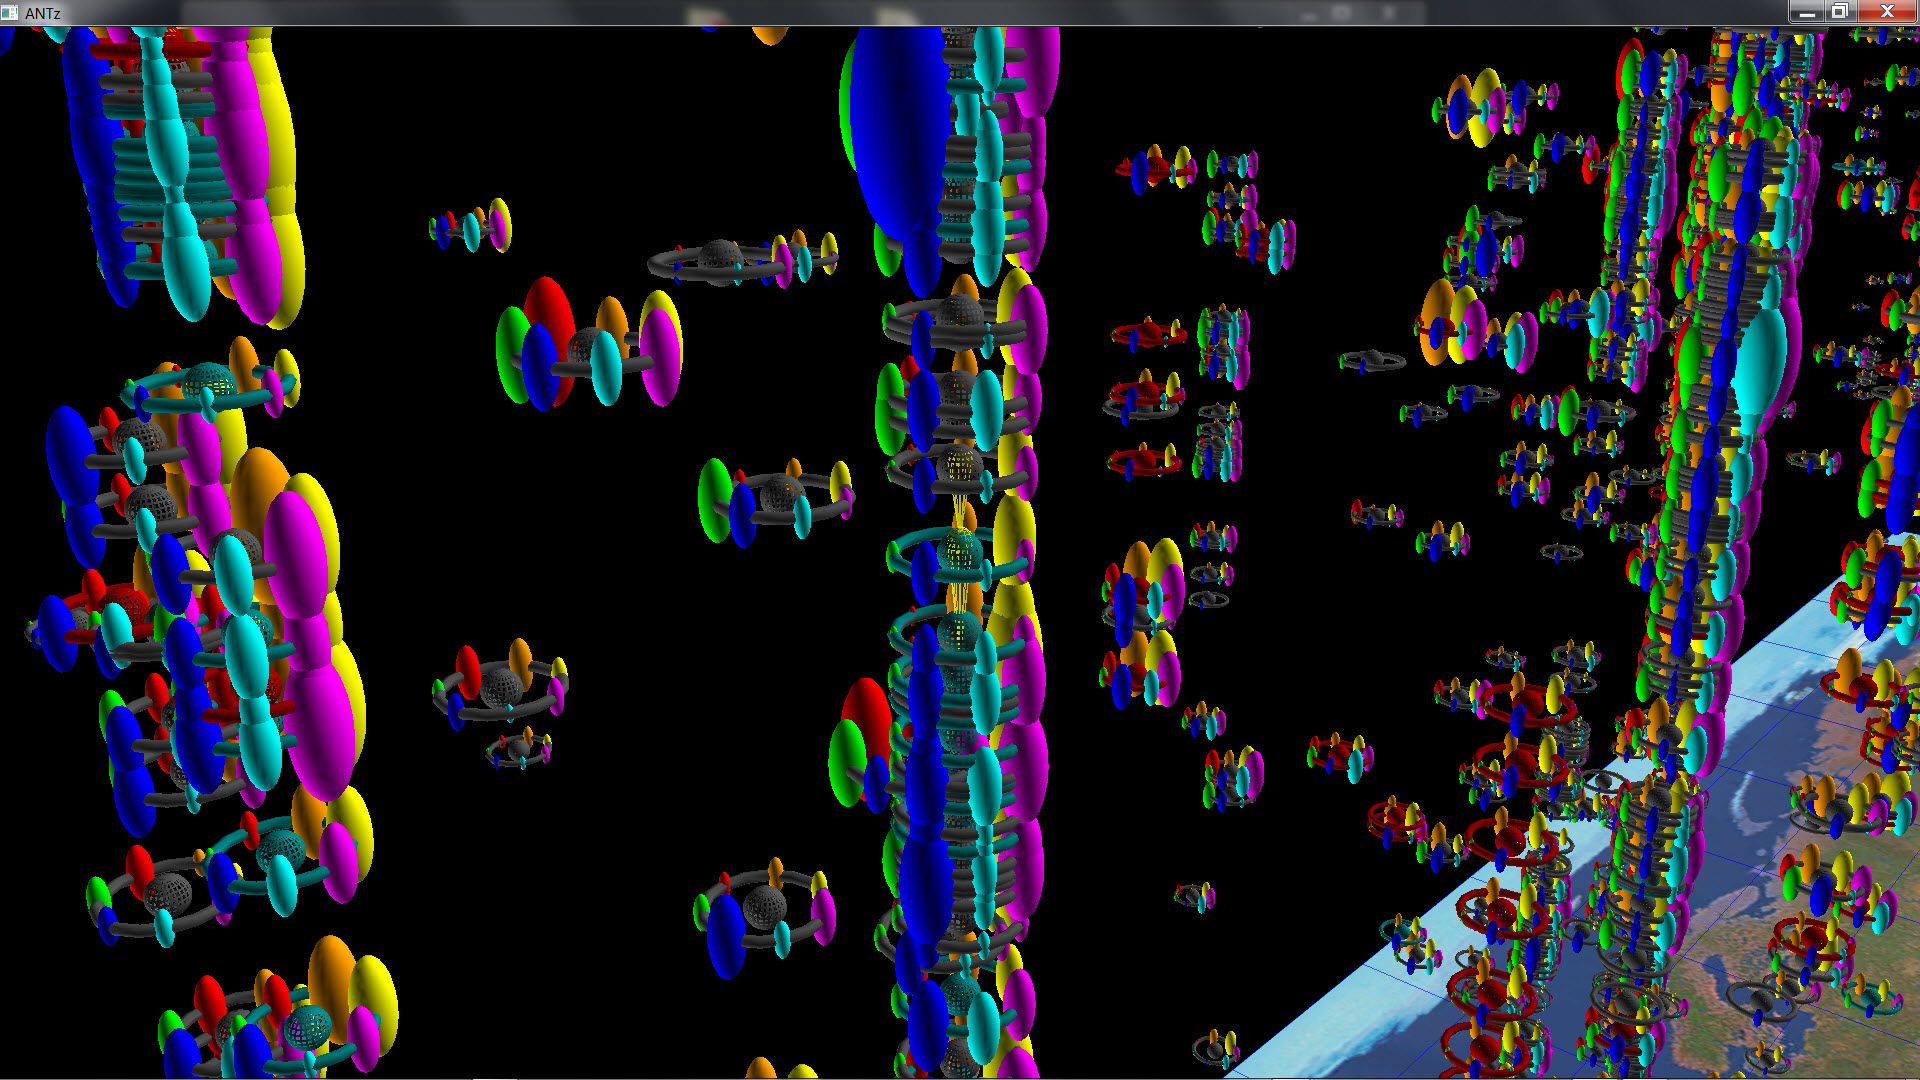
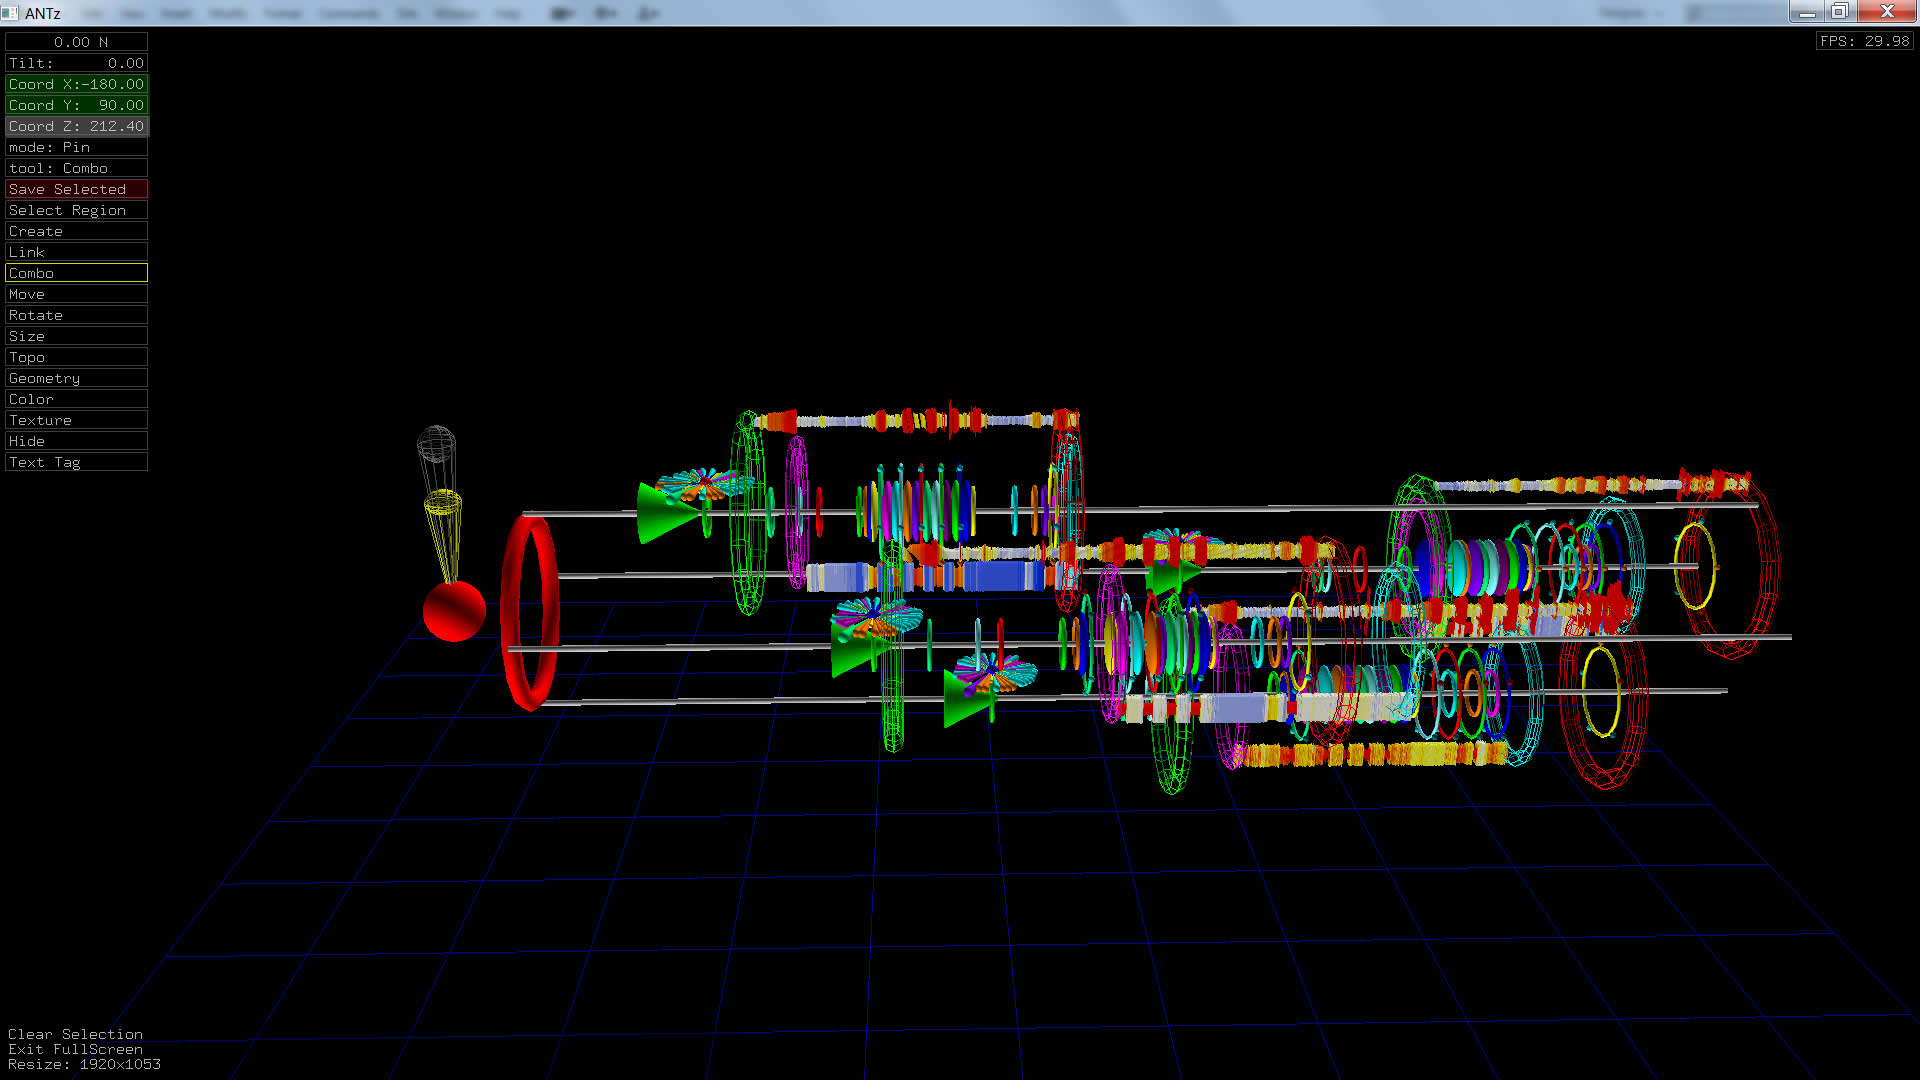
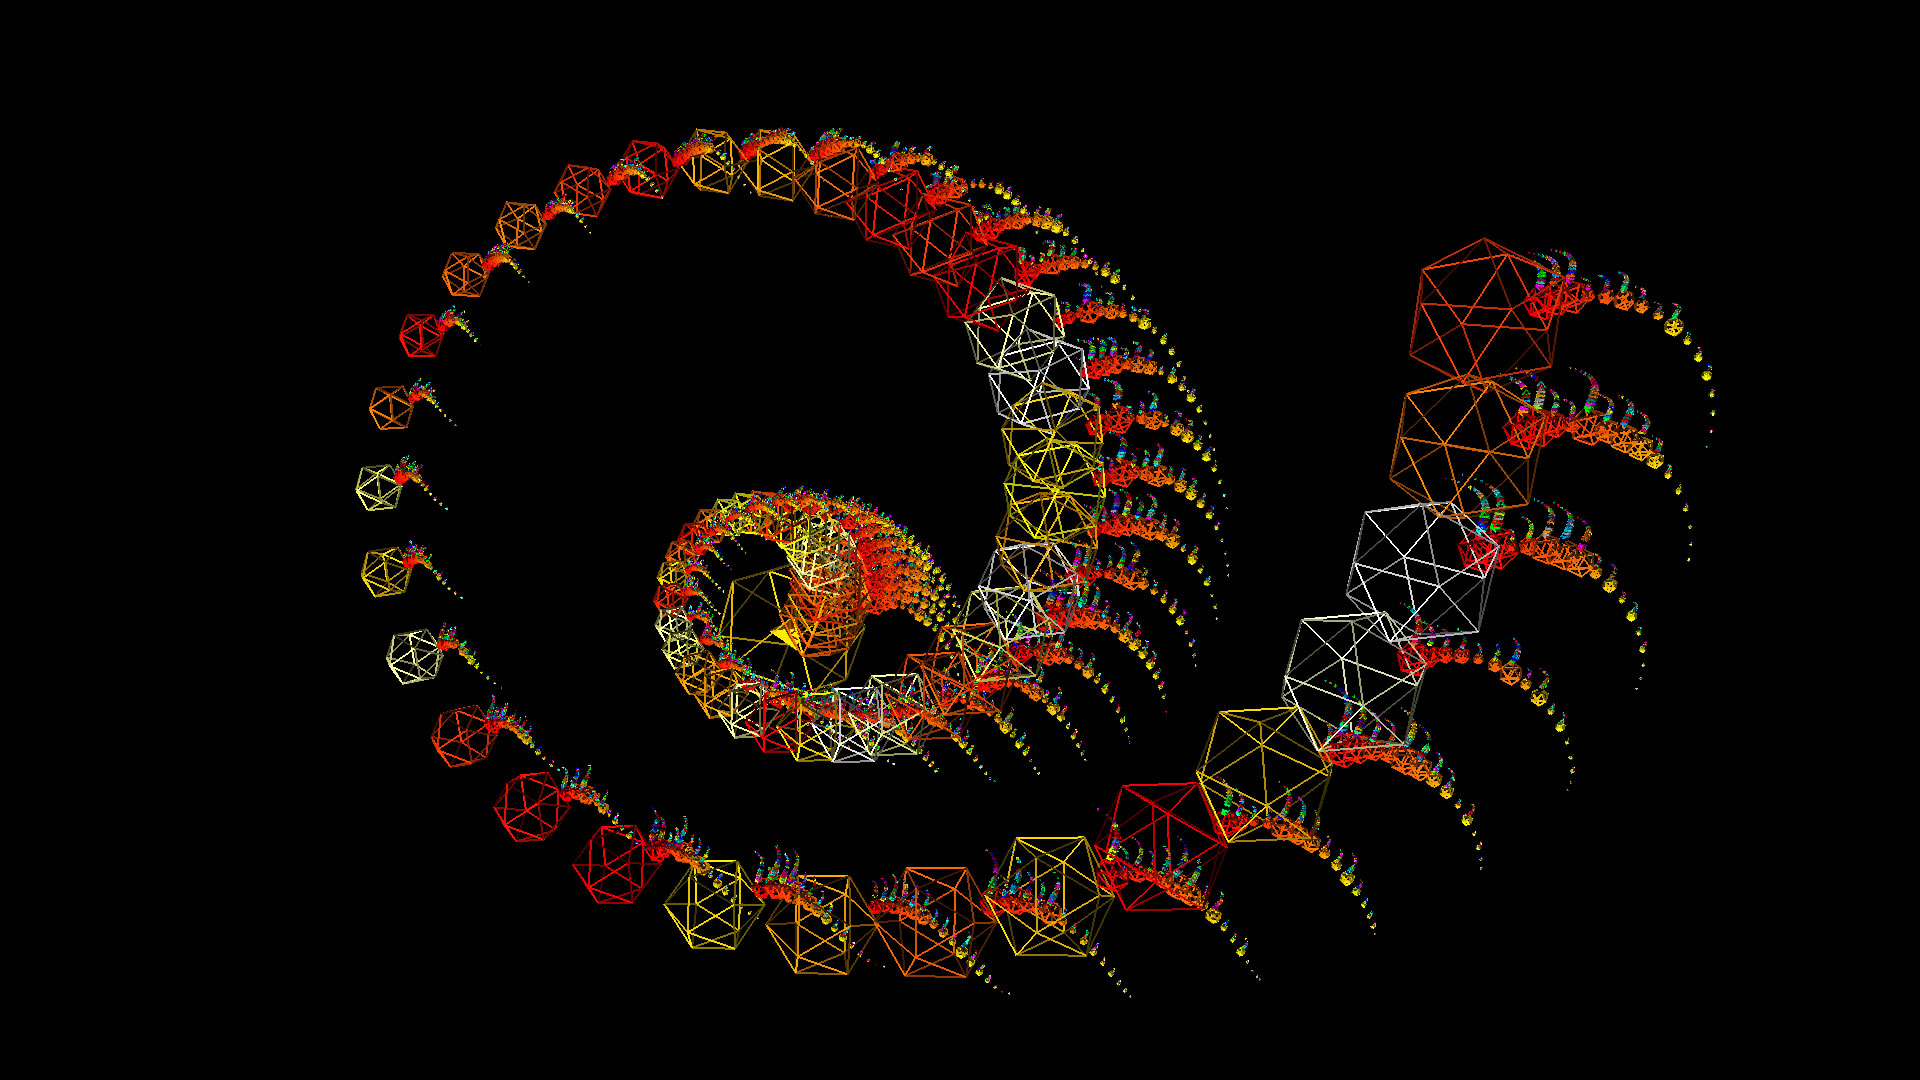
Exploring the pure geometry of antz and its built-in fractal nature. |
|
|
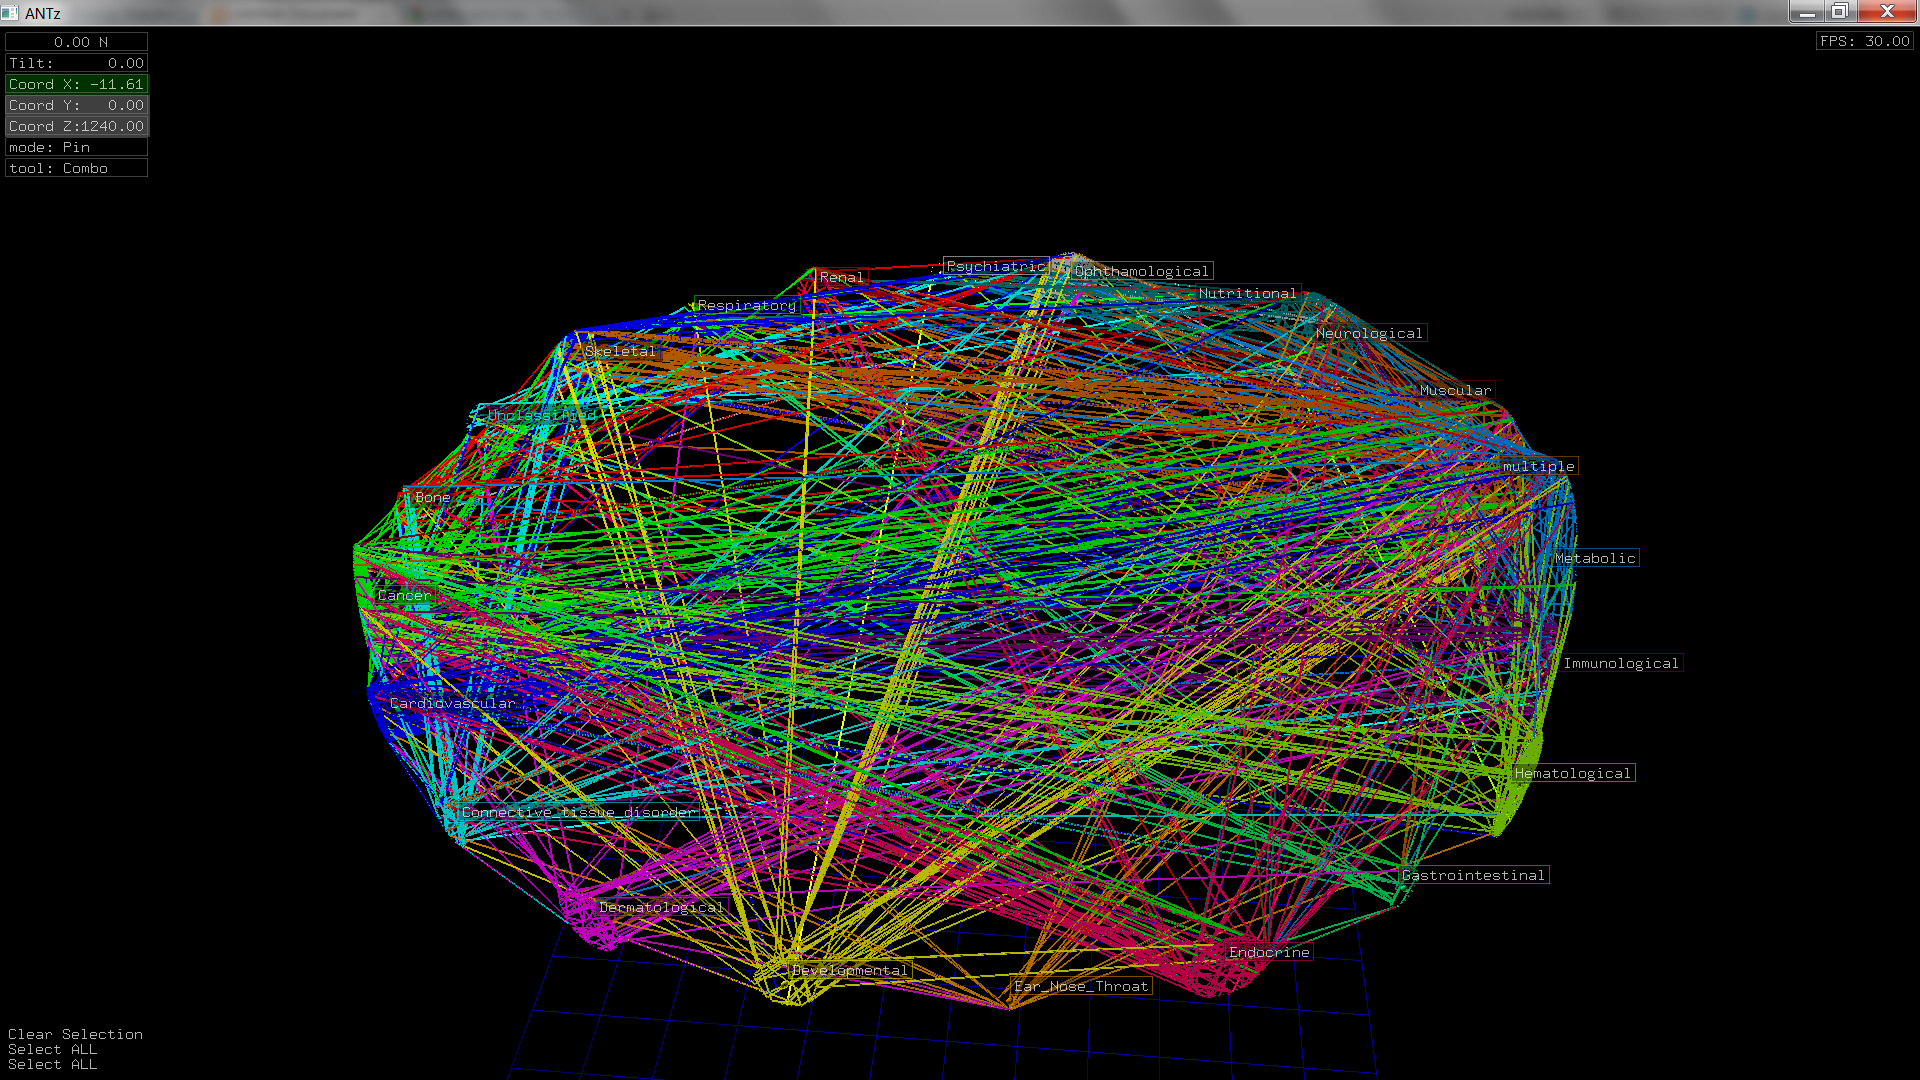
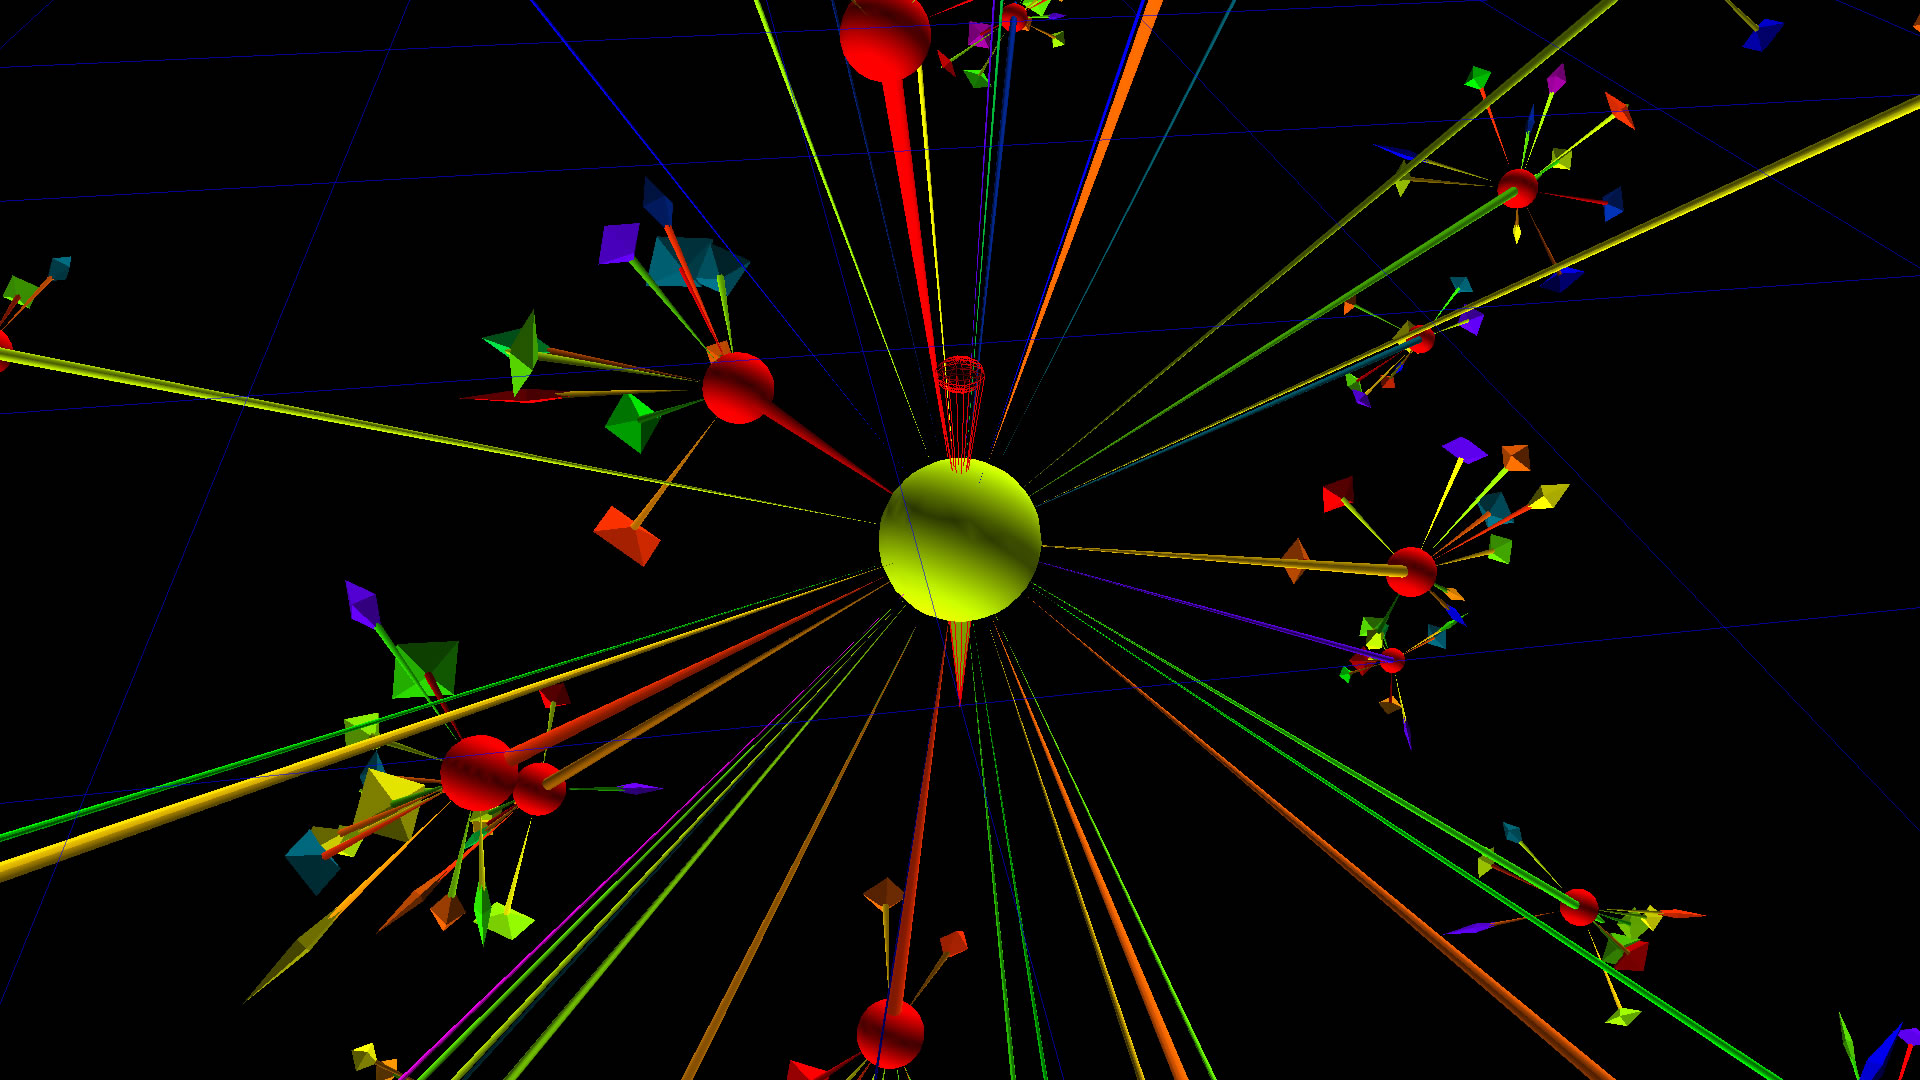
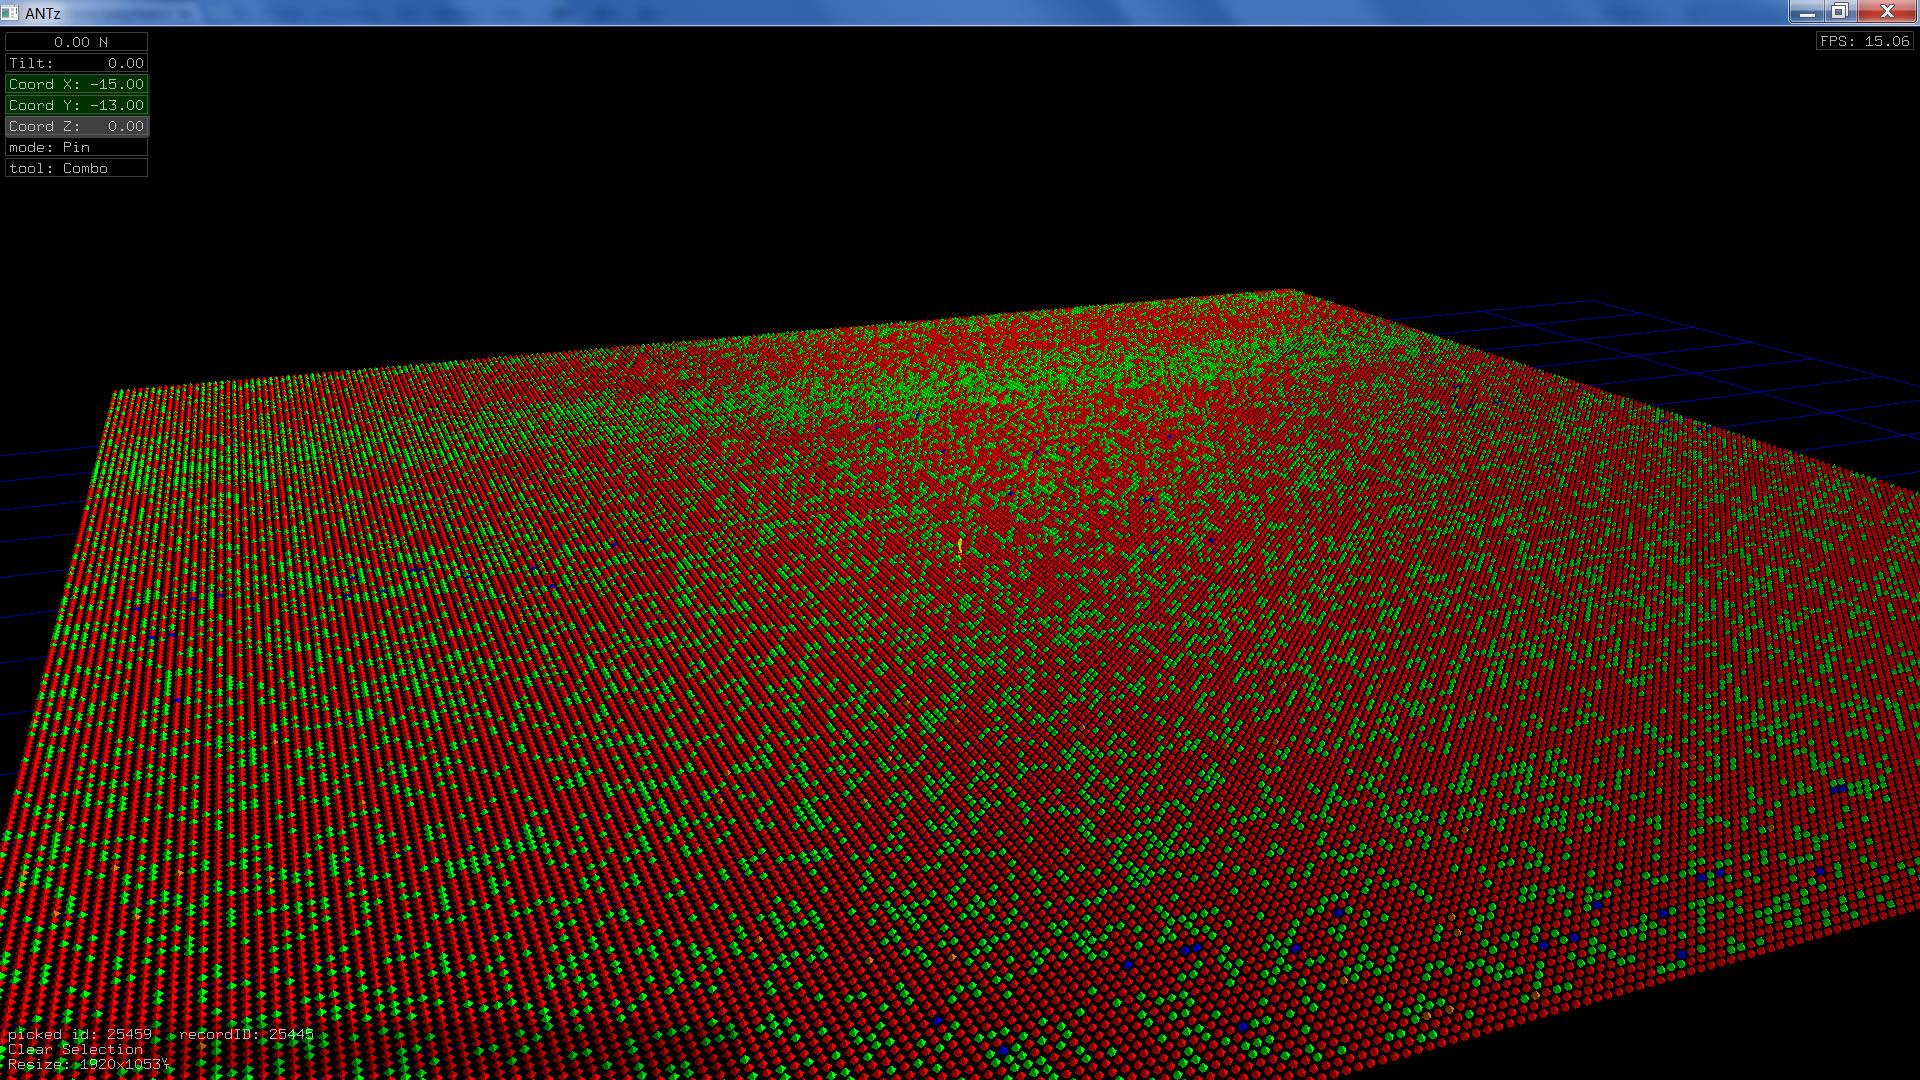
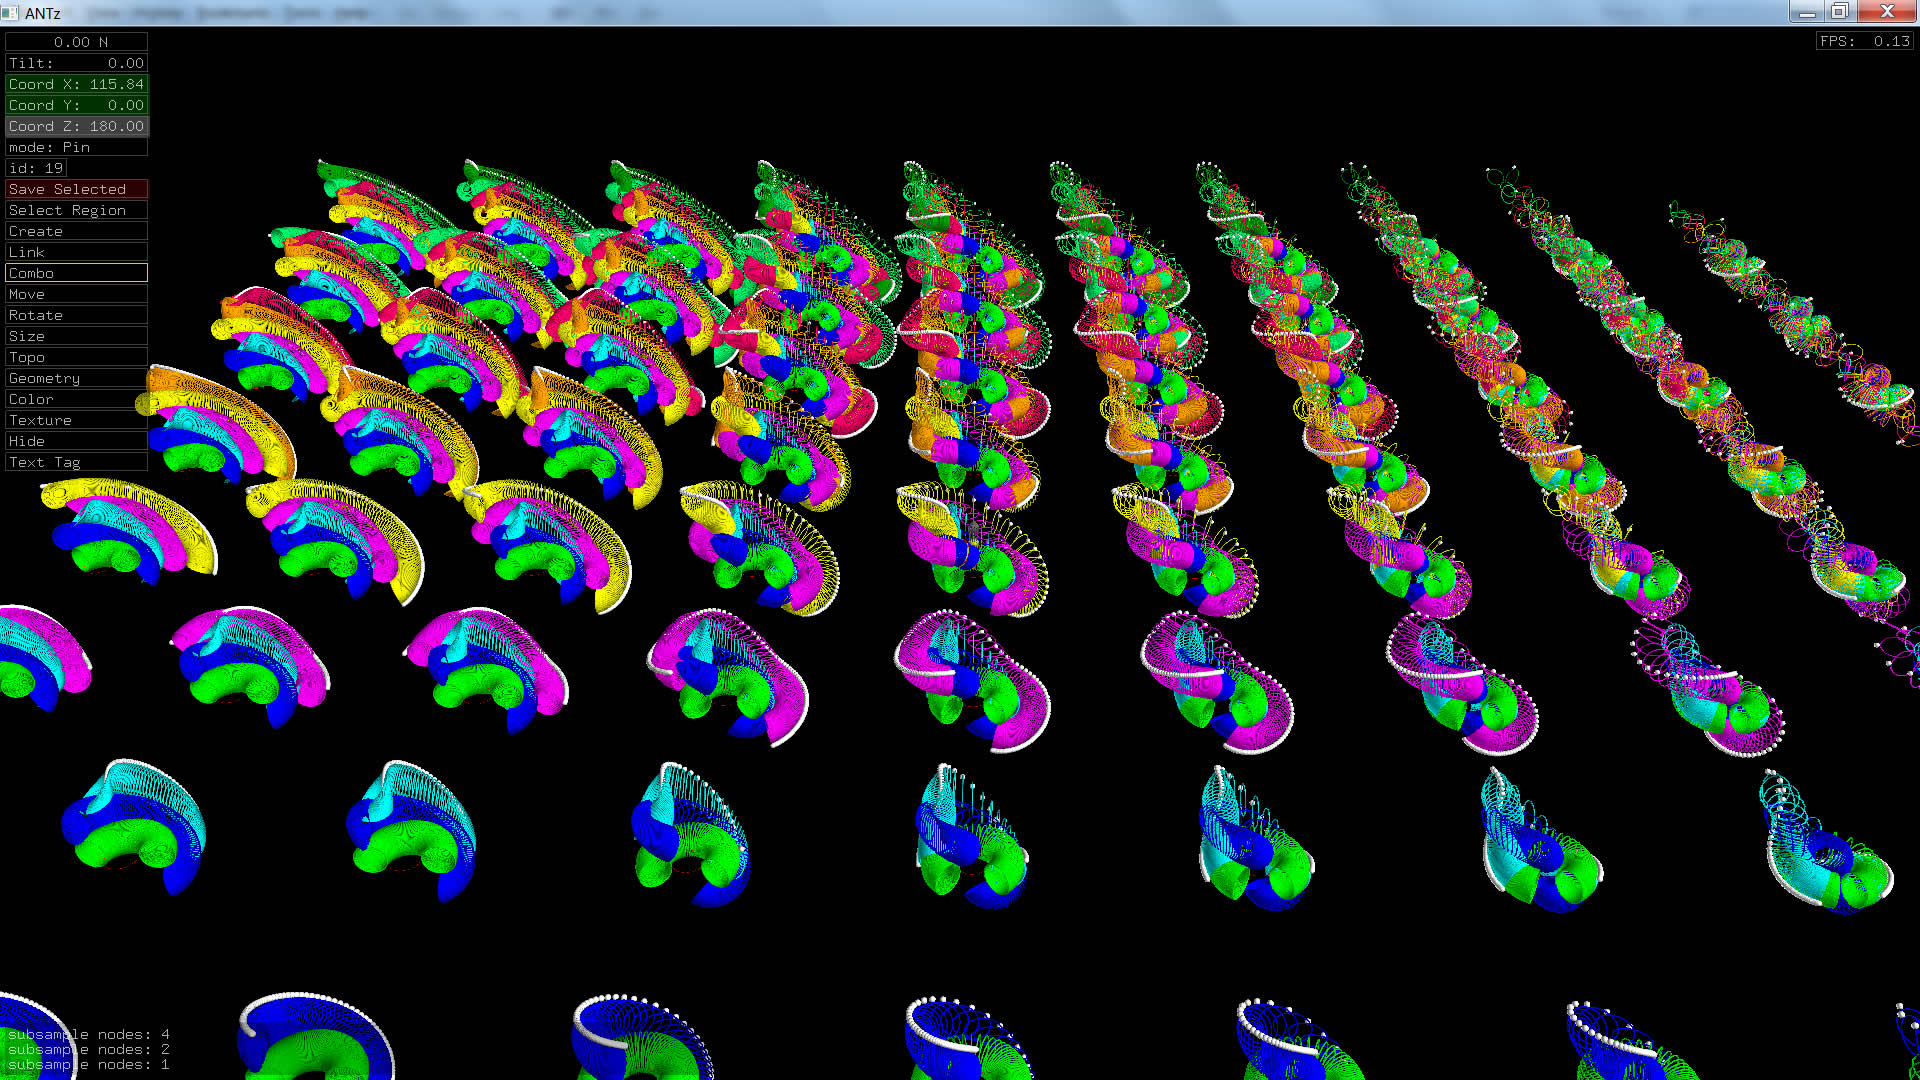
ANTz can be used to visualize multidimensional systems in a novel hyperphase space. |
|
|
Explore the DoD CERP Project in ANTz.
|
|
|
The DoD CERP by project costs.
|
|
|
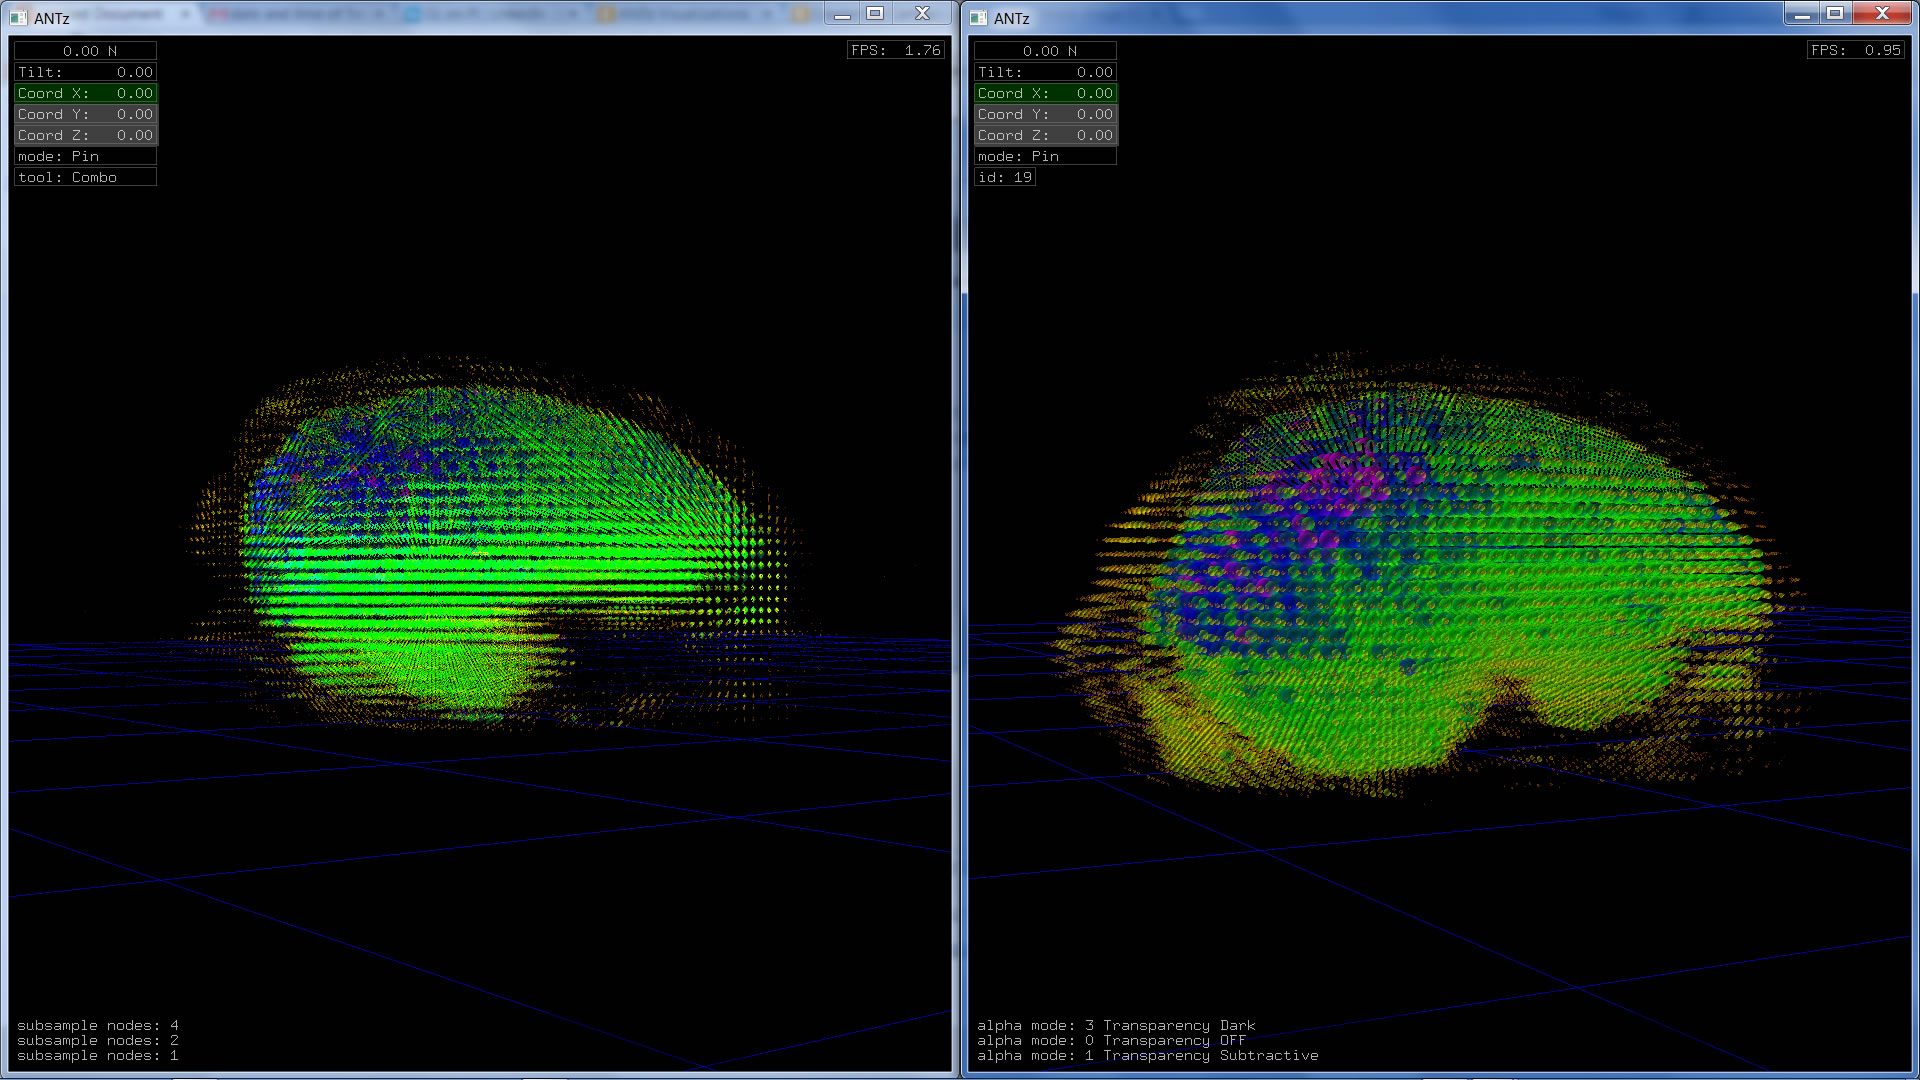
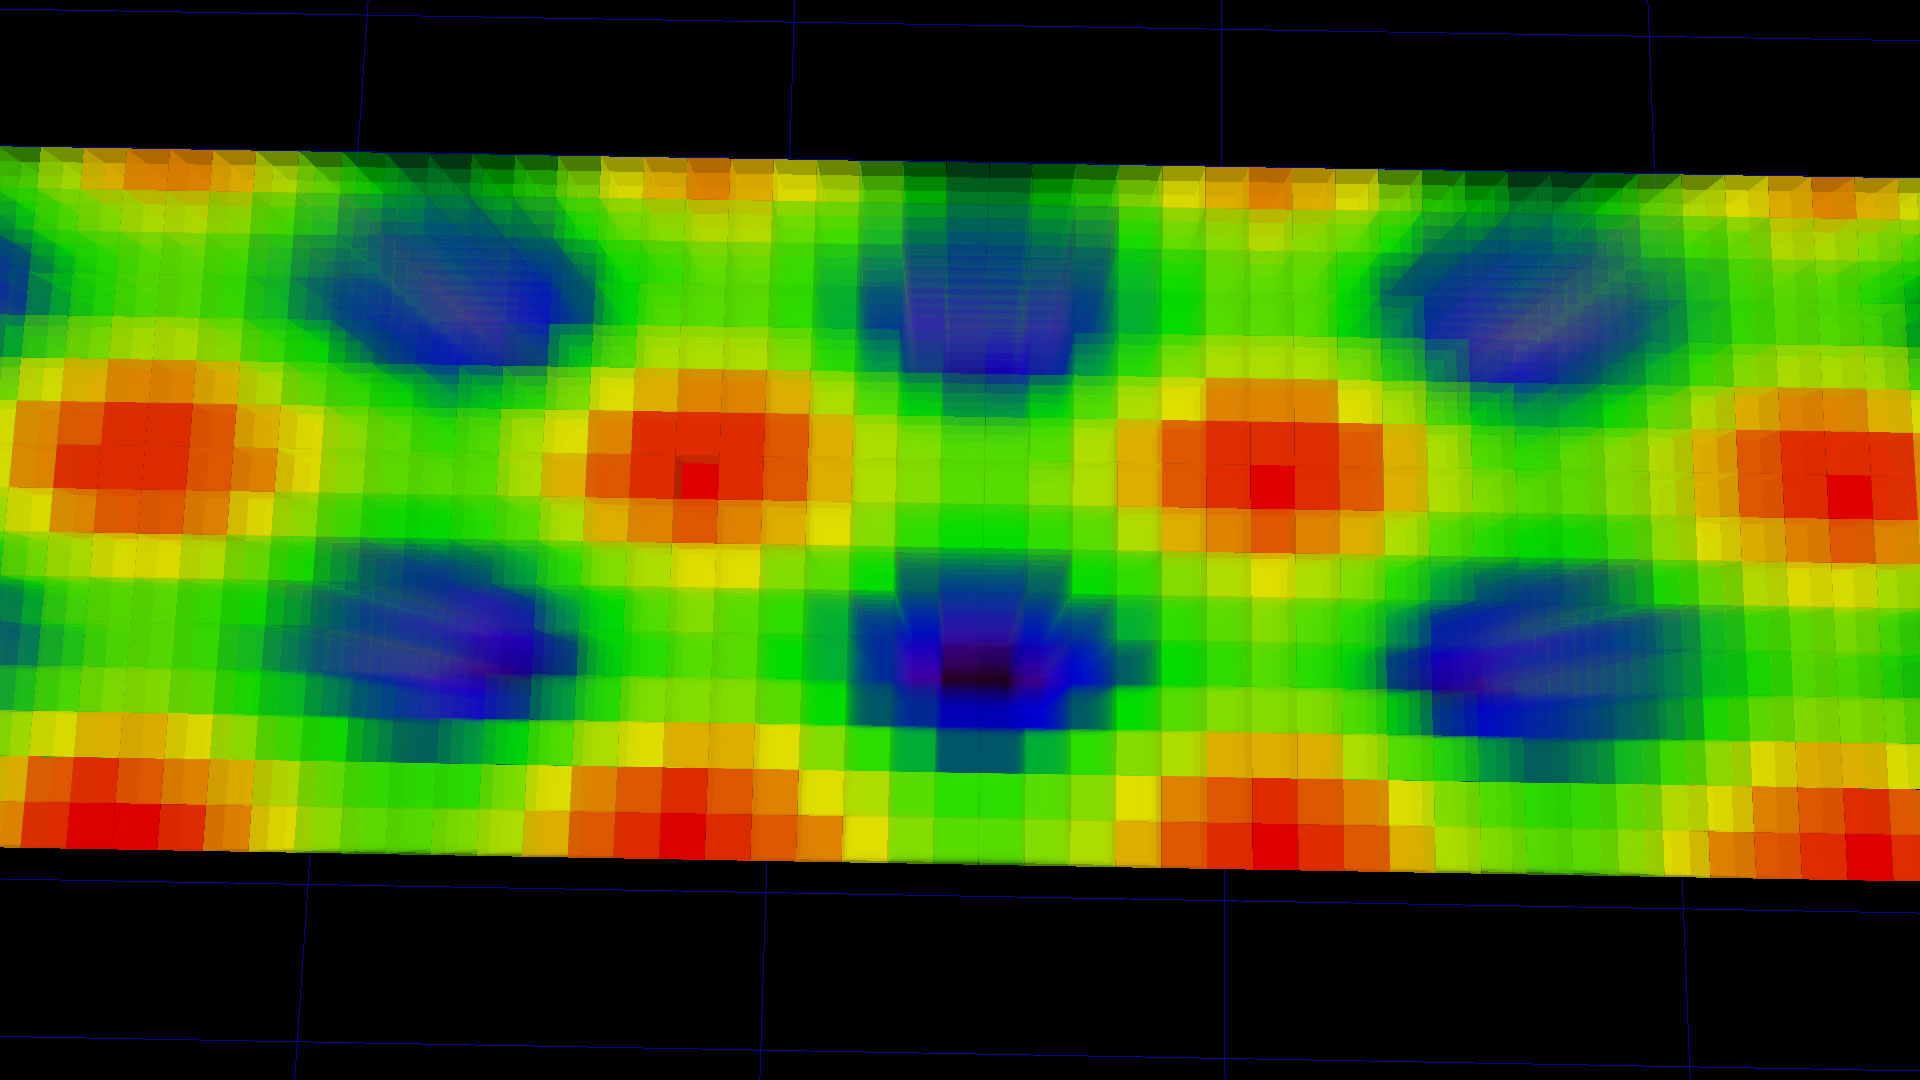
Exploring the transparency feature of antz in the context of a more traditional approach to volume visualization. |
|
|
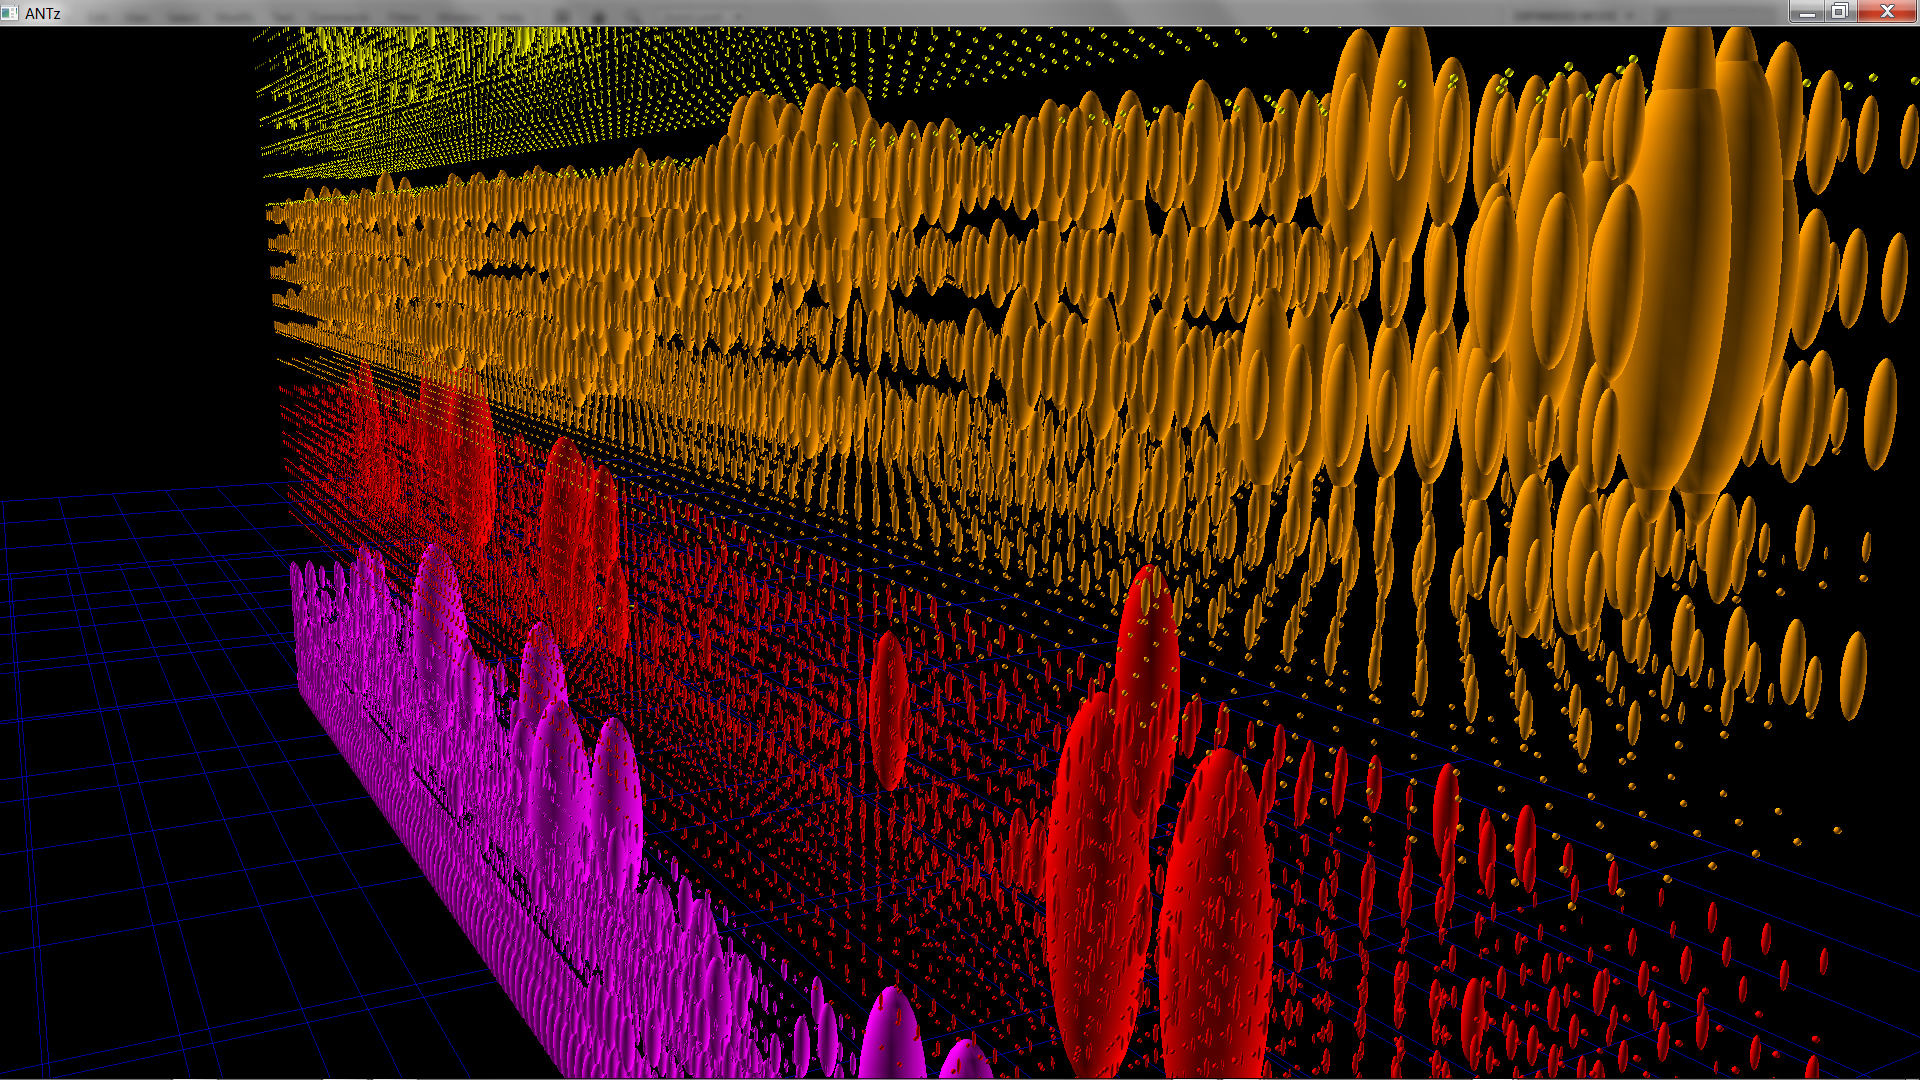
Approximately 2 minutes of EEG eyes-closed relaxed post-procesed with FFT in the delta (purple), theta (red), alpha (orange), and beta (yellow) frequency ranges. Files are provided separately. |
|
|
|
 |
|
 |
|
|
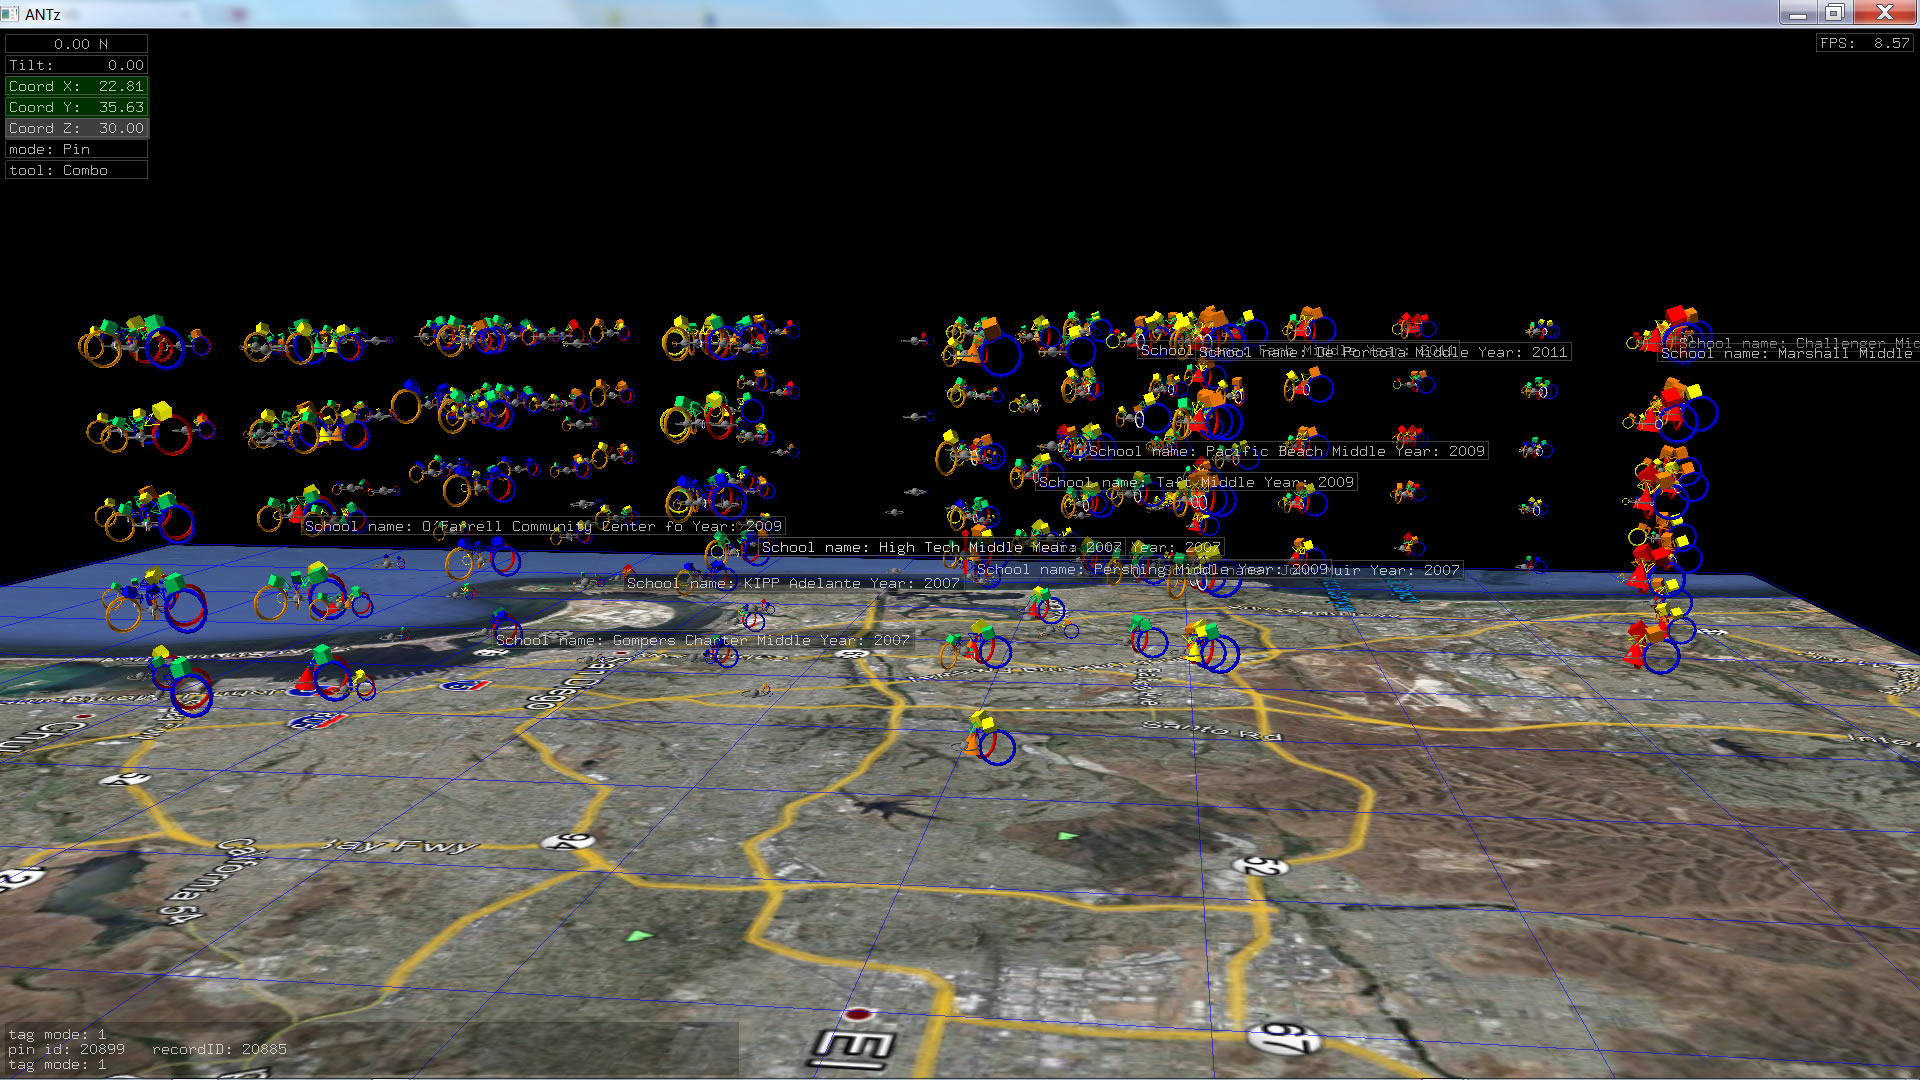
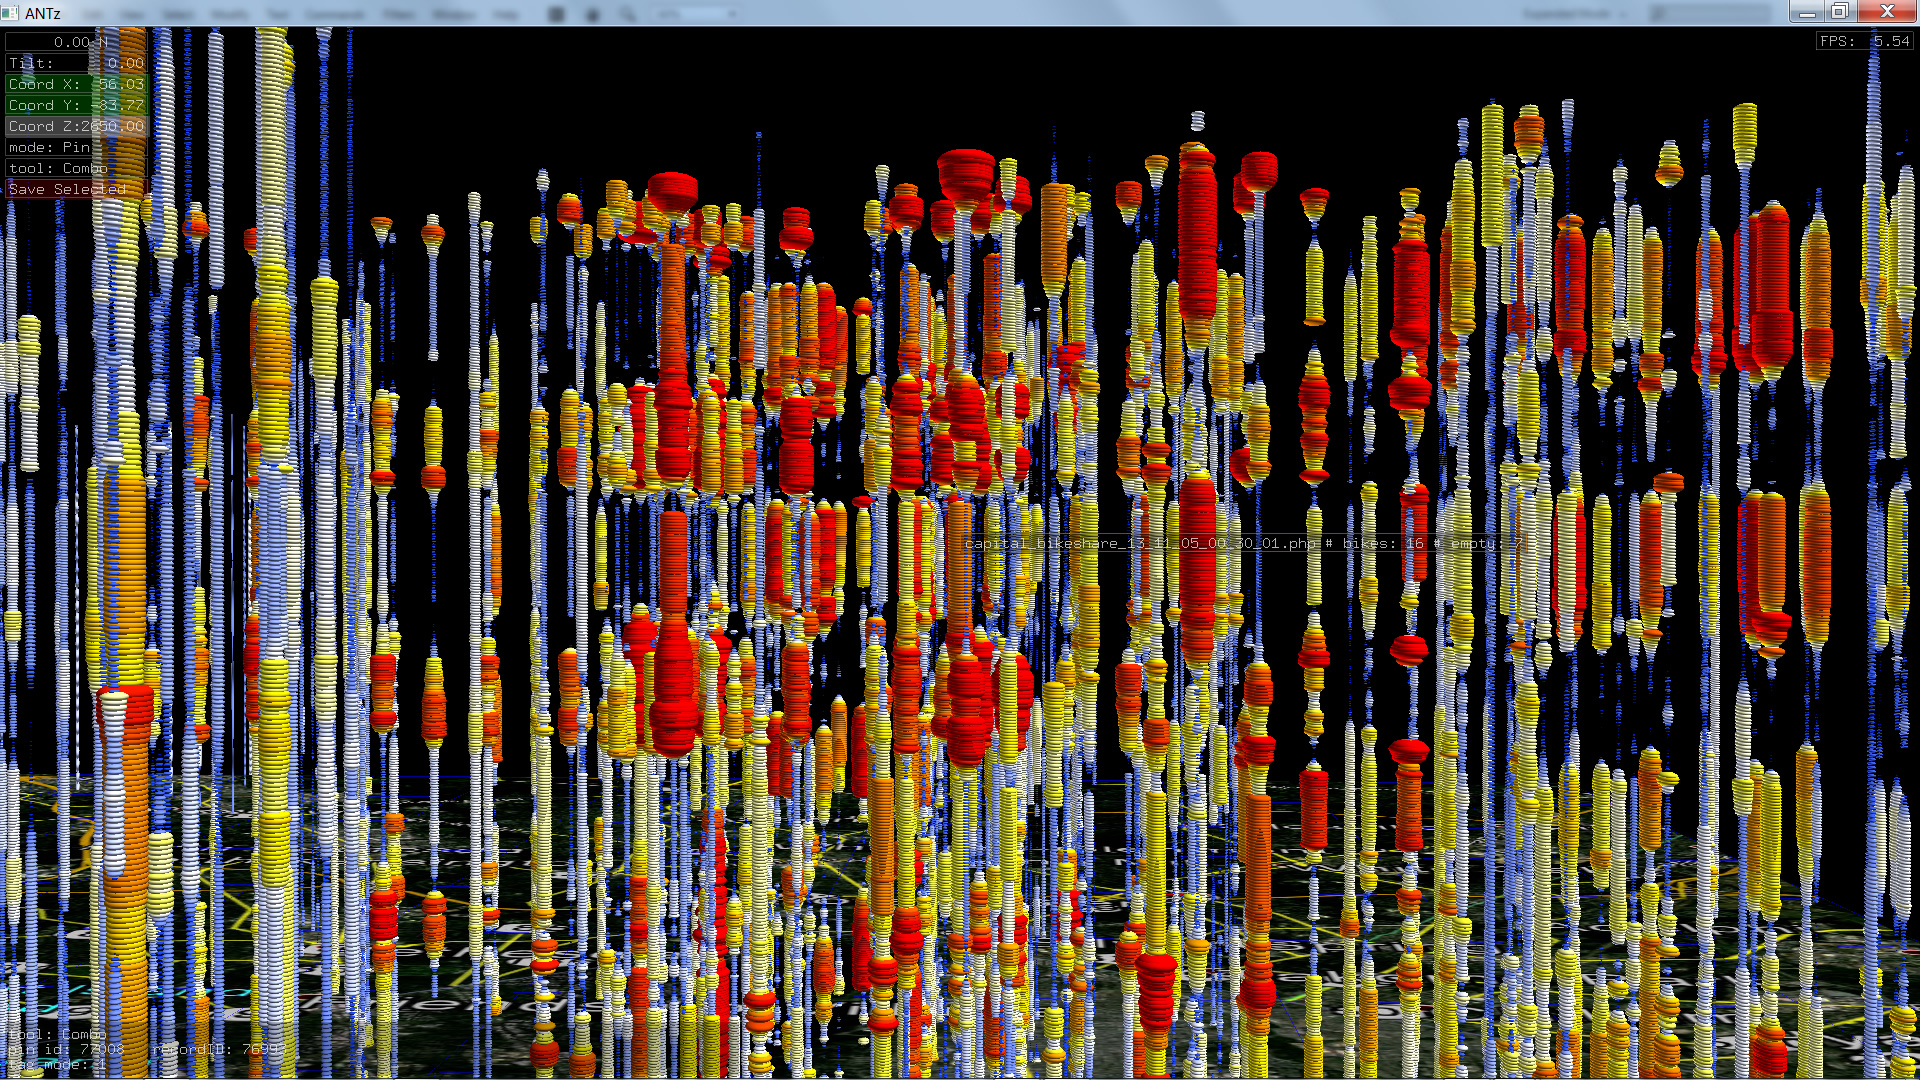
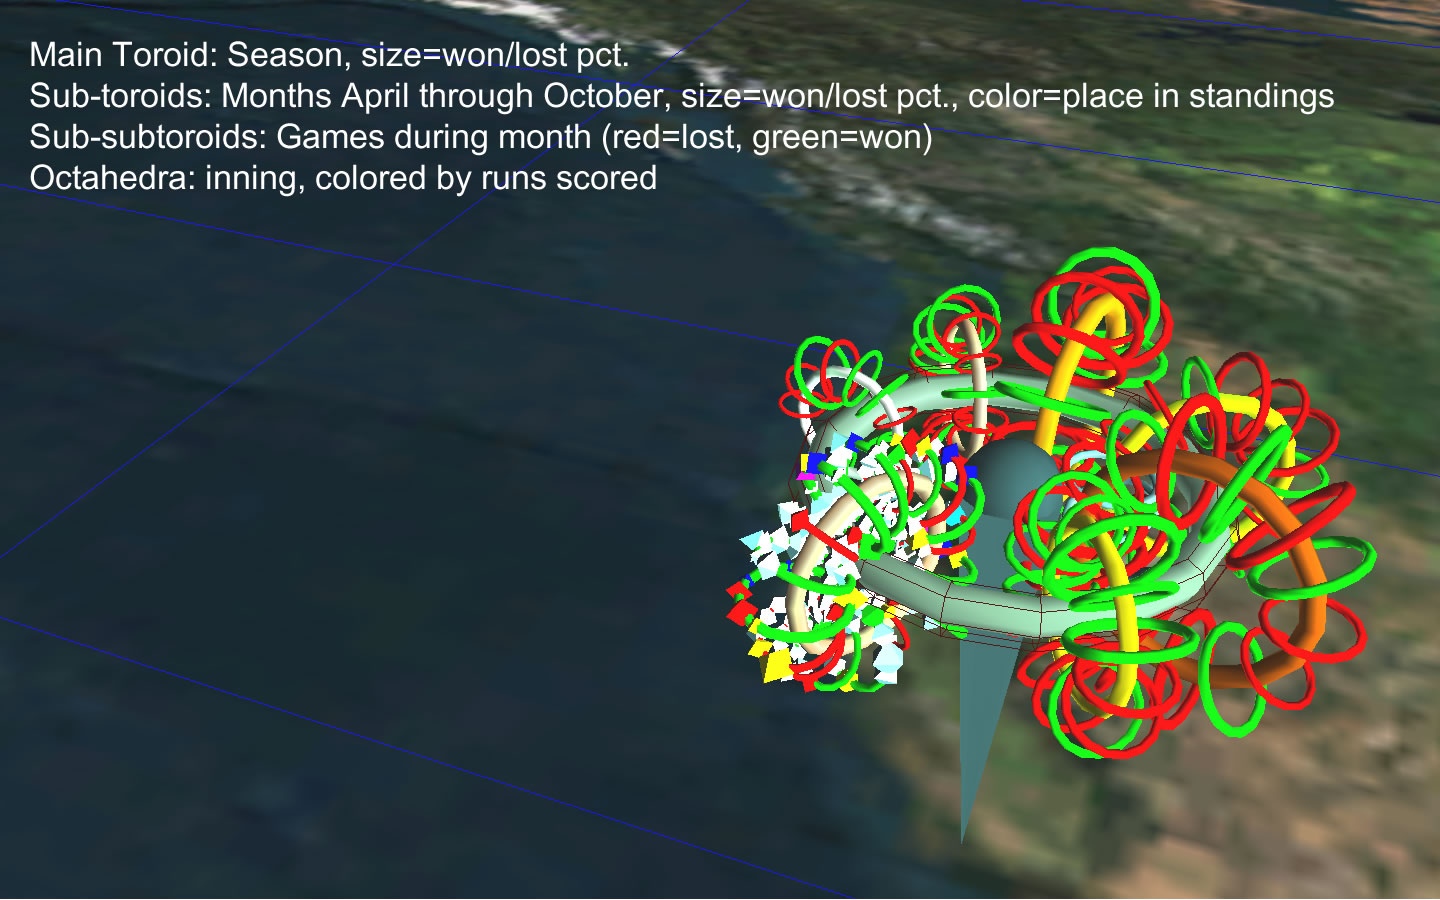
Only a single month (April) is fully represented with data, the intent being to simplify the visualization. Click the thumbnail view a larger image with description of parameters. |
|

Explore more pics on my Picasa site.
*Thanks to Dave Warner and Shane Saxon, Joh Johannsen, Joe Adams, Lucas Erickson, Mark Buchanan, Alan Barnum-Scrivener, Steve Price, Dave Gilsdorf, and Jodi Reed.