ANTz Visualizations
Advanced Visualization of Syria Conflict, April 2011 to present
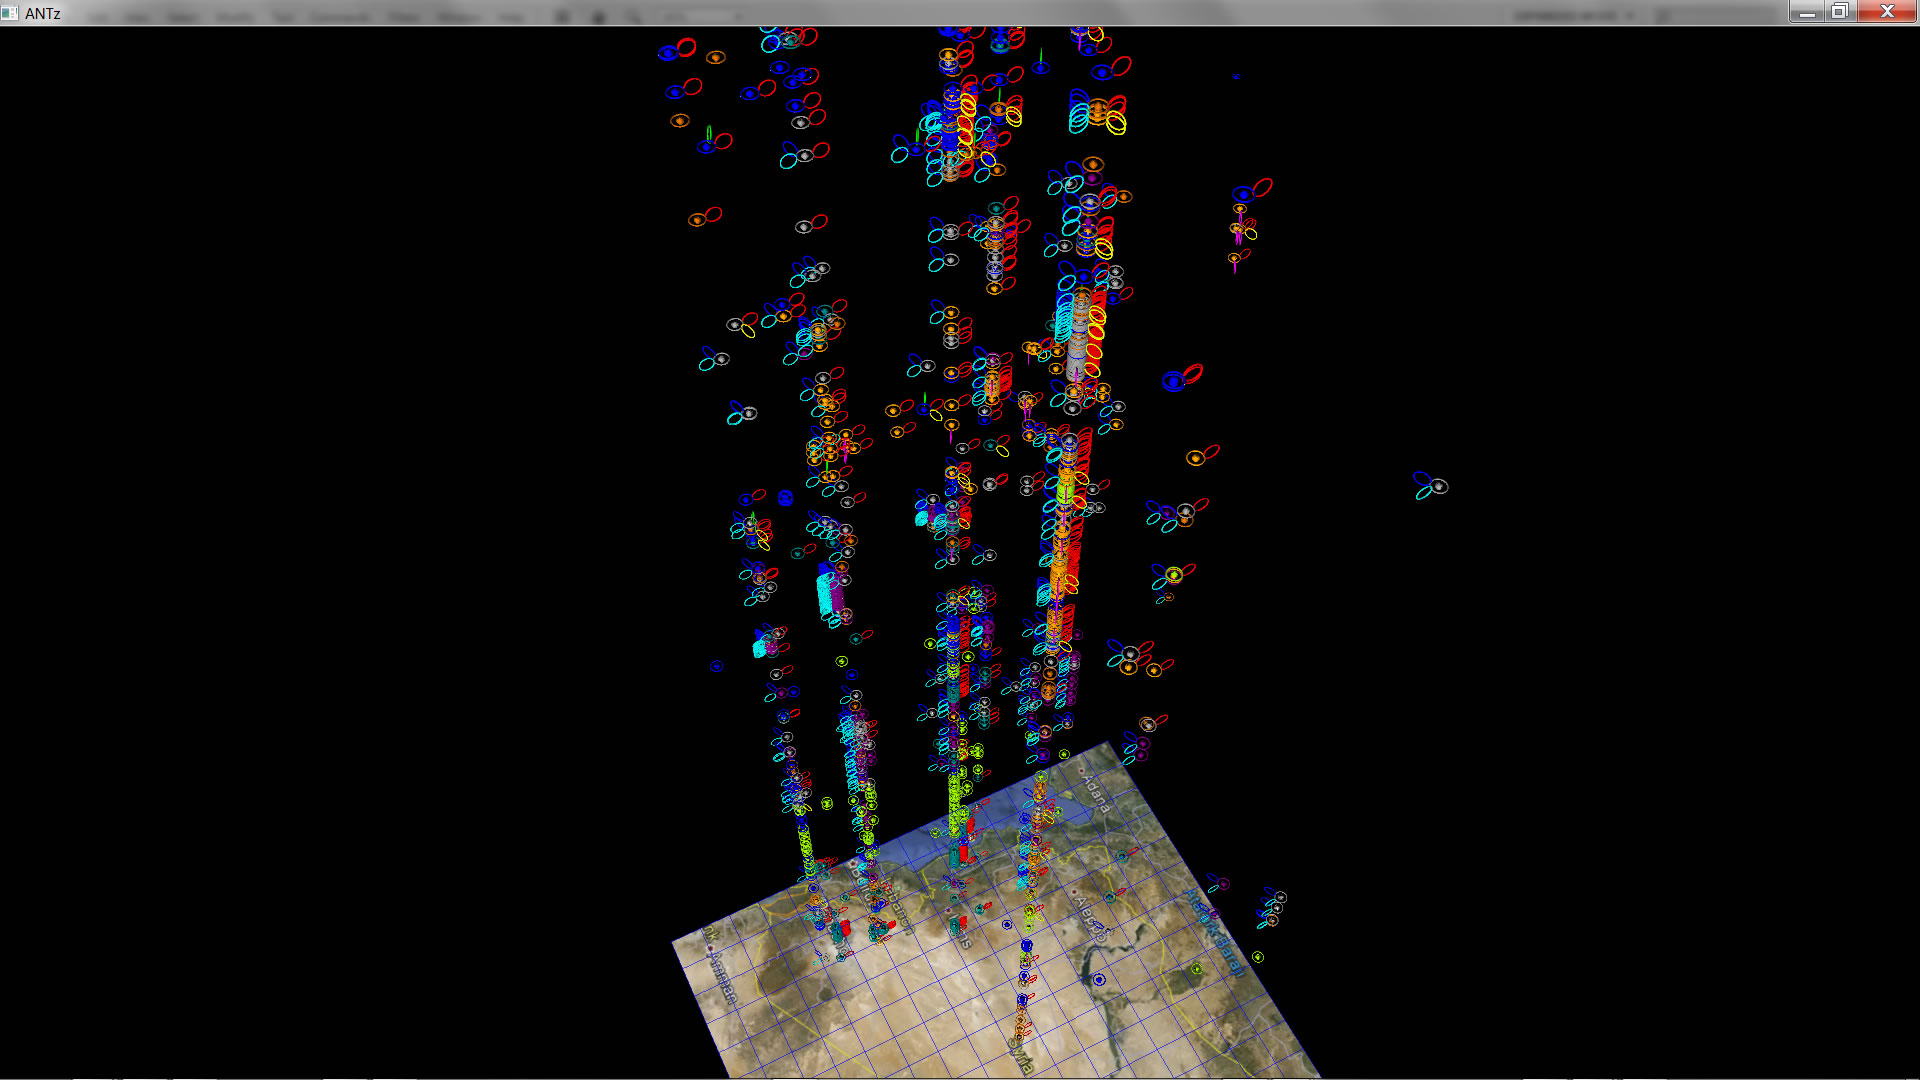
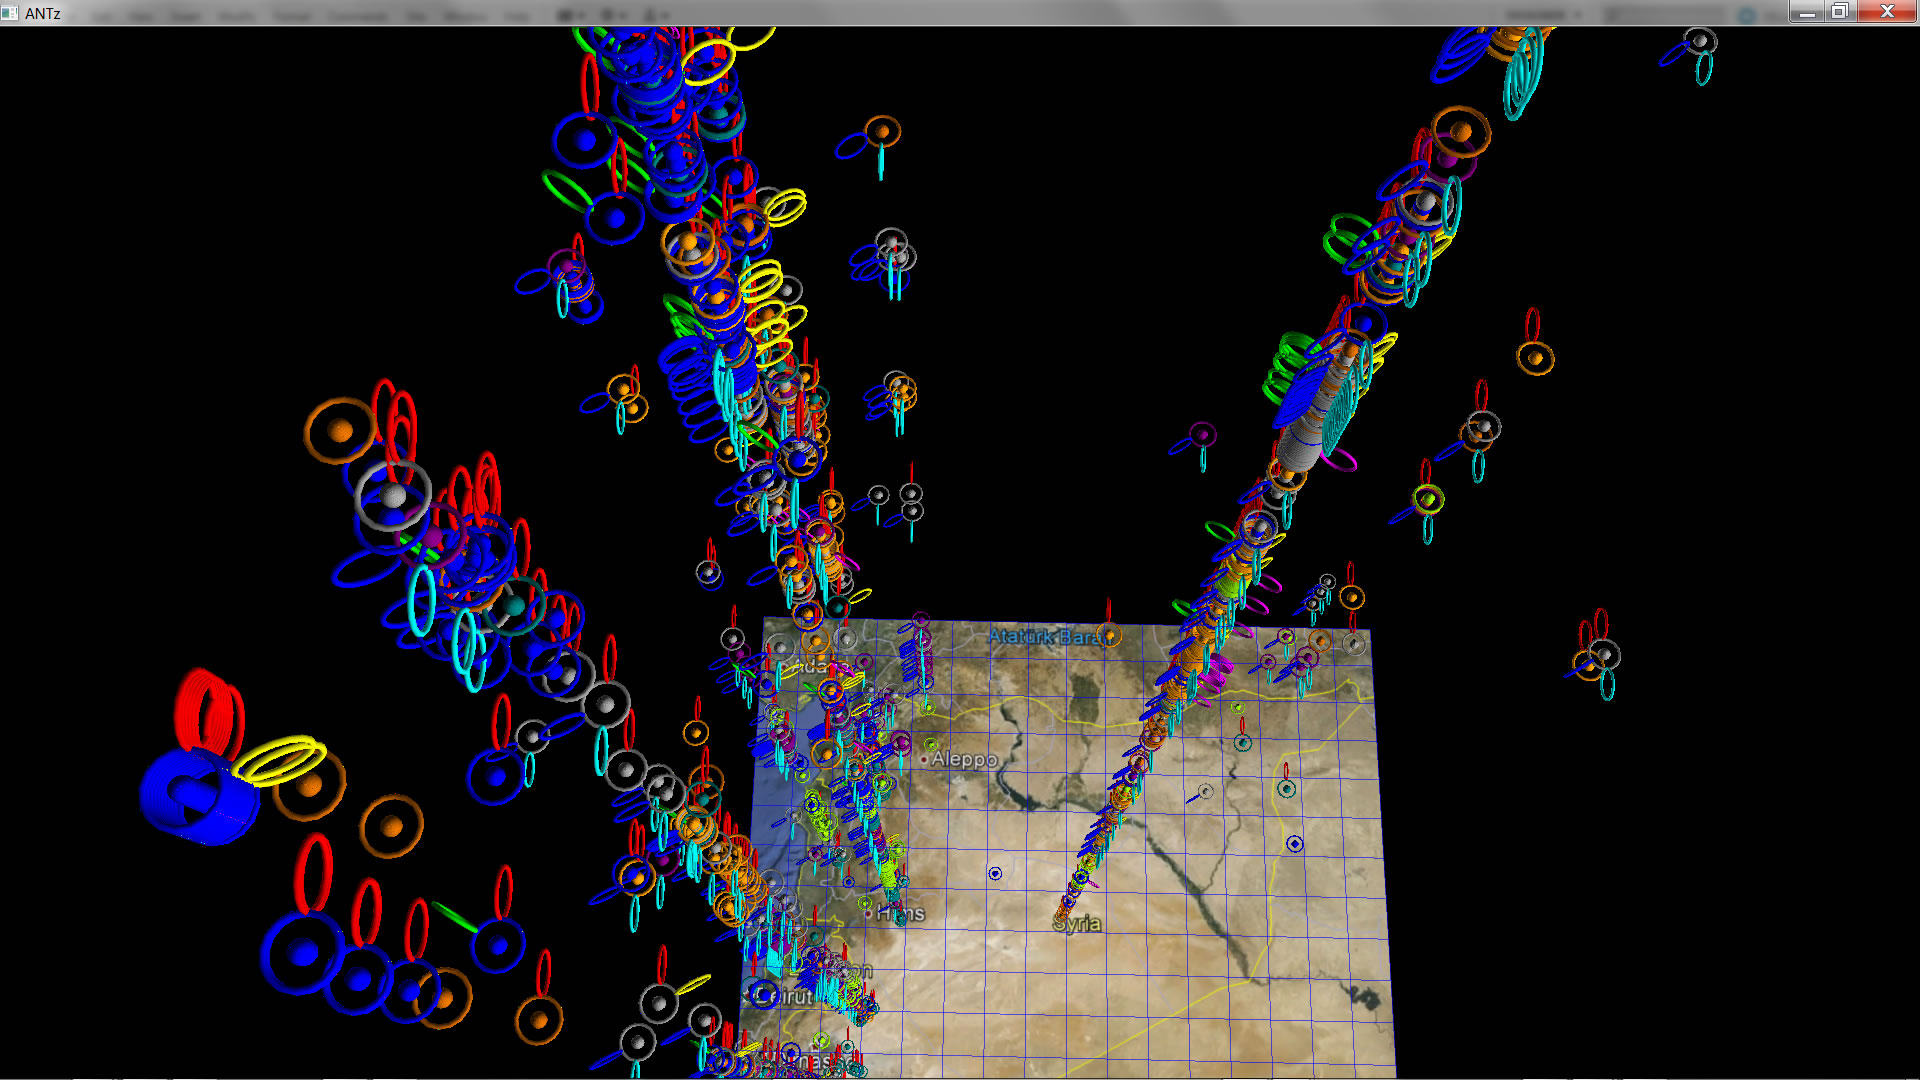
Data was kindly made available from syriatracker.crowdmap.com.
Noteworthy Features
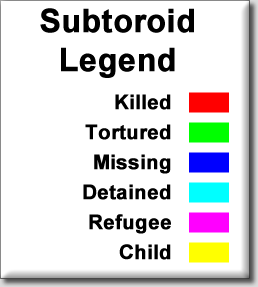
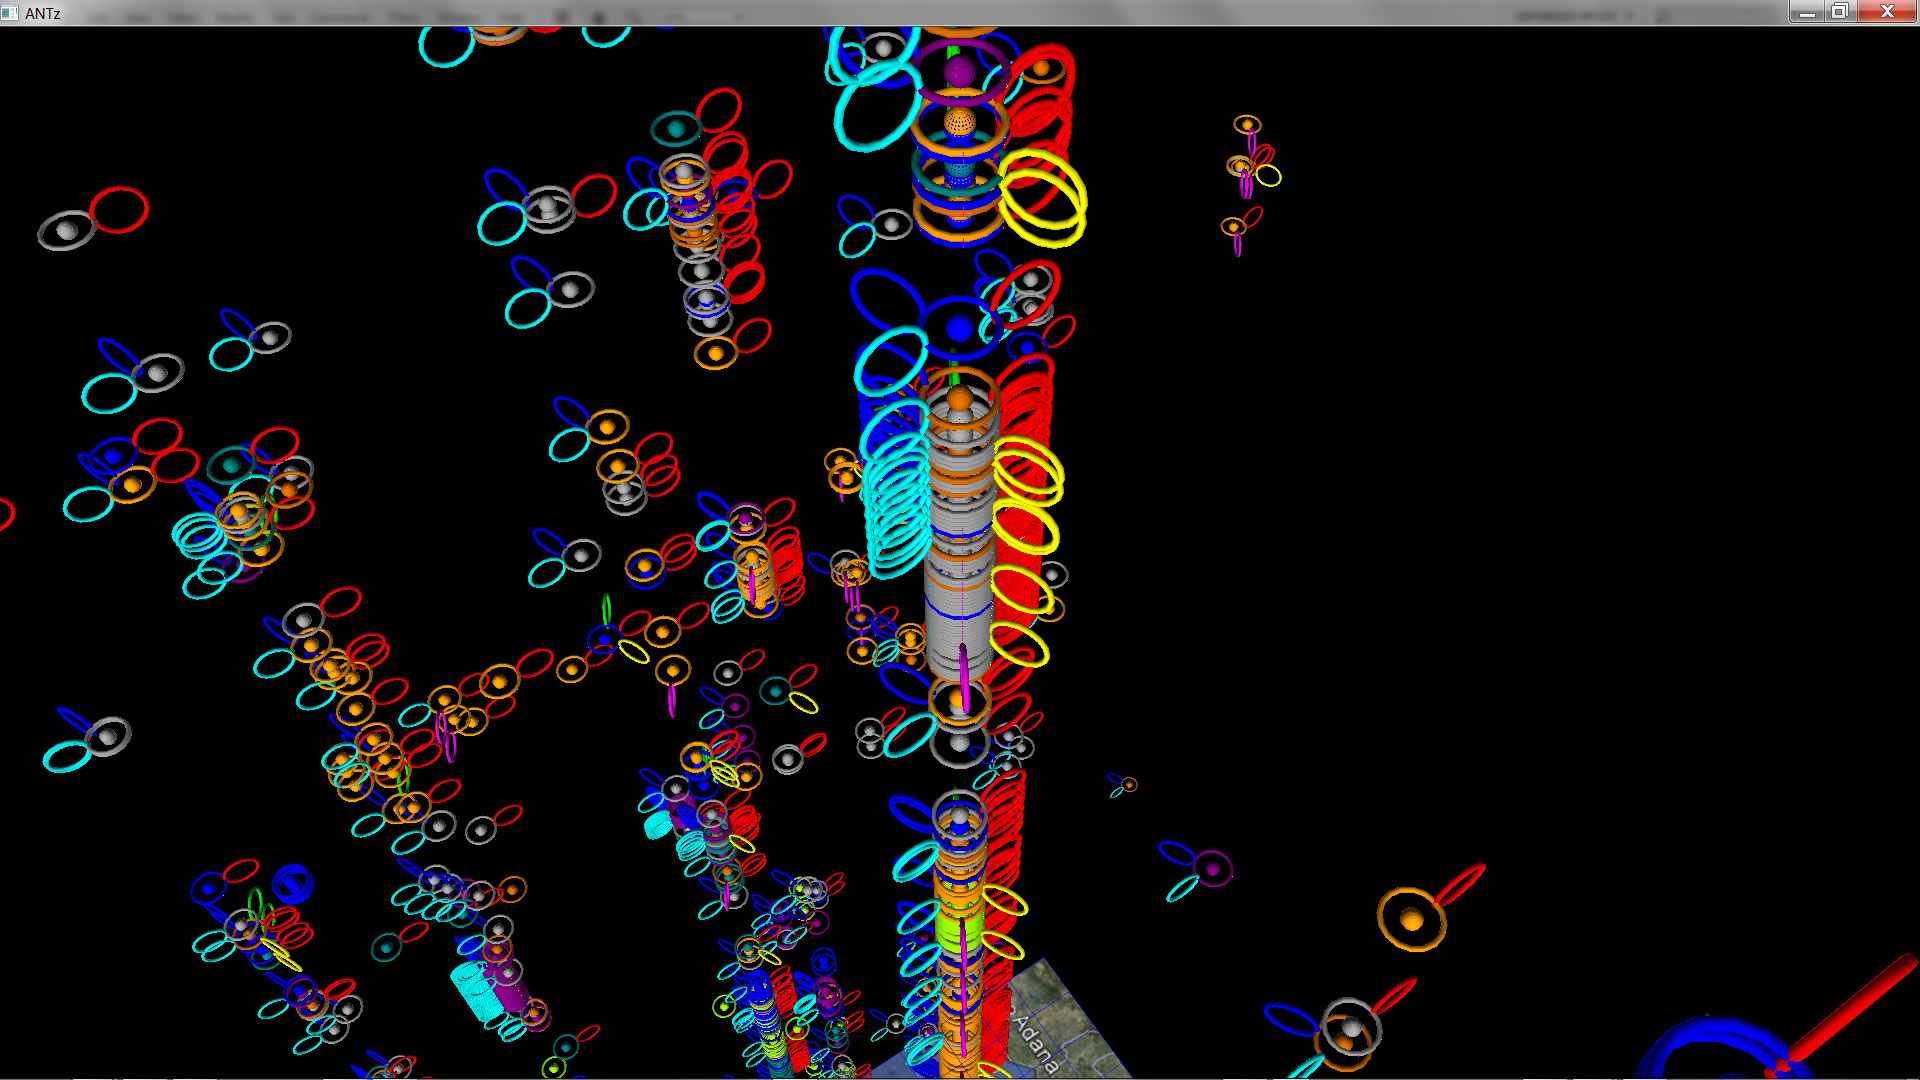
- In early April 2011 there are numerous reports of people killed (red subtoroids).
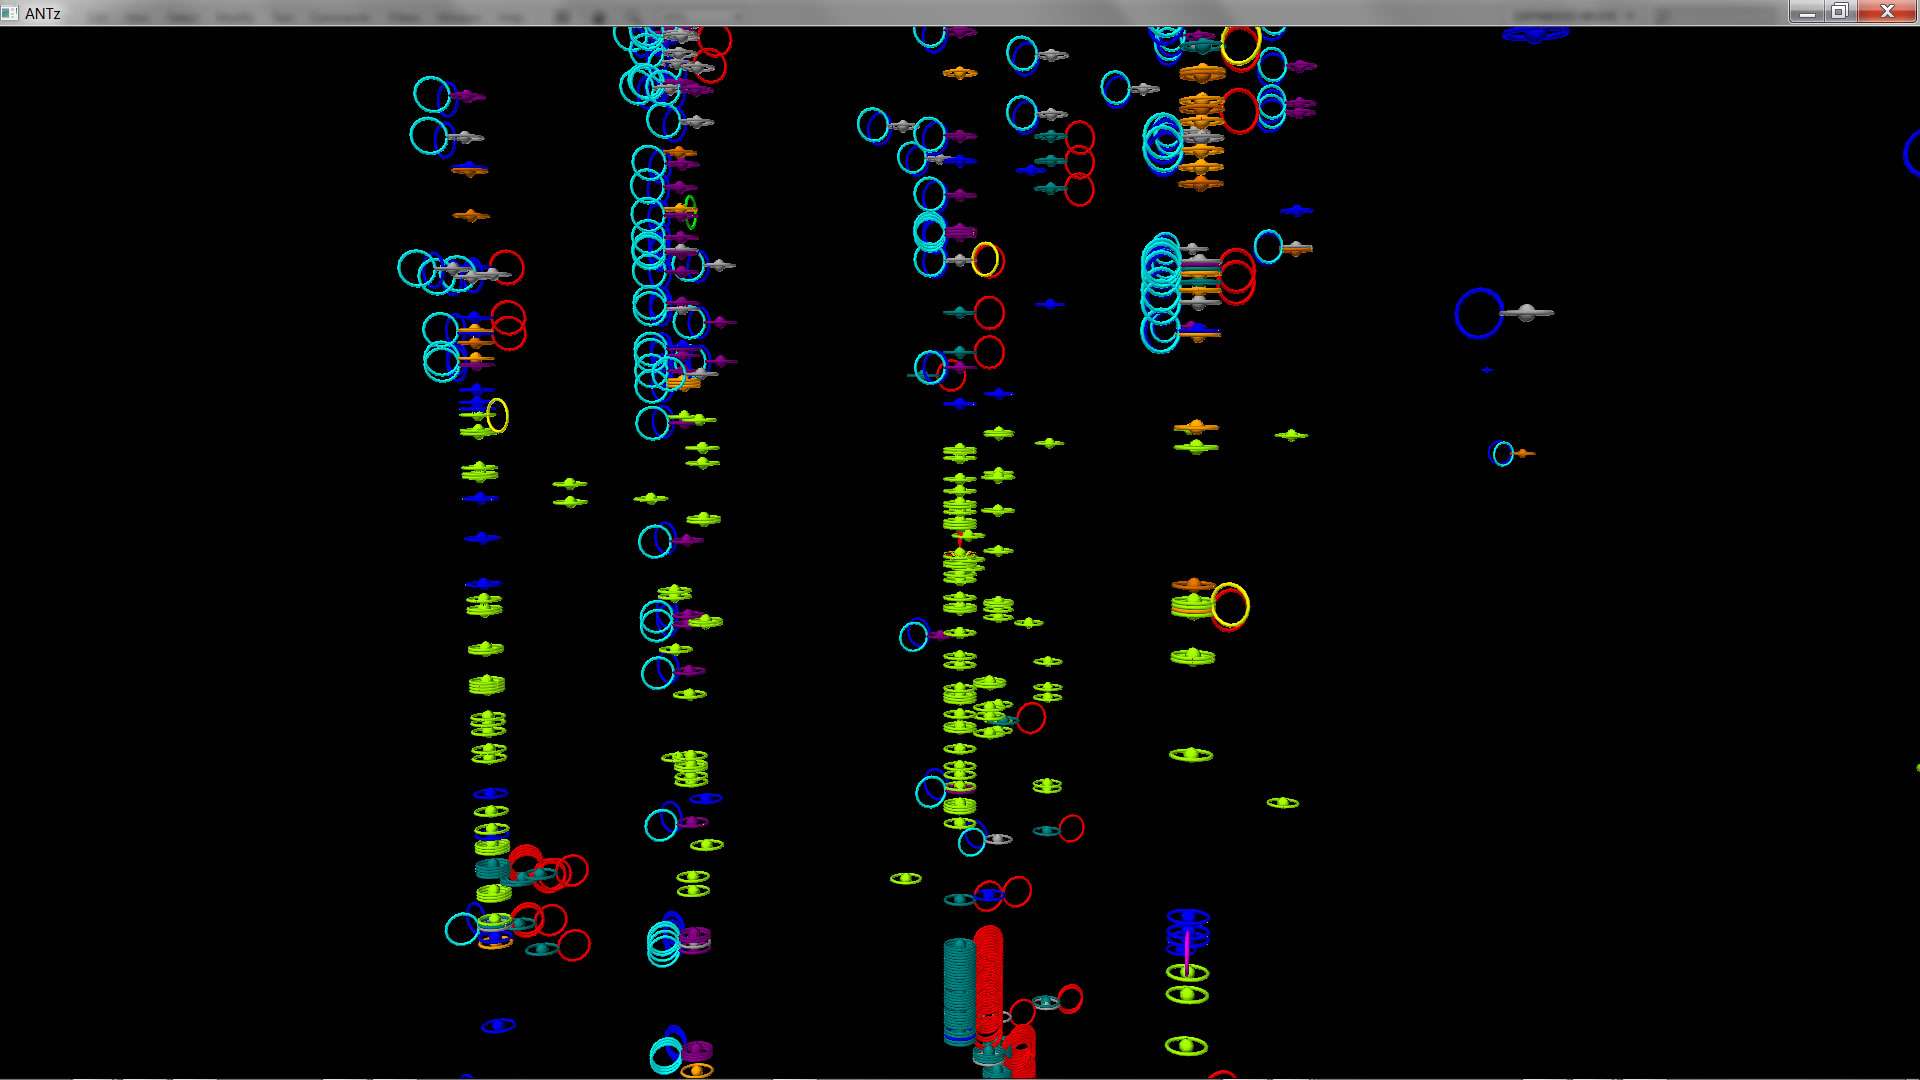
- There are numerous Twitter reports on April 30-May 1 (the grouping of green root toroids). I'm not sure why. That was when NATO bombed Libya's capital.
- There are alot of reports of people missing, detained, or killed, and many are reported as Articles (orange) from May to August.
- Most recently (near the top) there are just alot of reports of people missing, detained, alot killed, and ALOT of it happening to children (yellow toroids near the top) from August 2011 to the present.
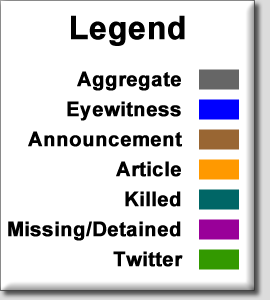
Color Legend
|