Here is a selection of my latest visualization work.
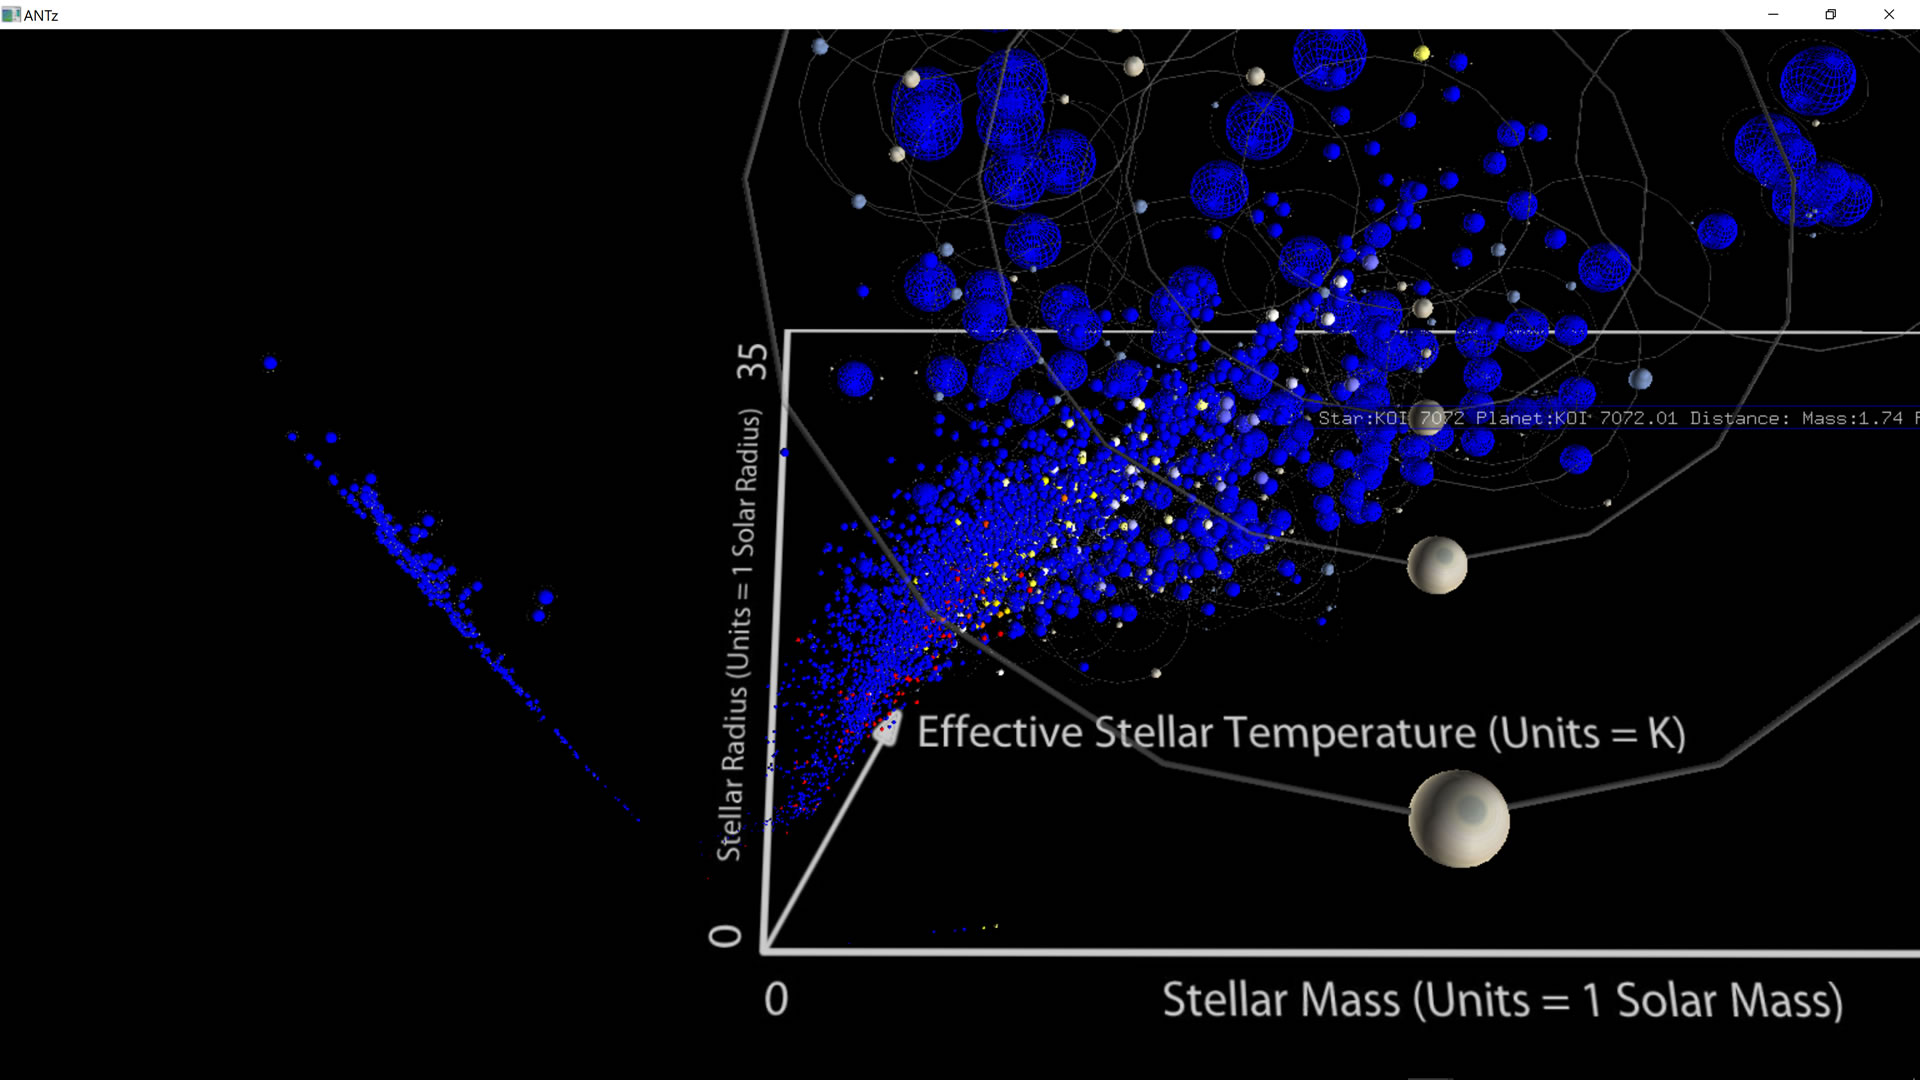
Exoplanet Database
Visualizing the exoplanet database was a great idea which I borrowed from Jamie Schmidt, student of Dan Palmer's at John Carroll University.
View the viz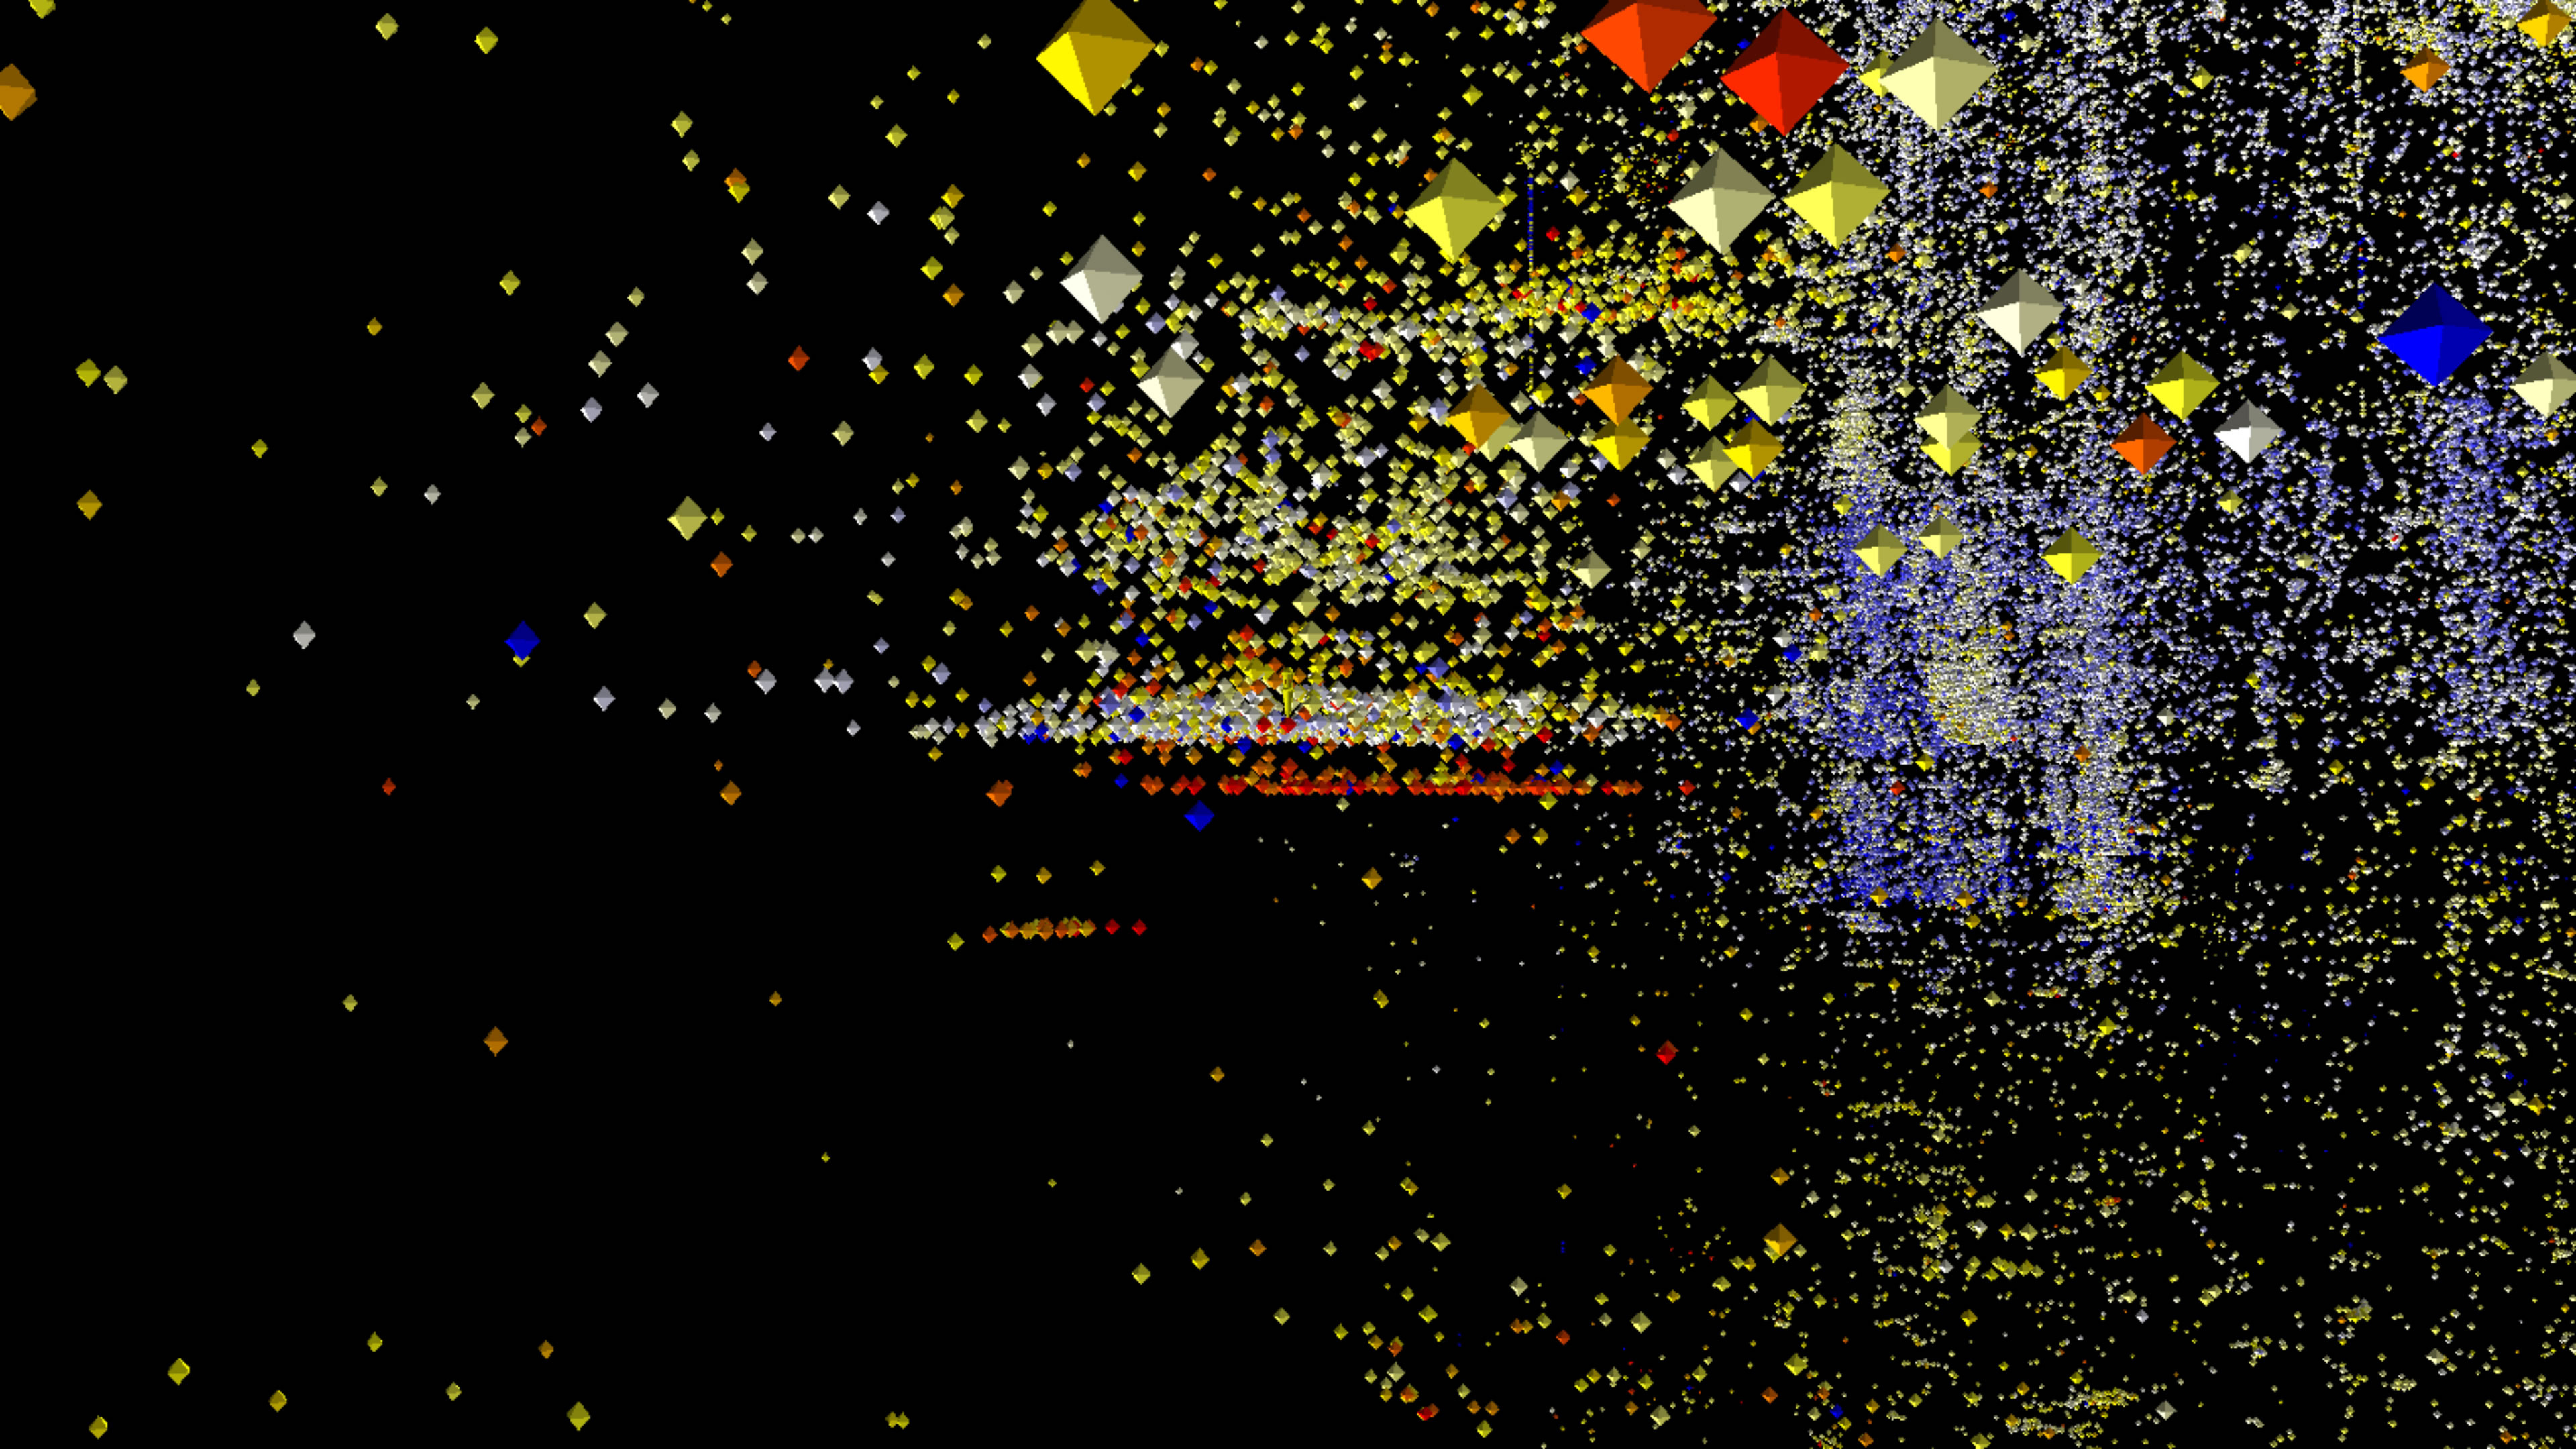
SCEC Earthquake Data
The Southern California Earthquake Center makes their data available and there's lots of it. This is a visualization of the entire history of southern California earthquakes, more than 700,000.
View the Viz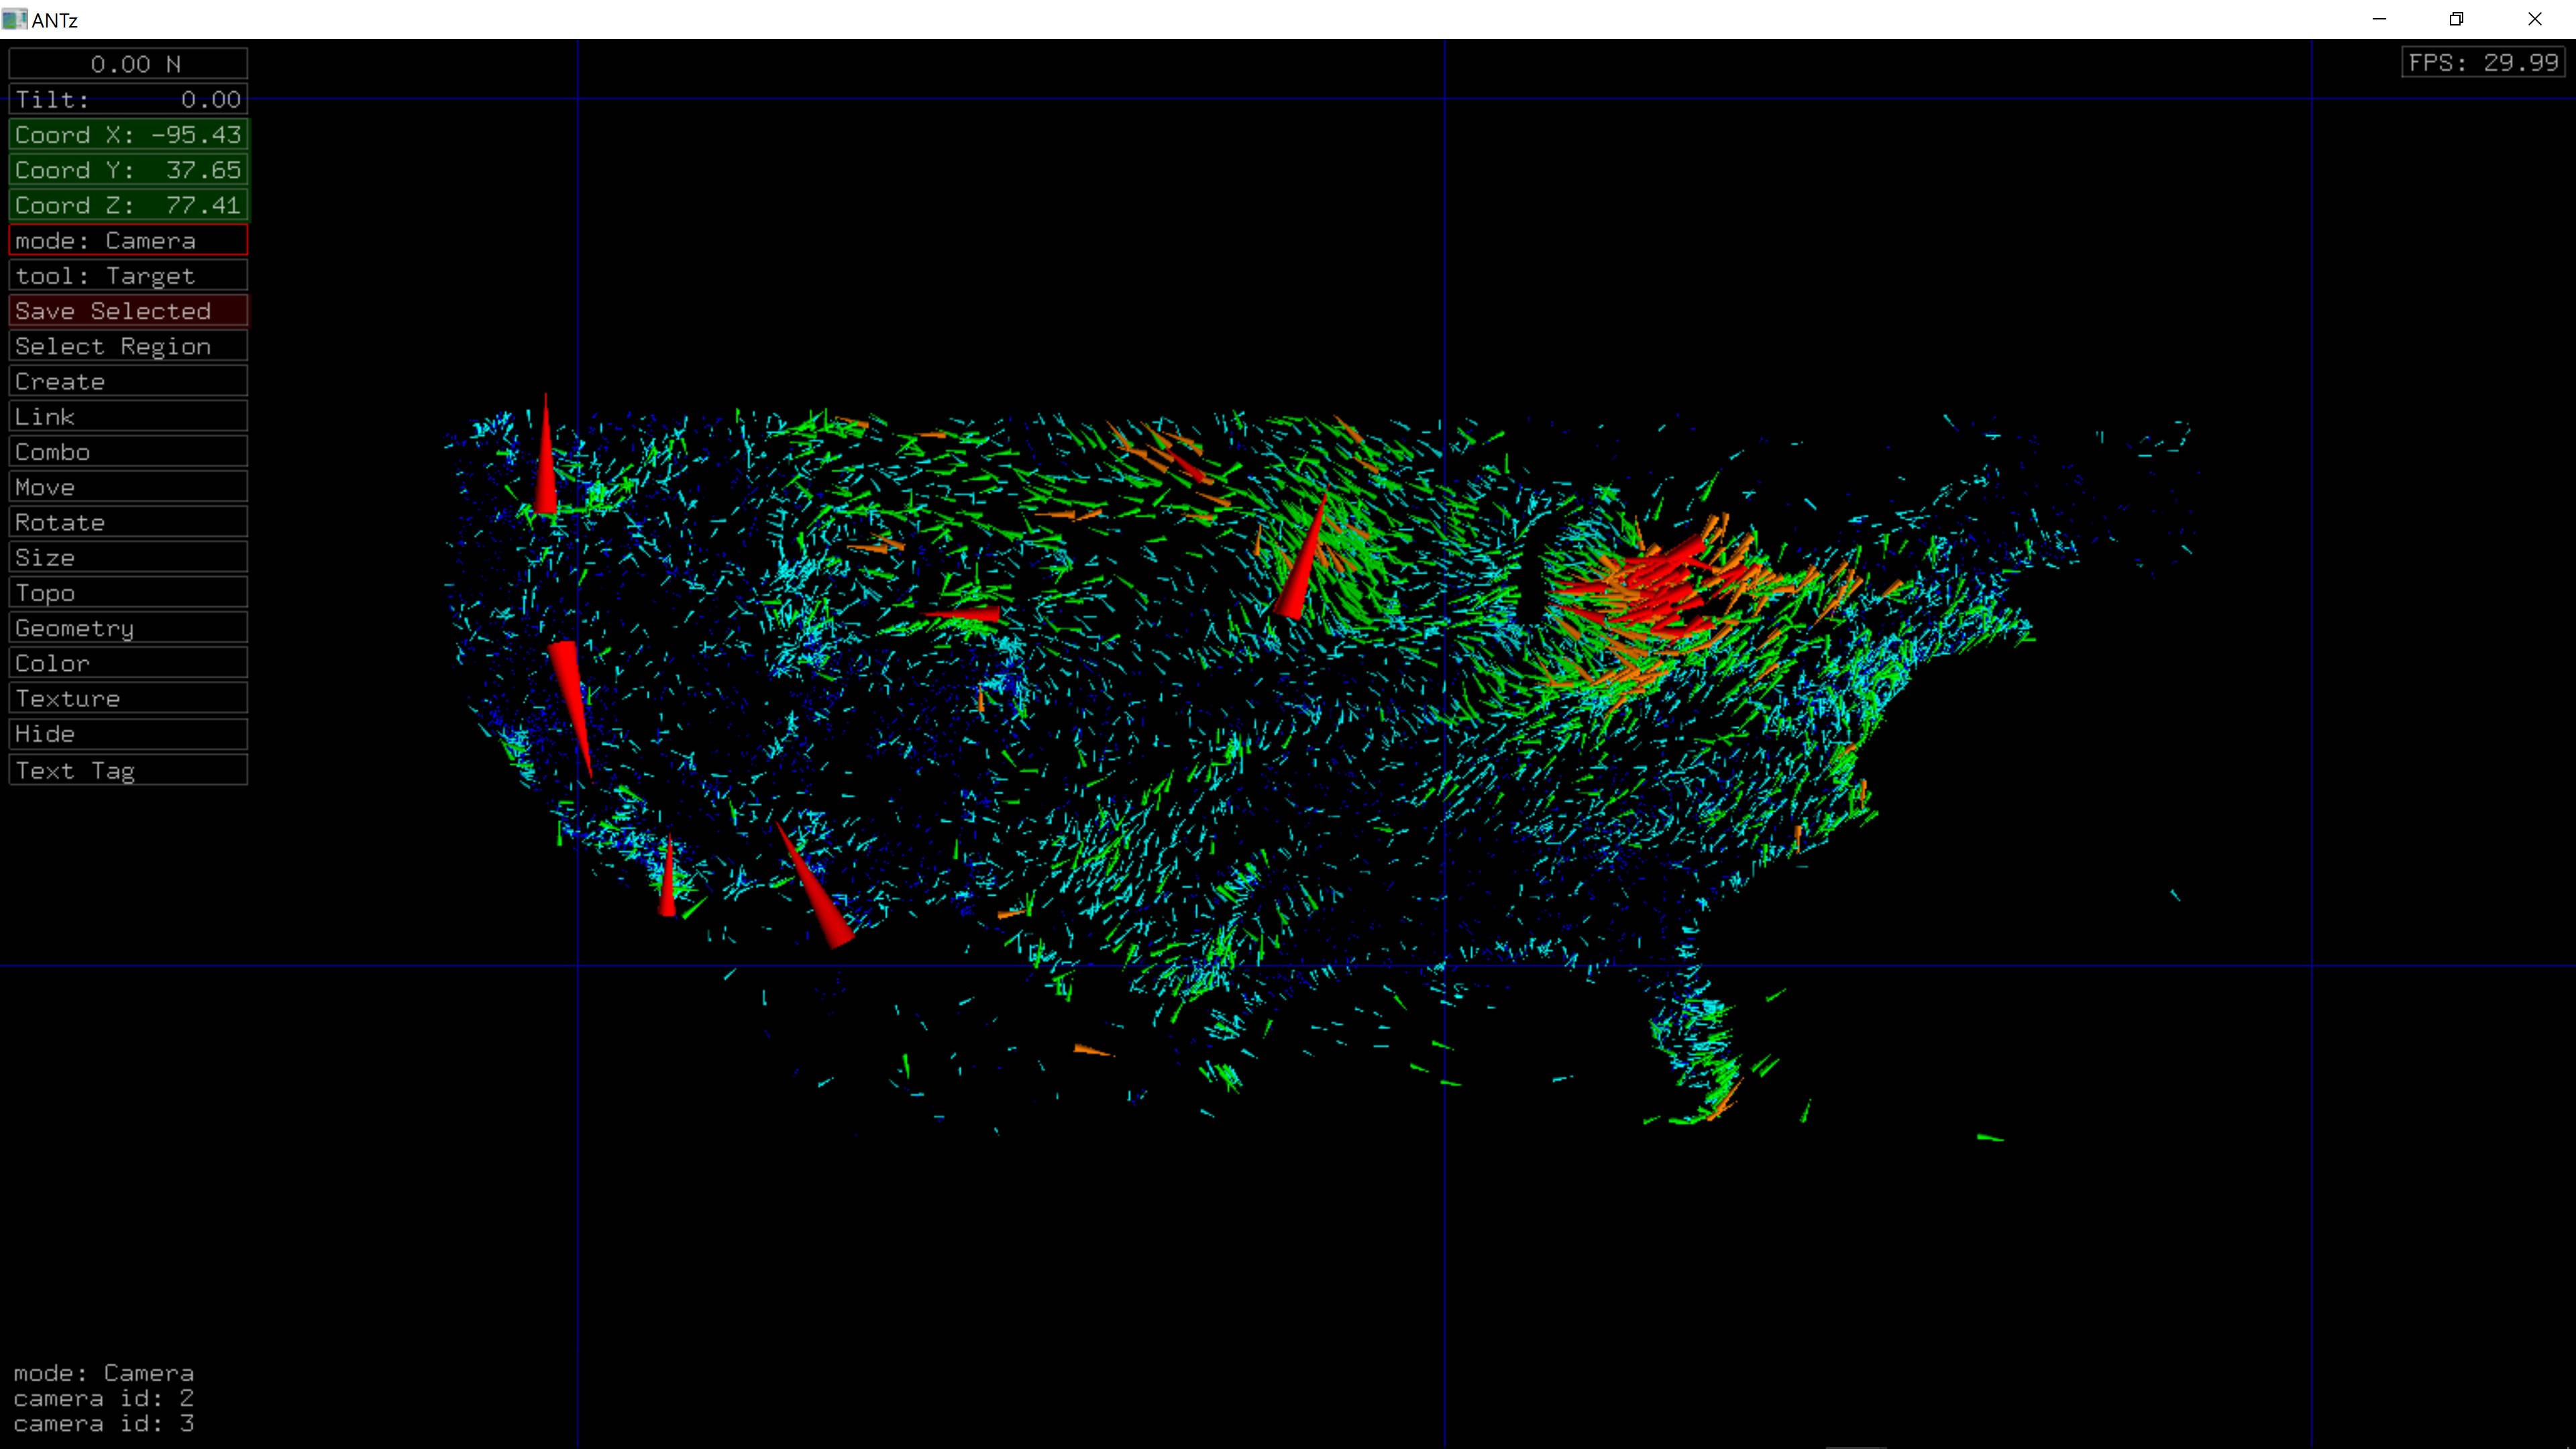
Weather Data
This is an animation of nearly one month of wind data collected 8 times per day and painstakingly pieced together frame by frame to create a really cool animation.
View the Viz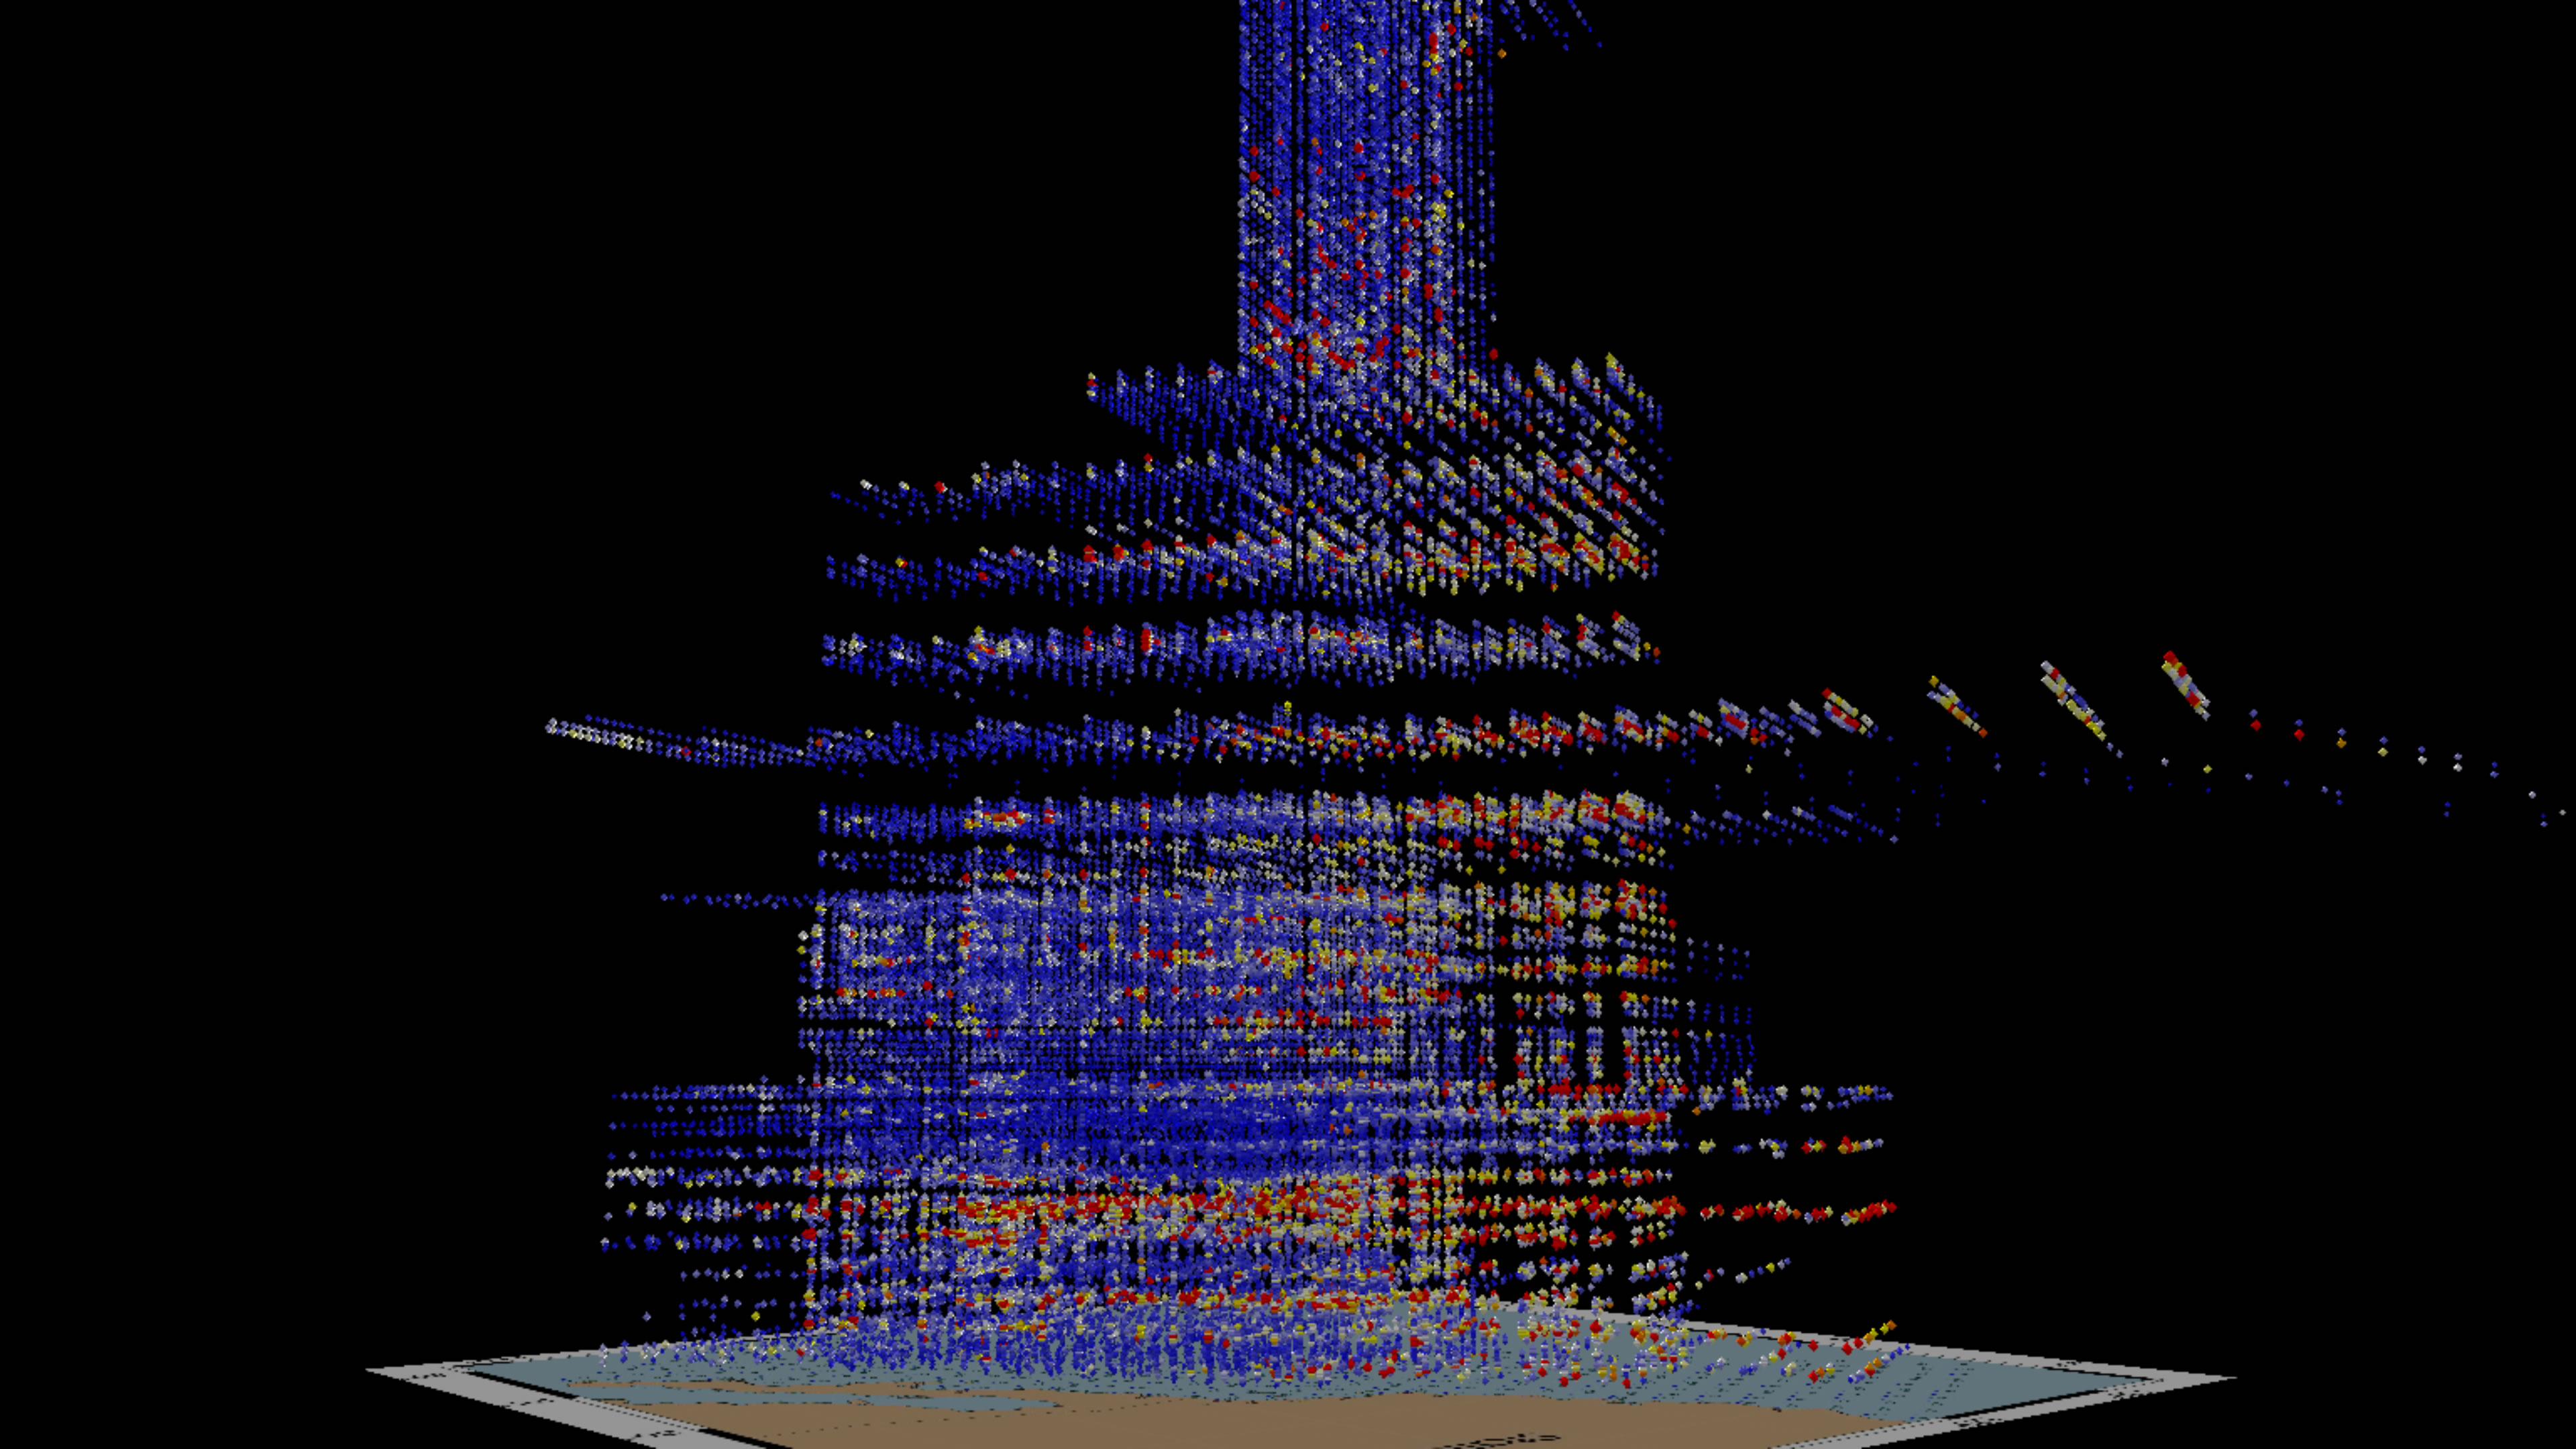
CalCOFI Plankton Biomass
The California Coastal Ocean Fisheries Investigations have collected a fascinating dataset spanning more than 60 years of macrozooplanktion biomass.
View the Viz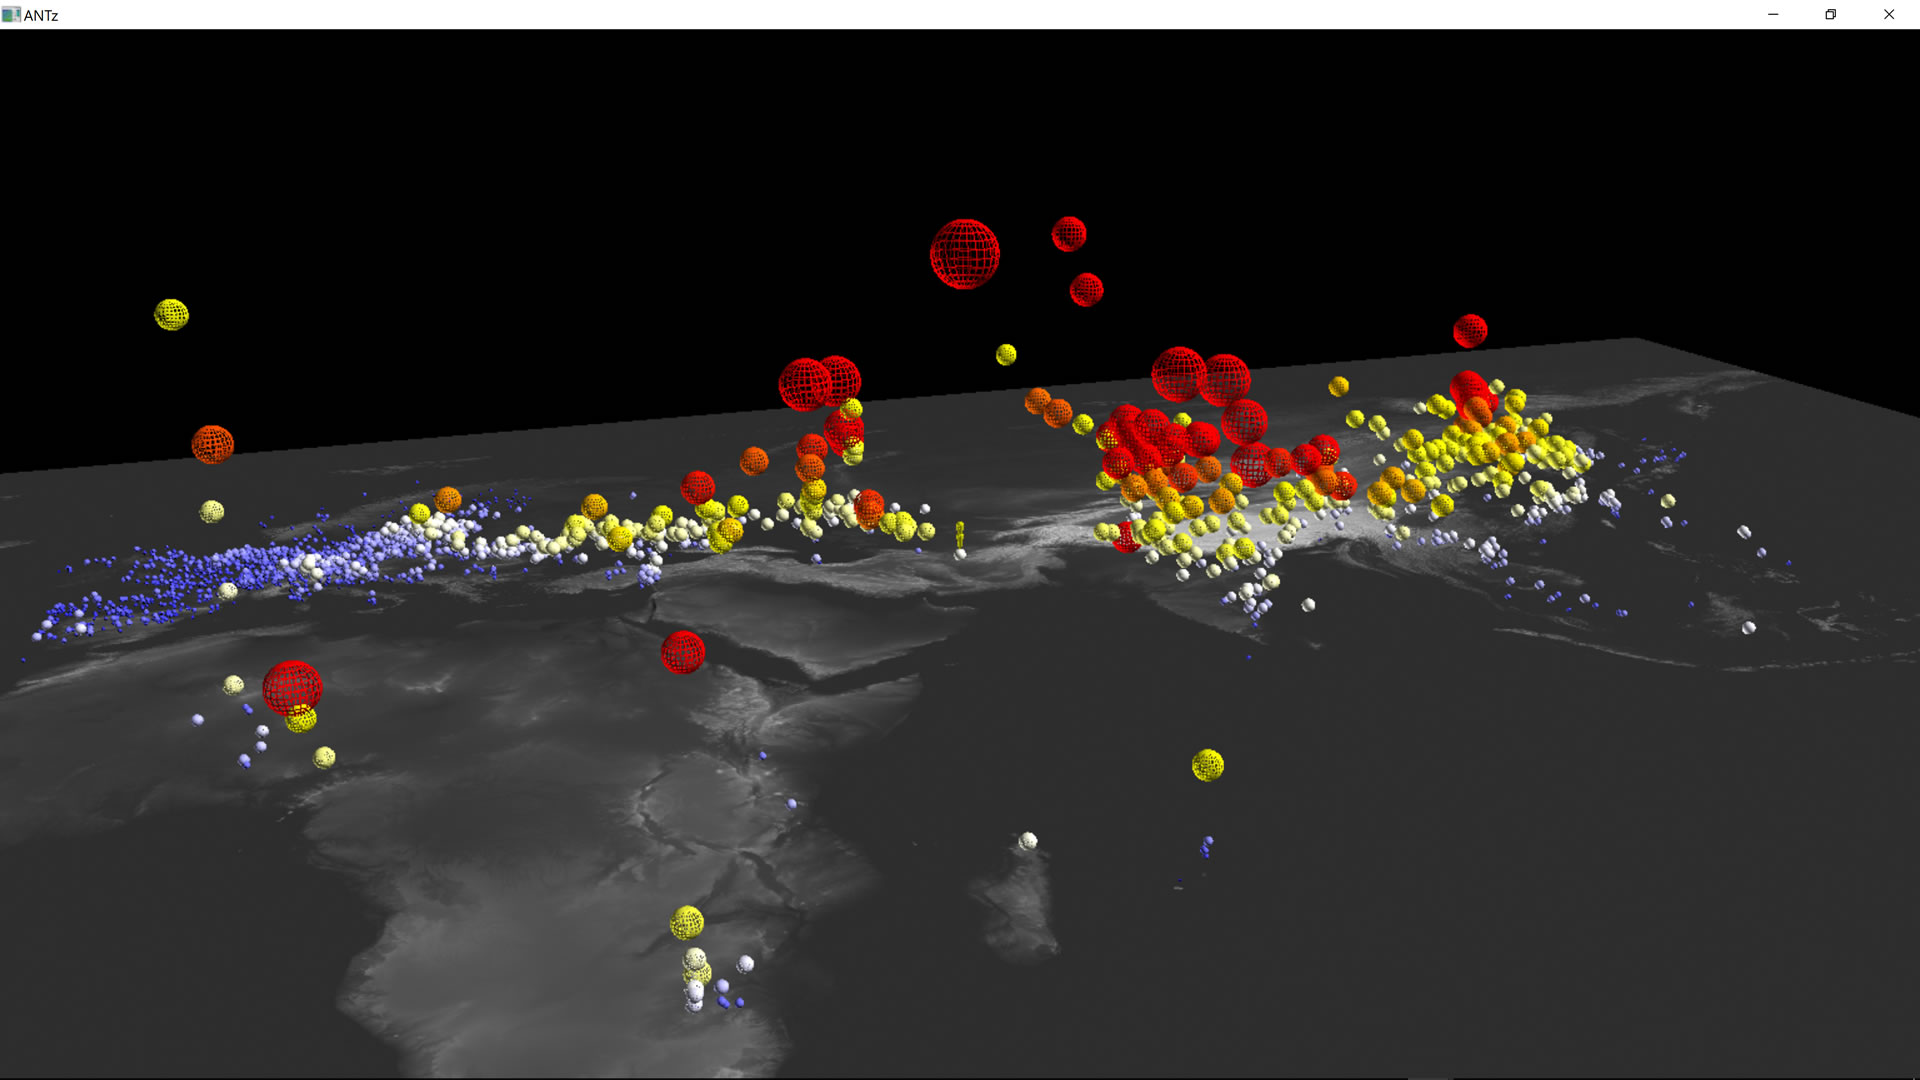
Global Urban Ambient Air Pollution
A recent dataset containing two types of air pollution measures for hundreds of cities around the world.
View the Viz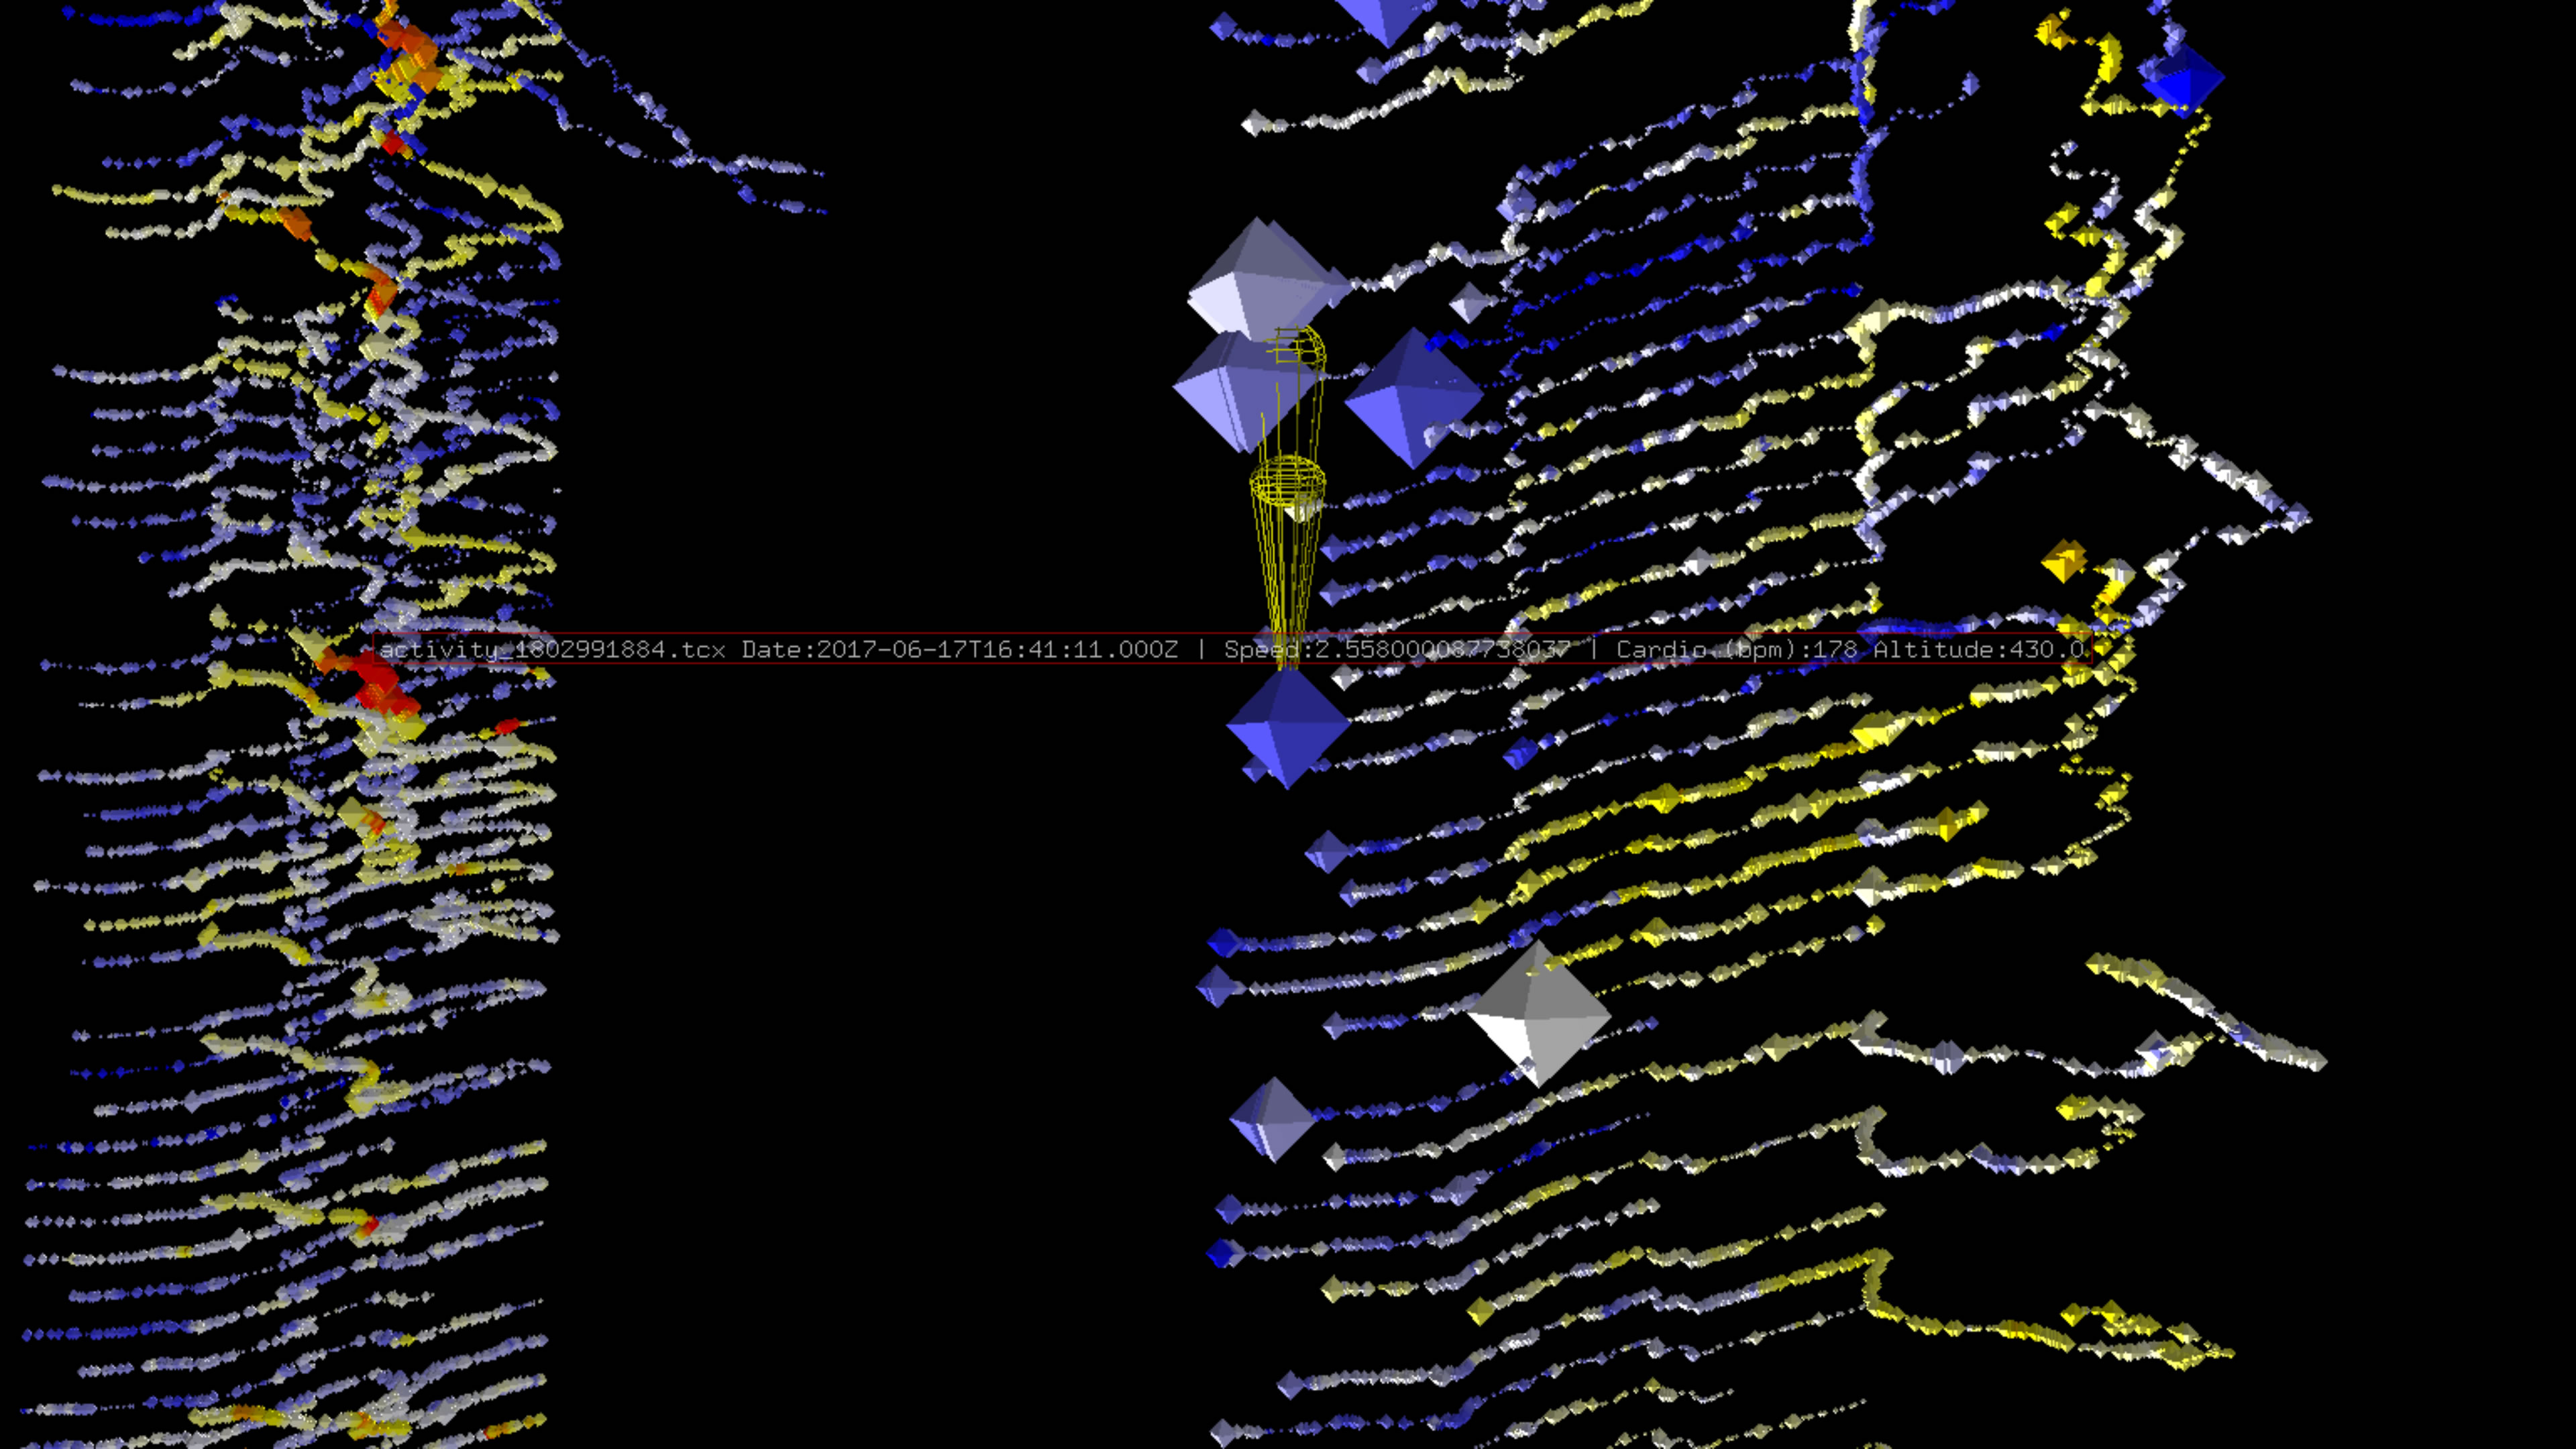
Fitness Tracking
My own personal fitness tracking data of hikes I have done up Cowles Mountain using a Garmin Vivosmart HR+.
View the Viz