Pure Math Visualizations
Hyperdimensional Coordinate System
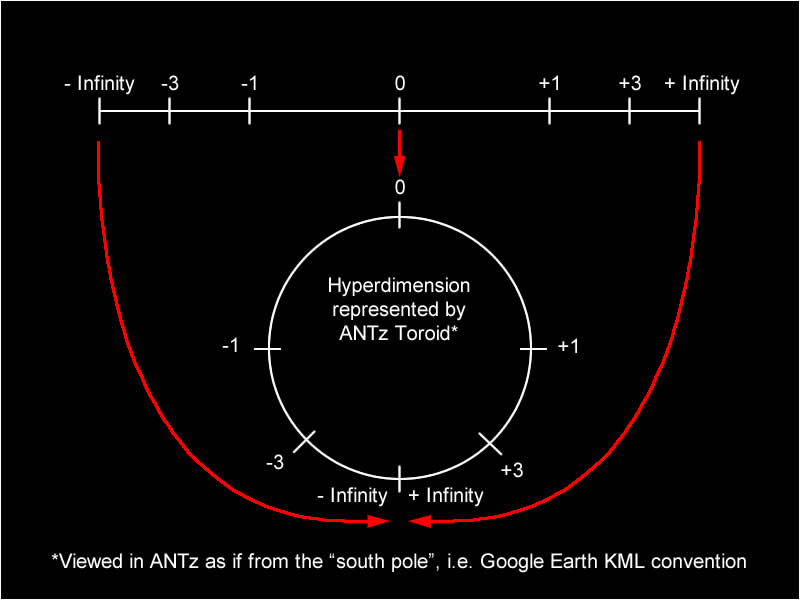
The idea behind the hyperdimensional coordinate system came from a combination of things. Dr. Art Springer gave us the idea of a coordinate line which could be short in reality but able to include all numbers from negative infinite to infinity. I had the additional insight that this line could be the circumference of a circle.
A few years later I was trying to write the code to calculate the fractal dimension of a time series by embedding it in a range of dimensions and looking for scaling properties. The difficulty with this was that it wasn't possible to visualize time series embedded in dimensions higher than 3, until ANTz. The vision of Dave Warner and Shane Saxon allowed me to combine these two ideas and apply them to ANTz we are now able to see what a simple sin wave looks like in higher dimensions.
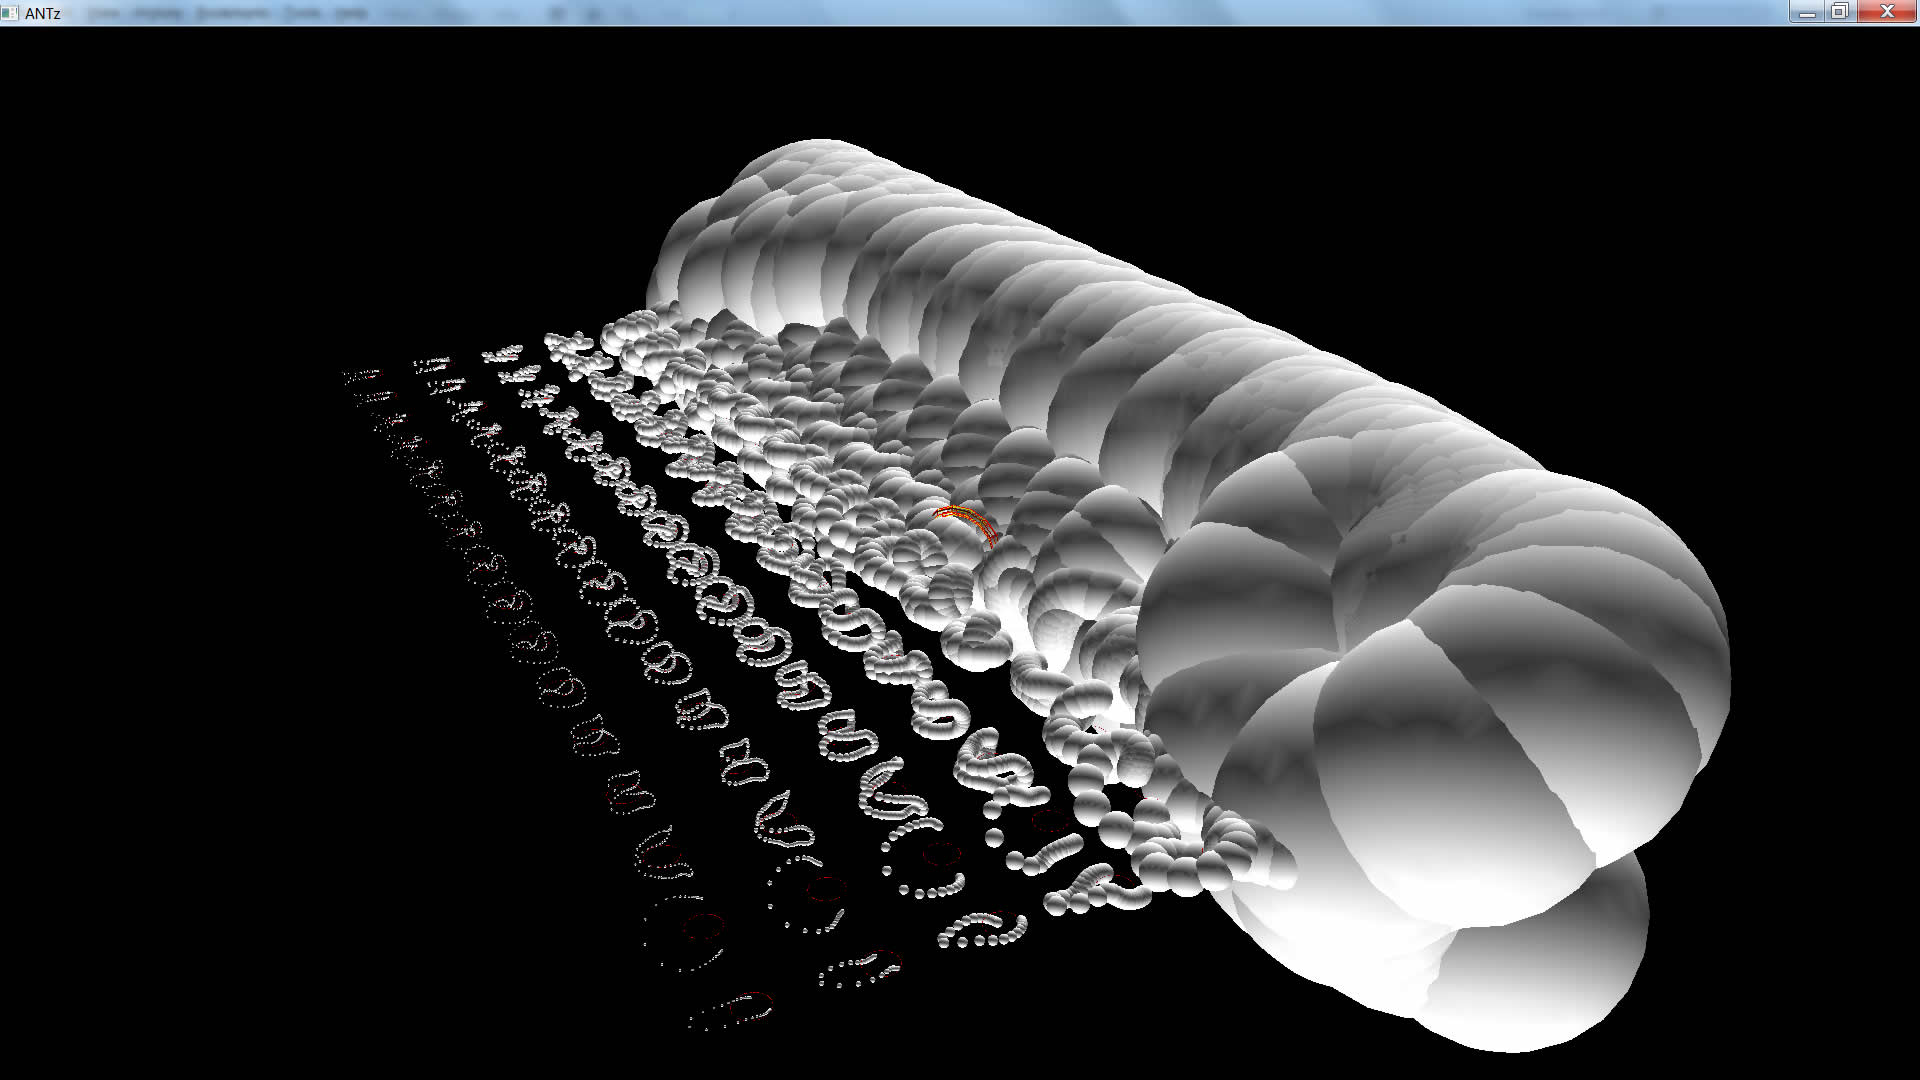
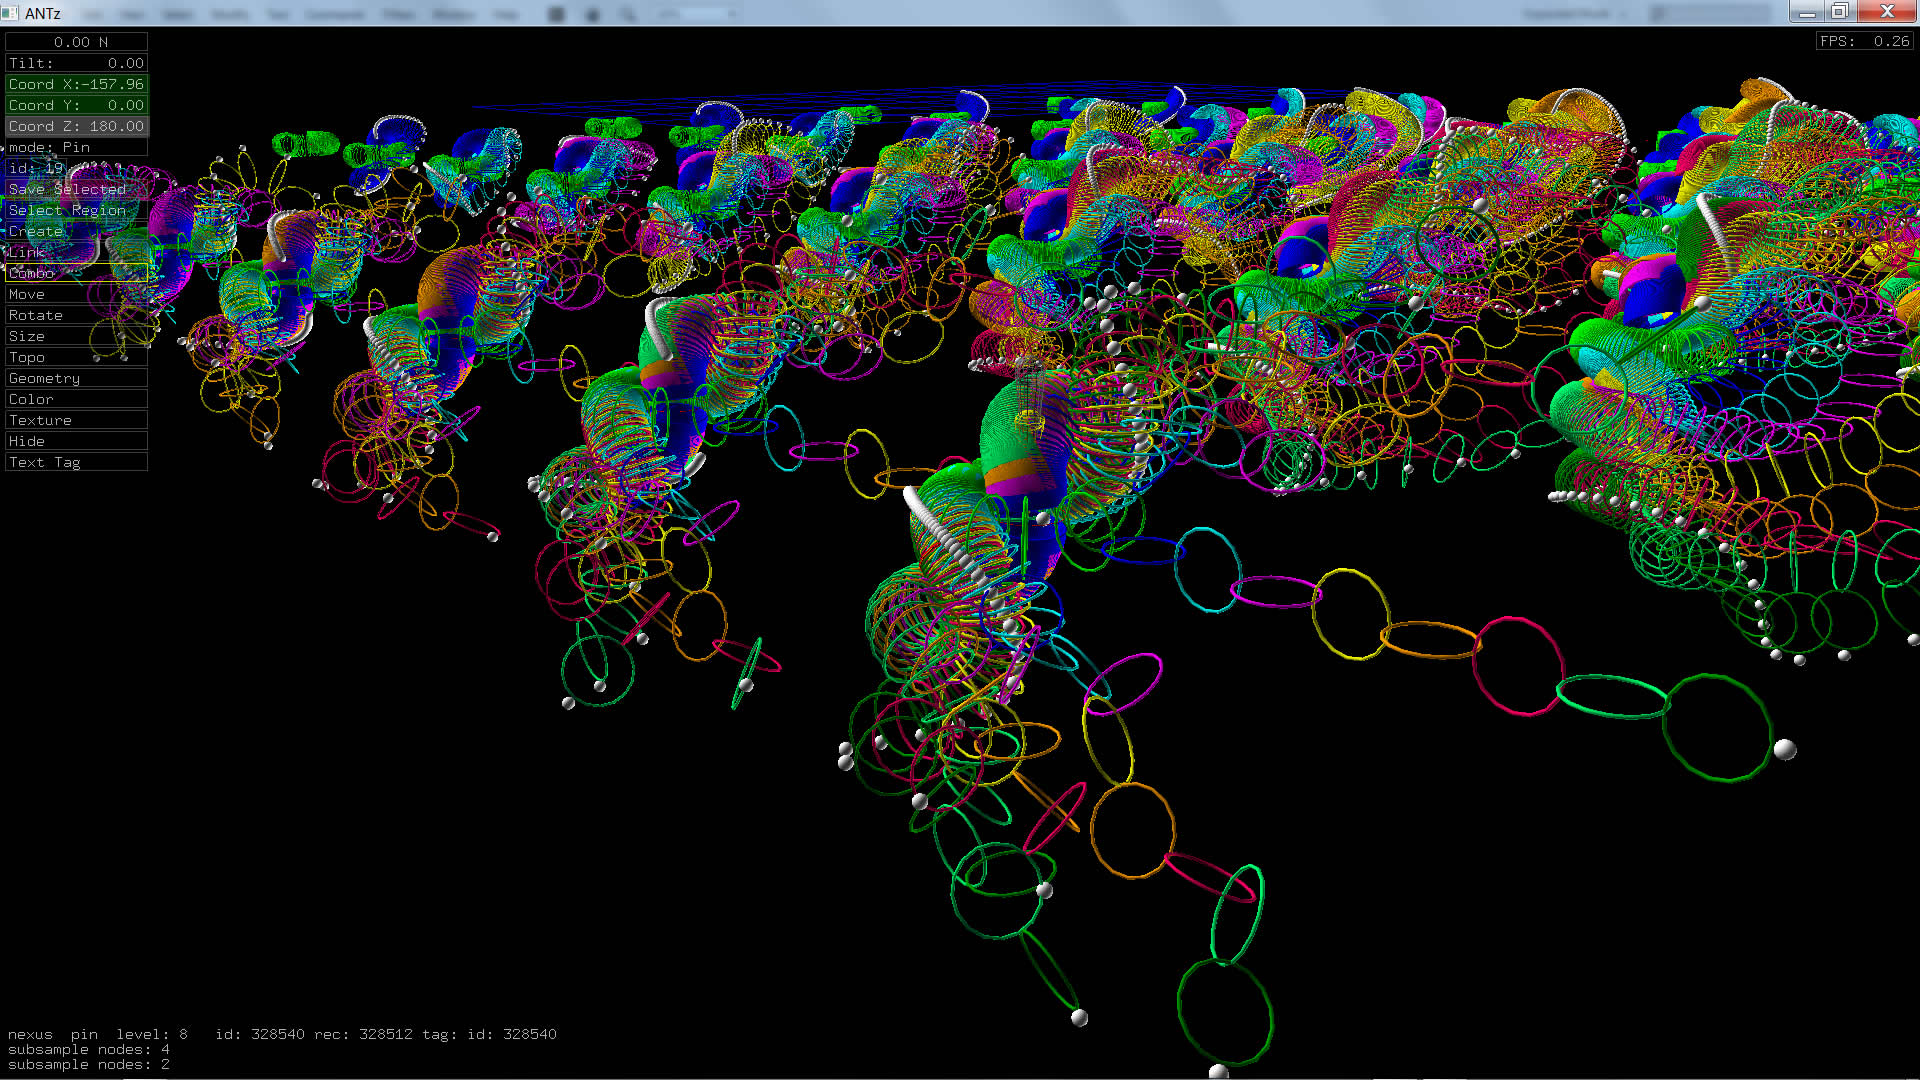
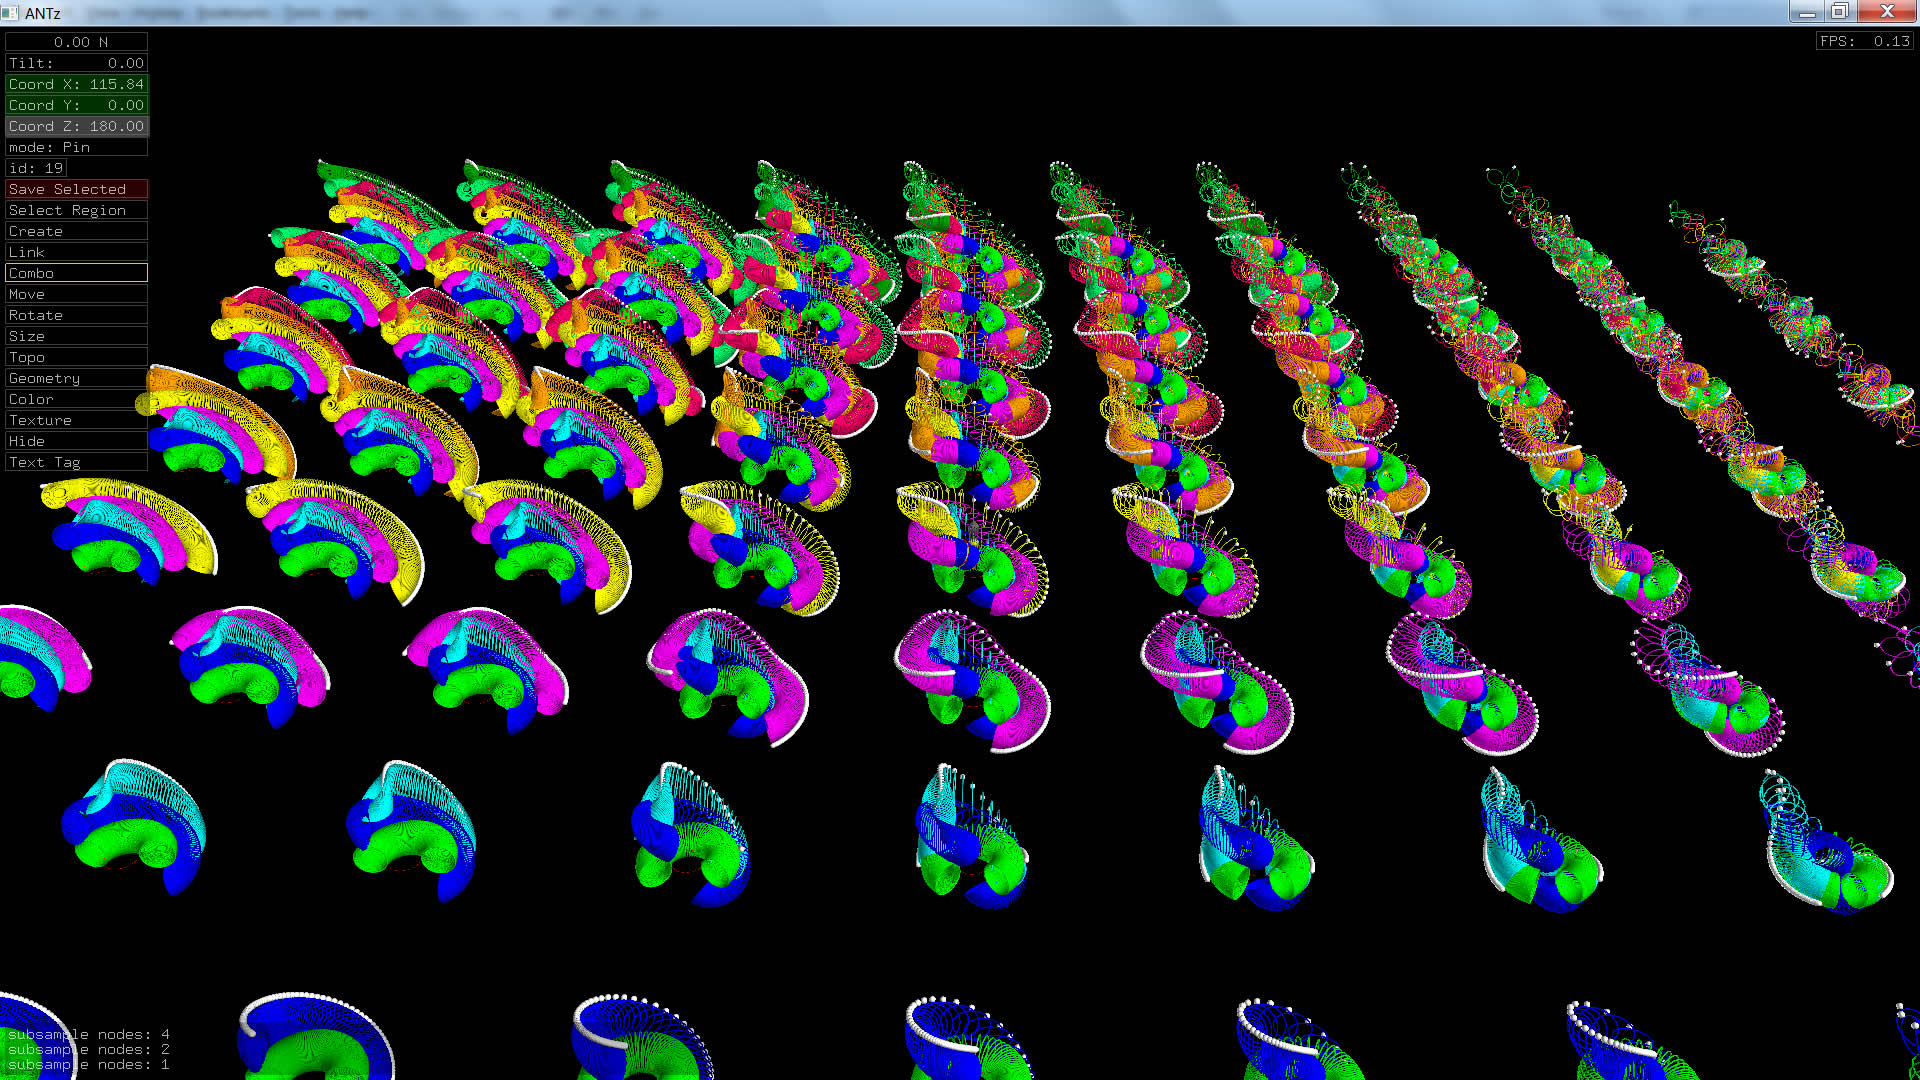
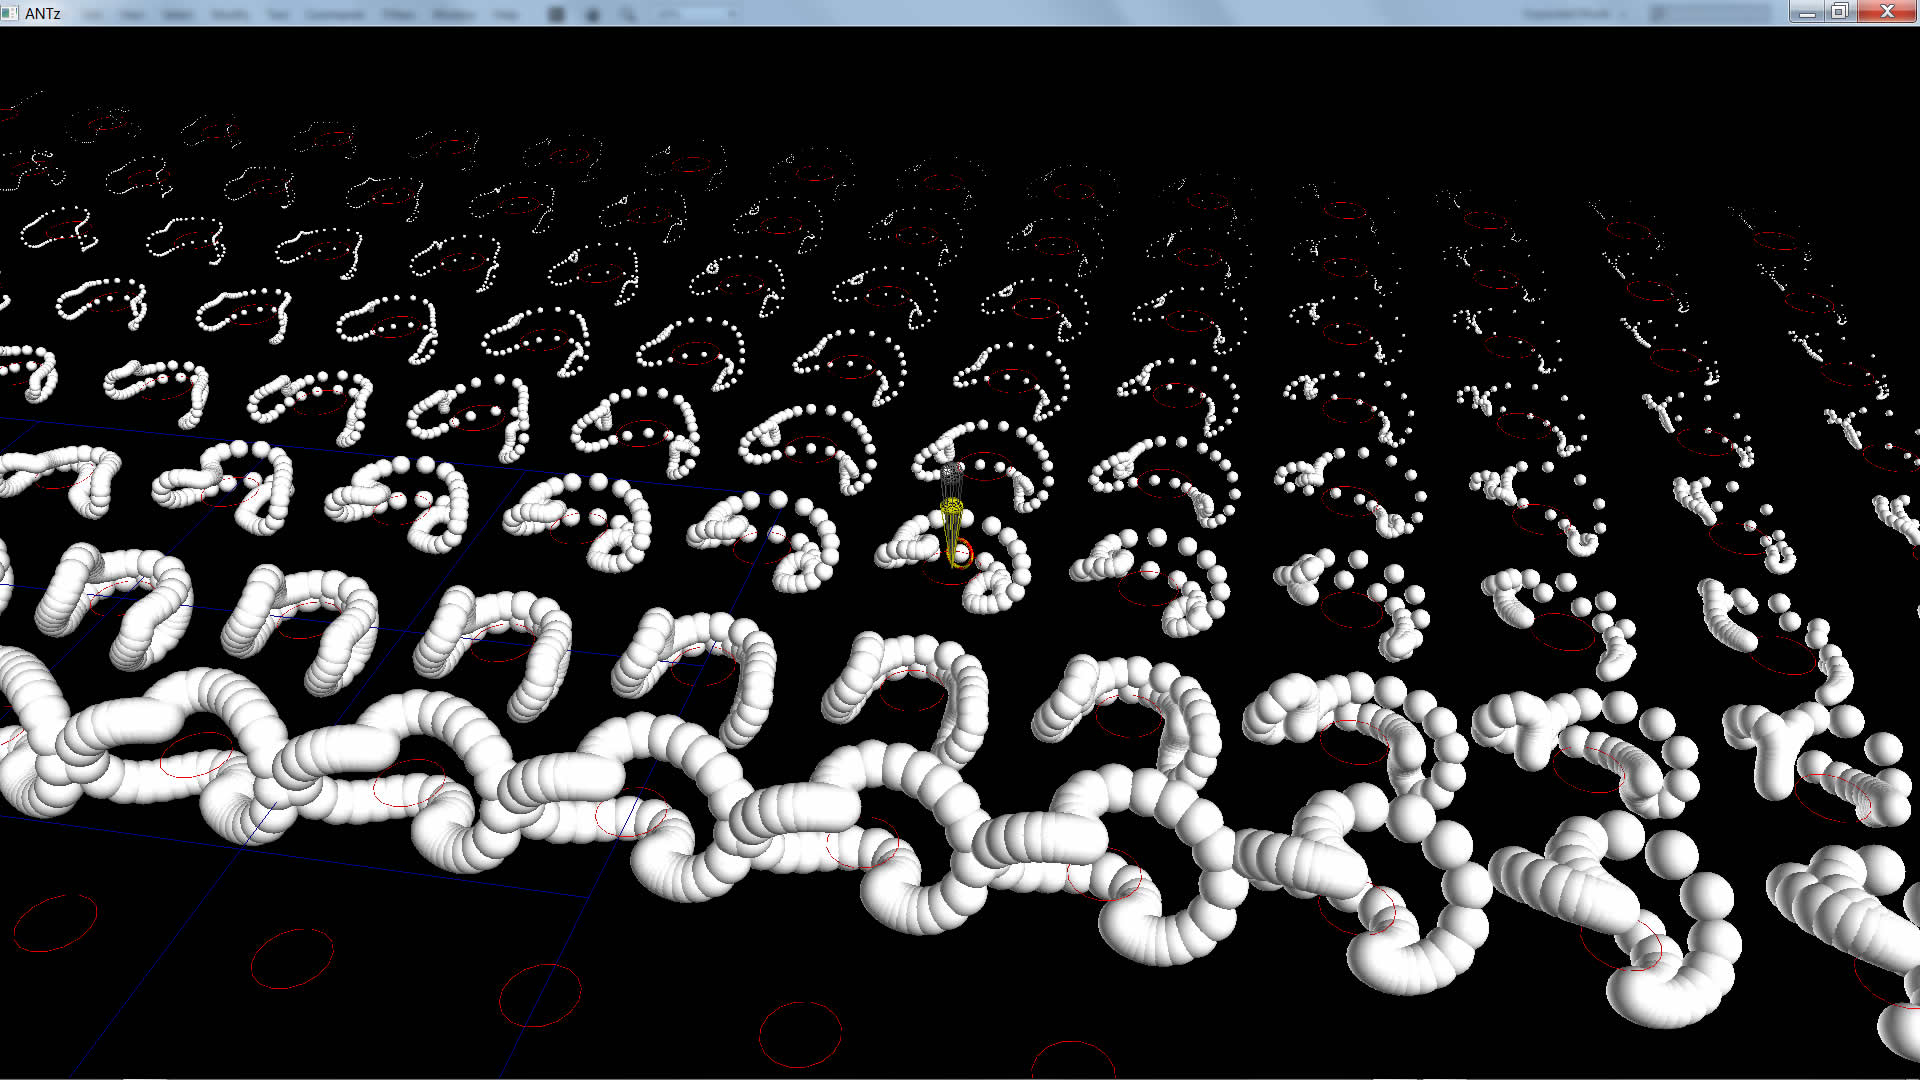
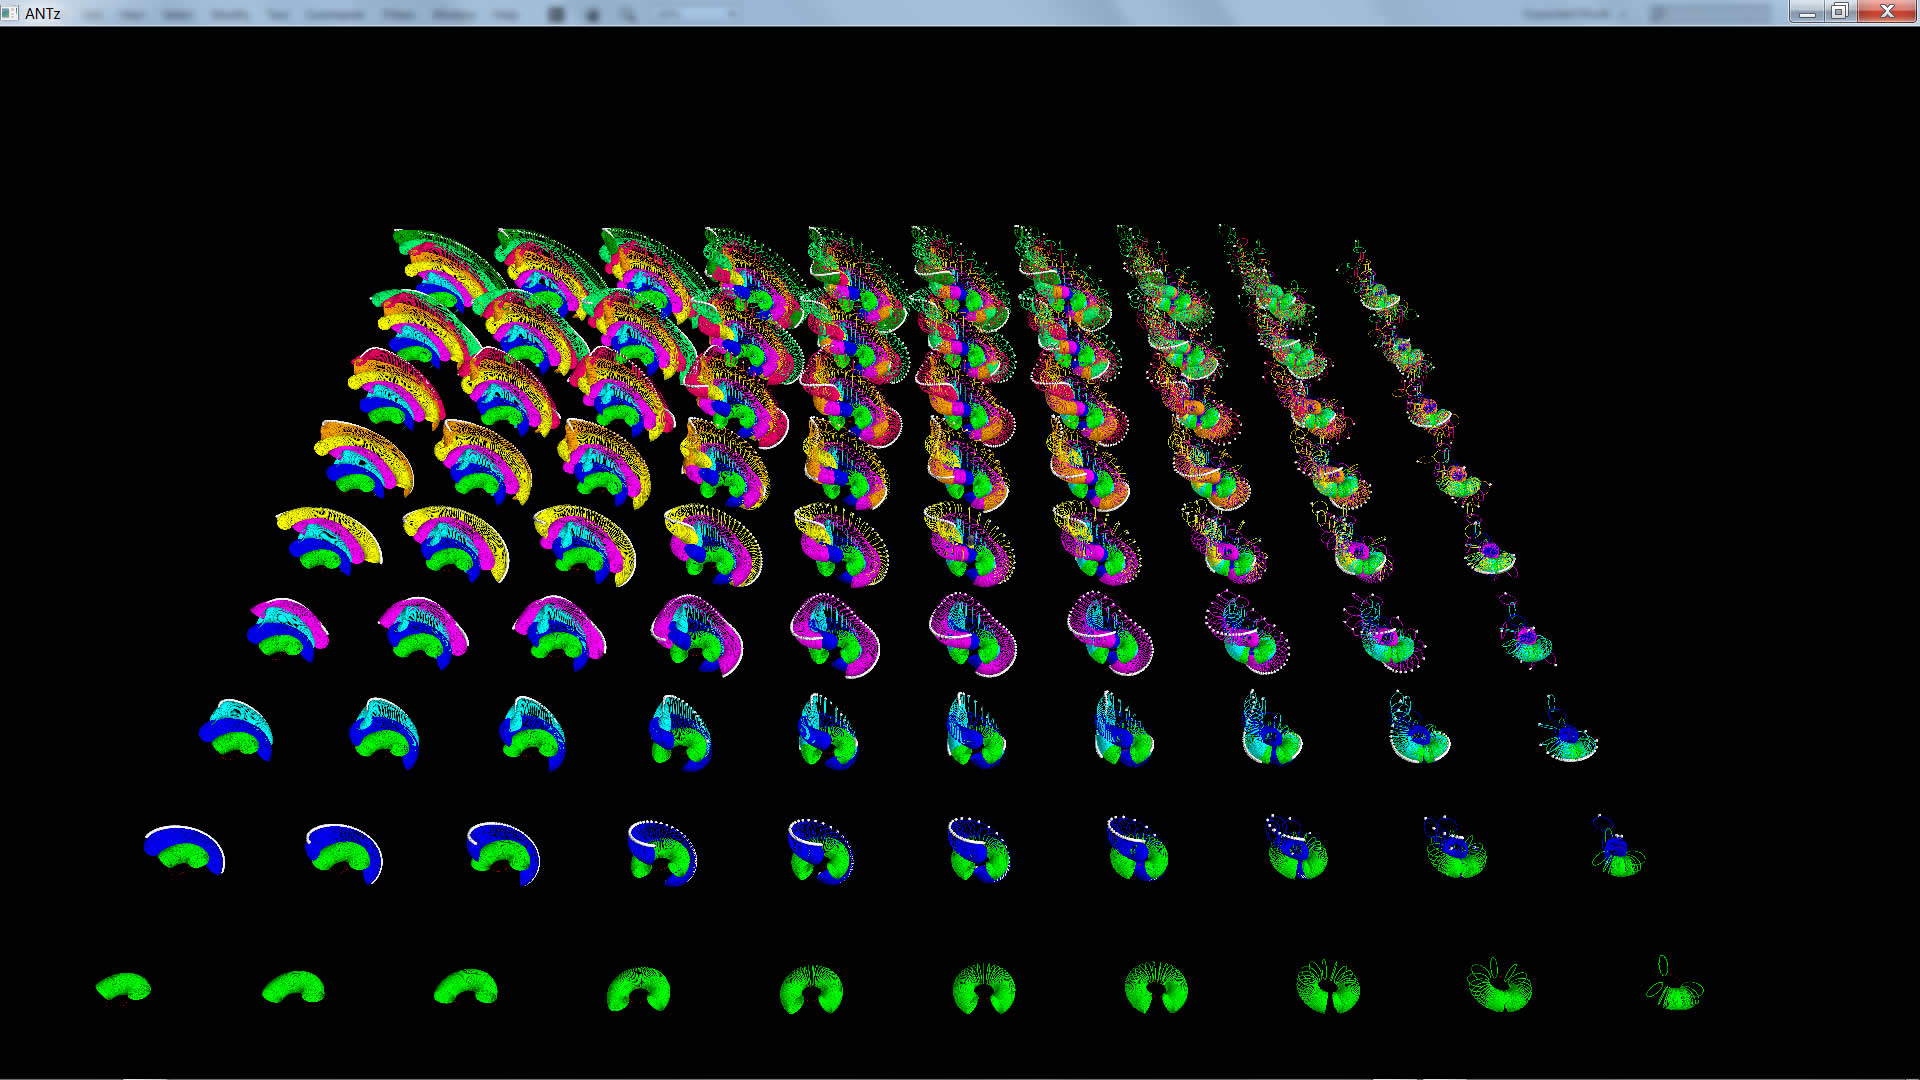
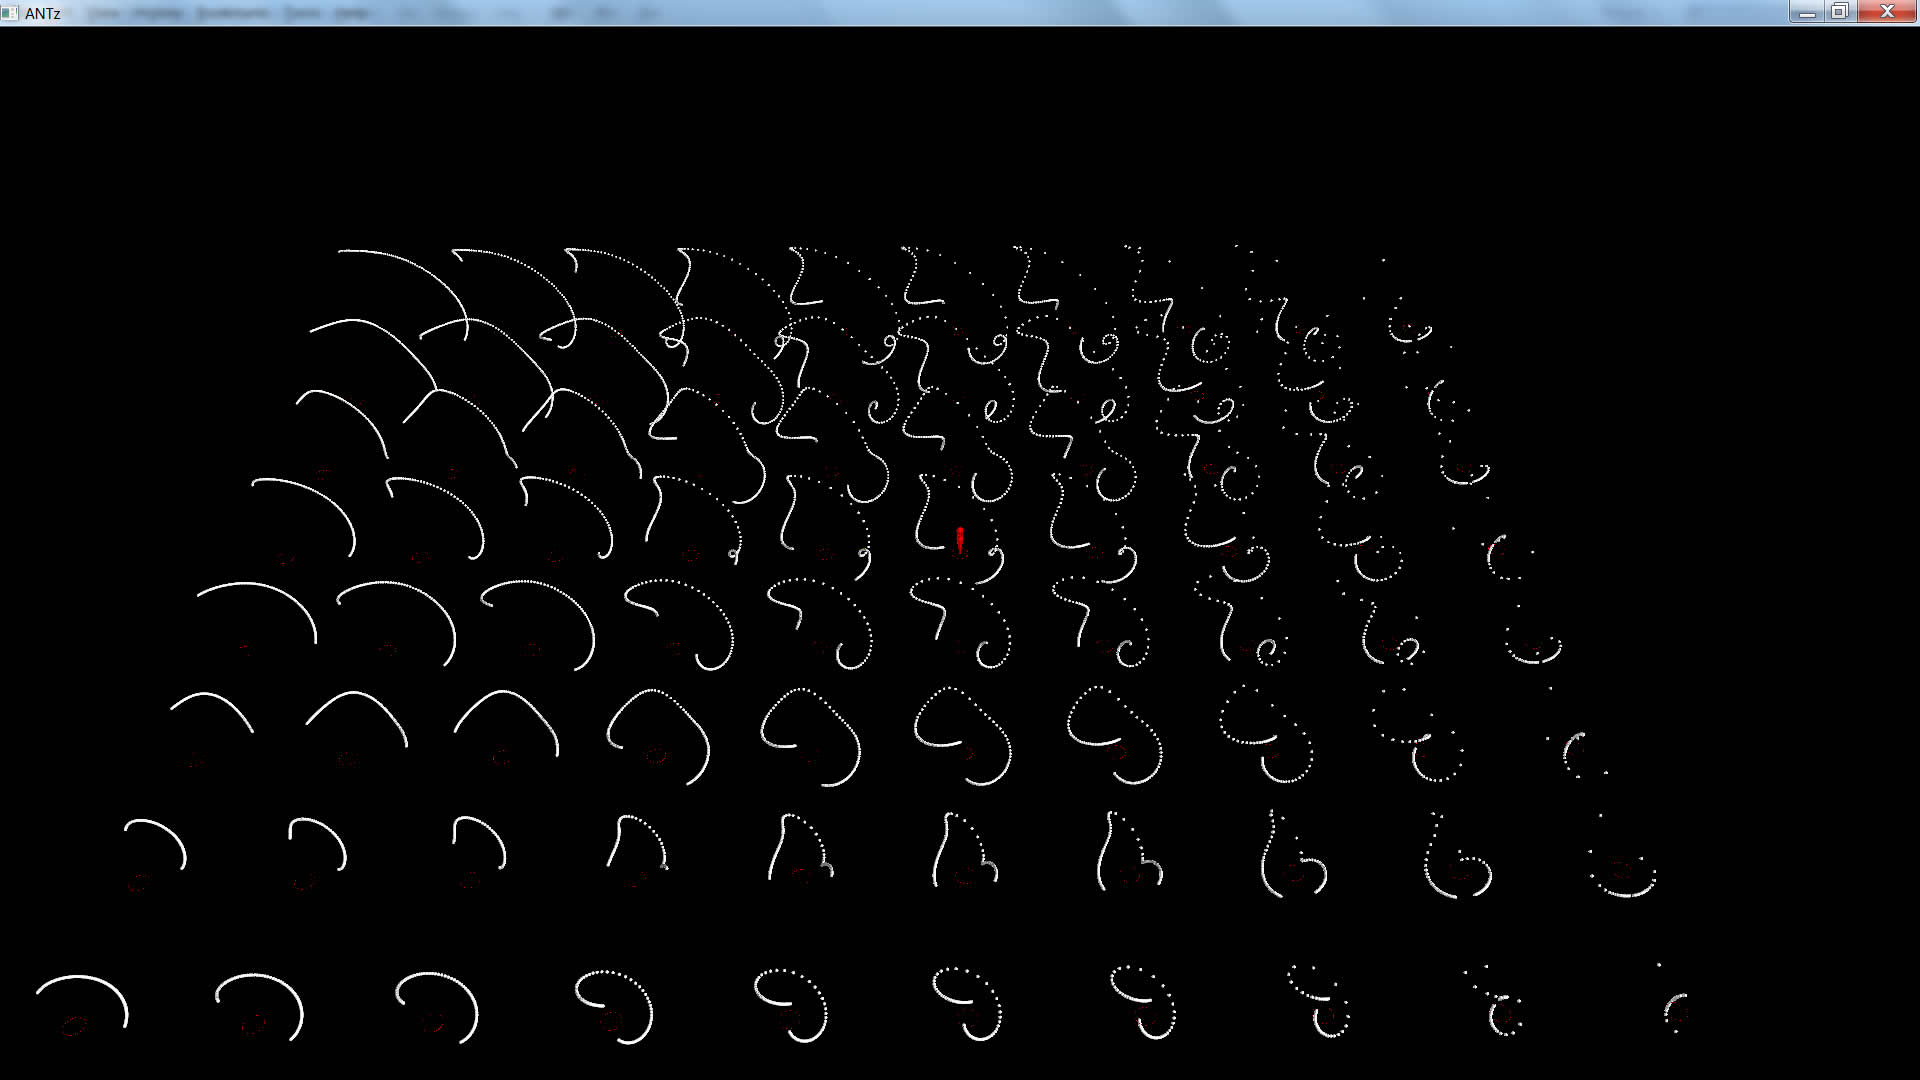
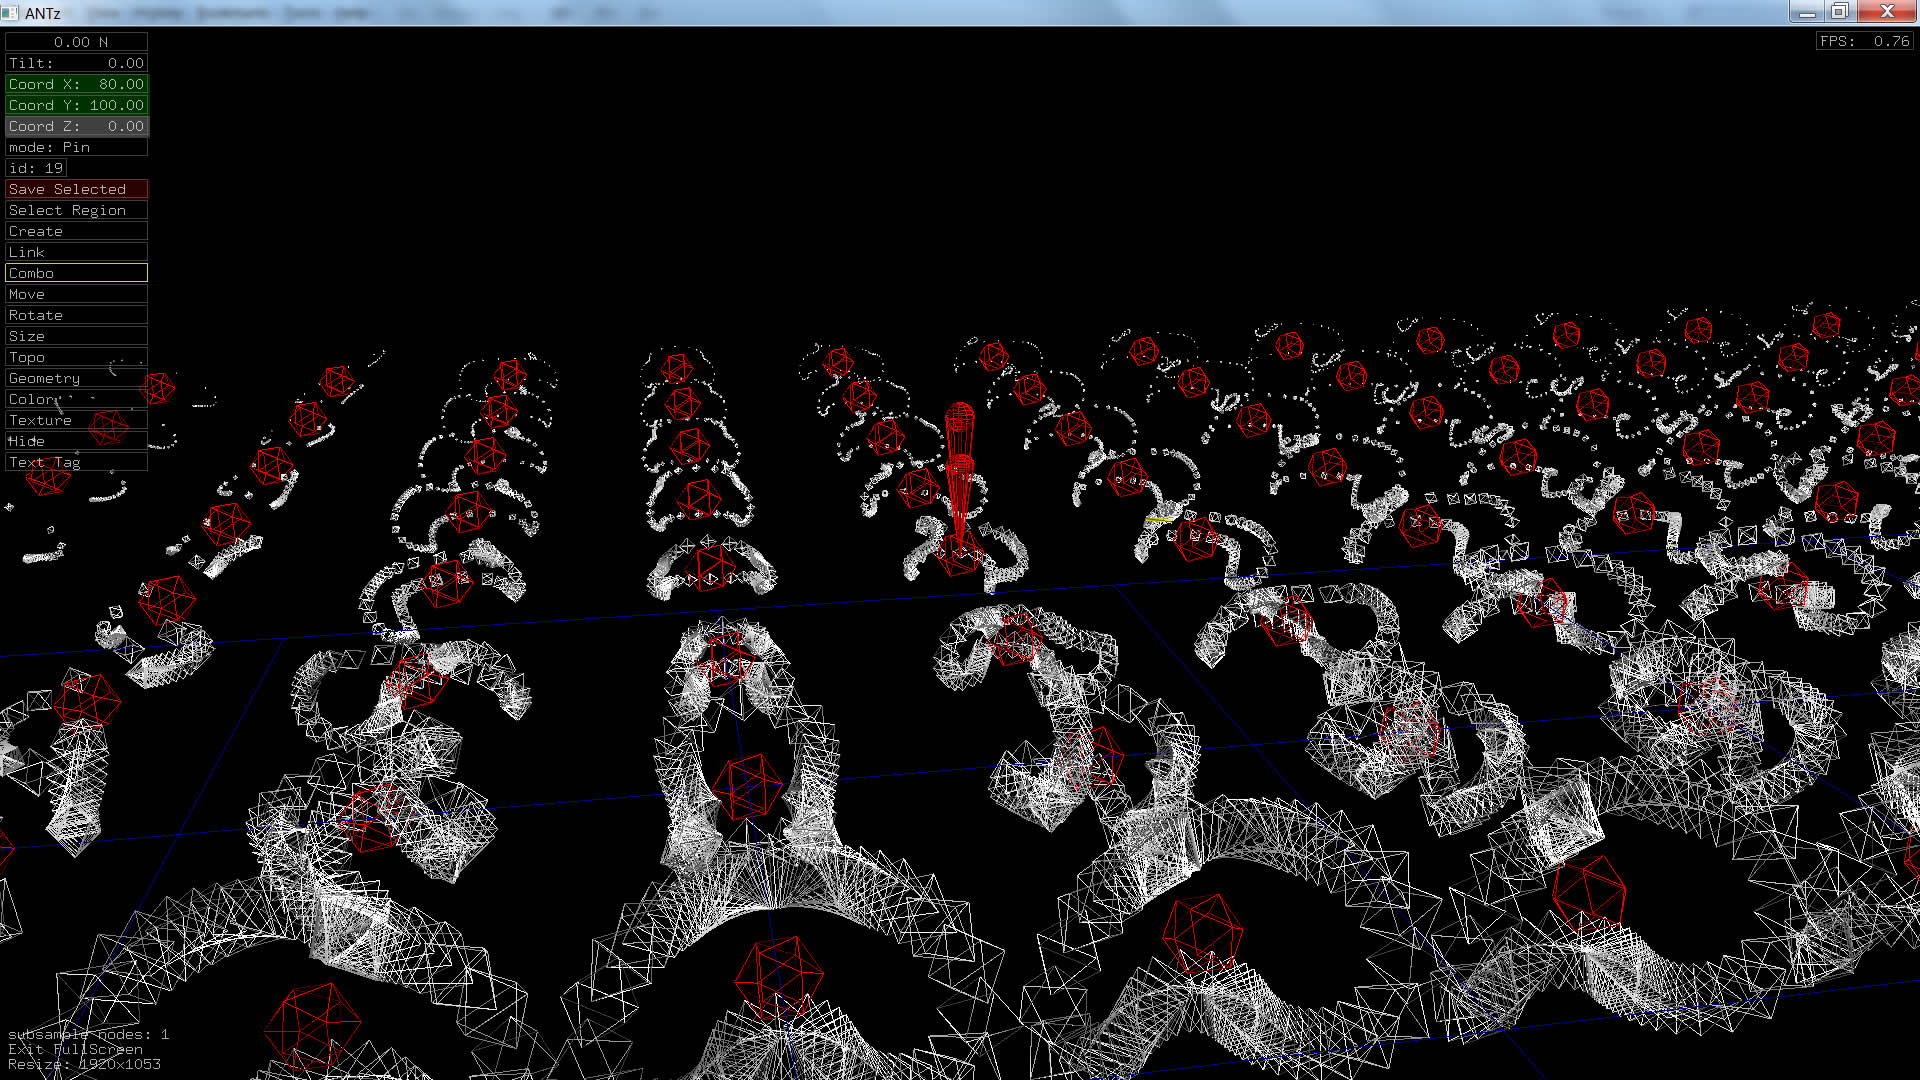
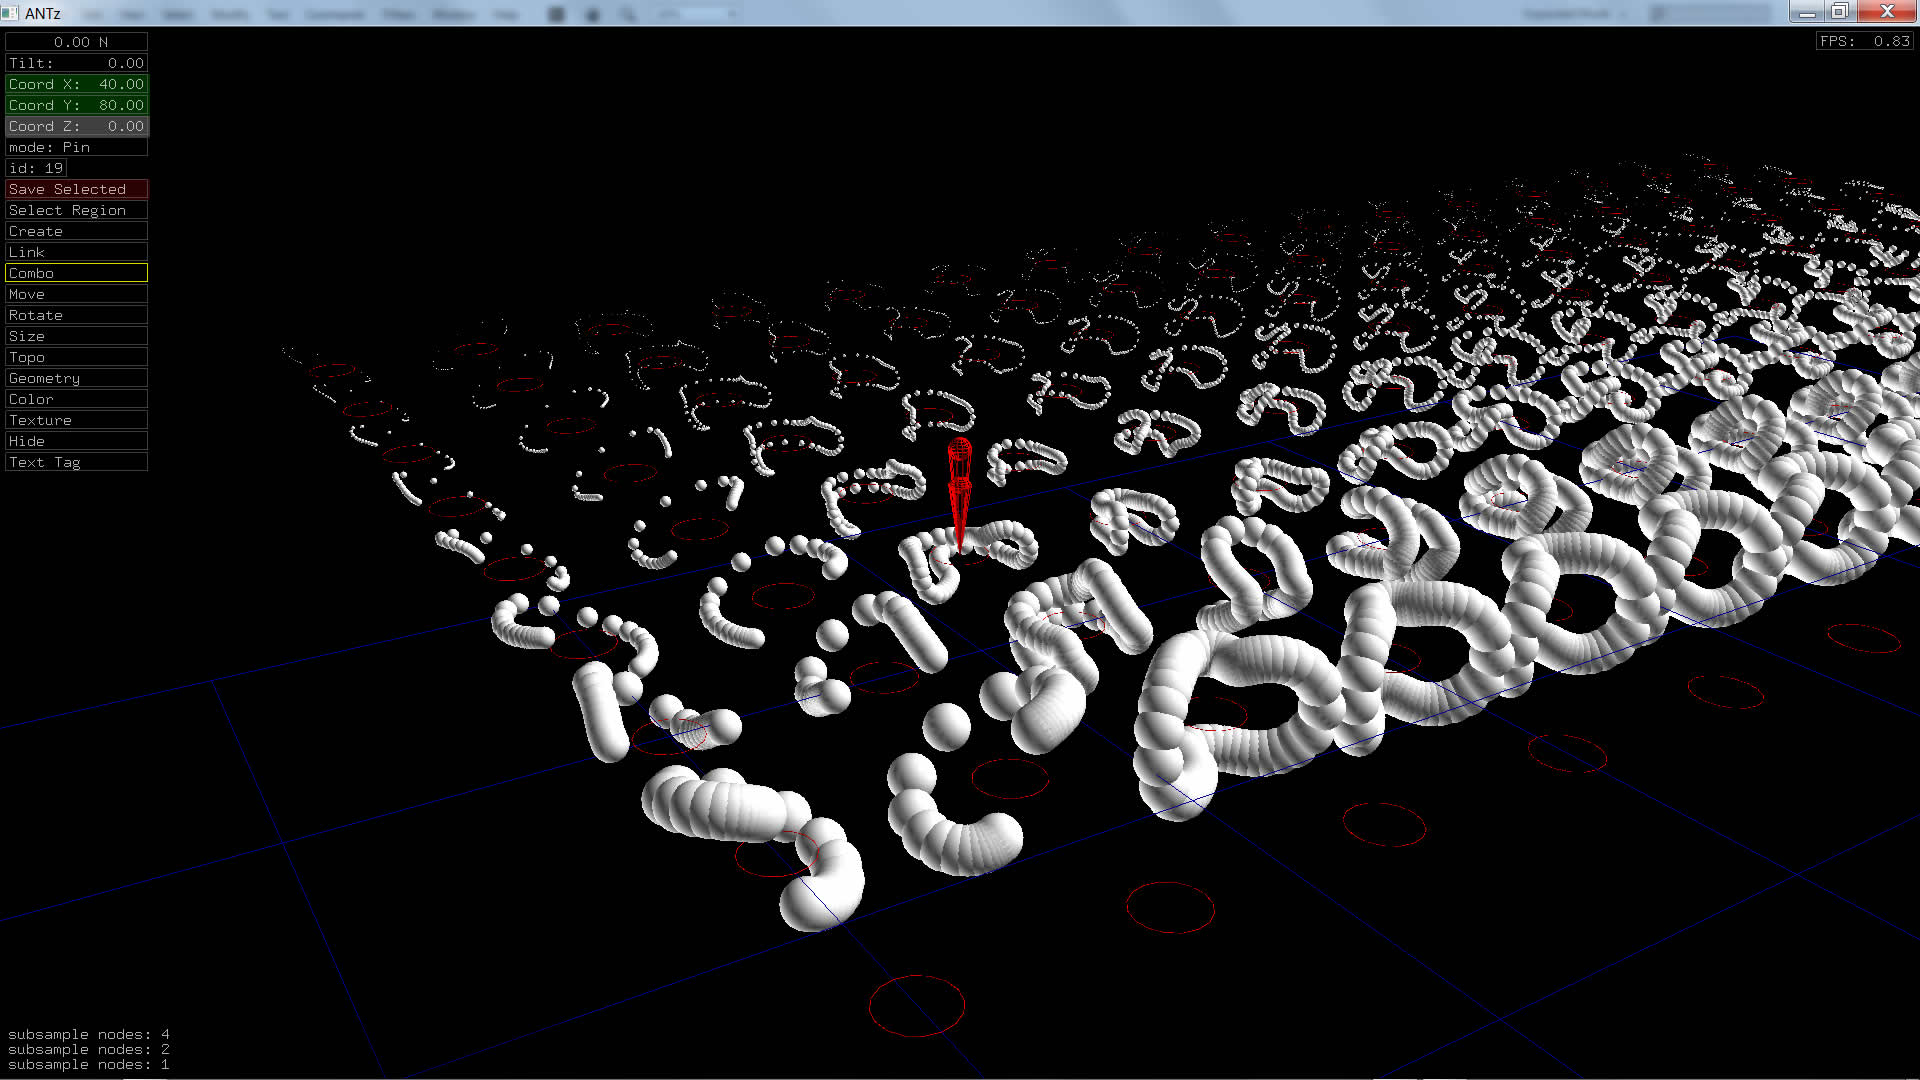
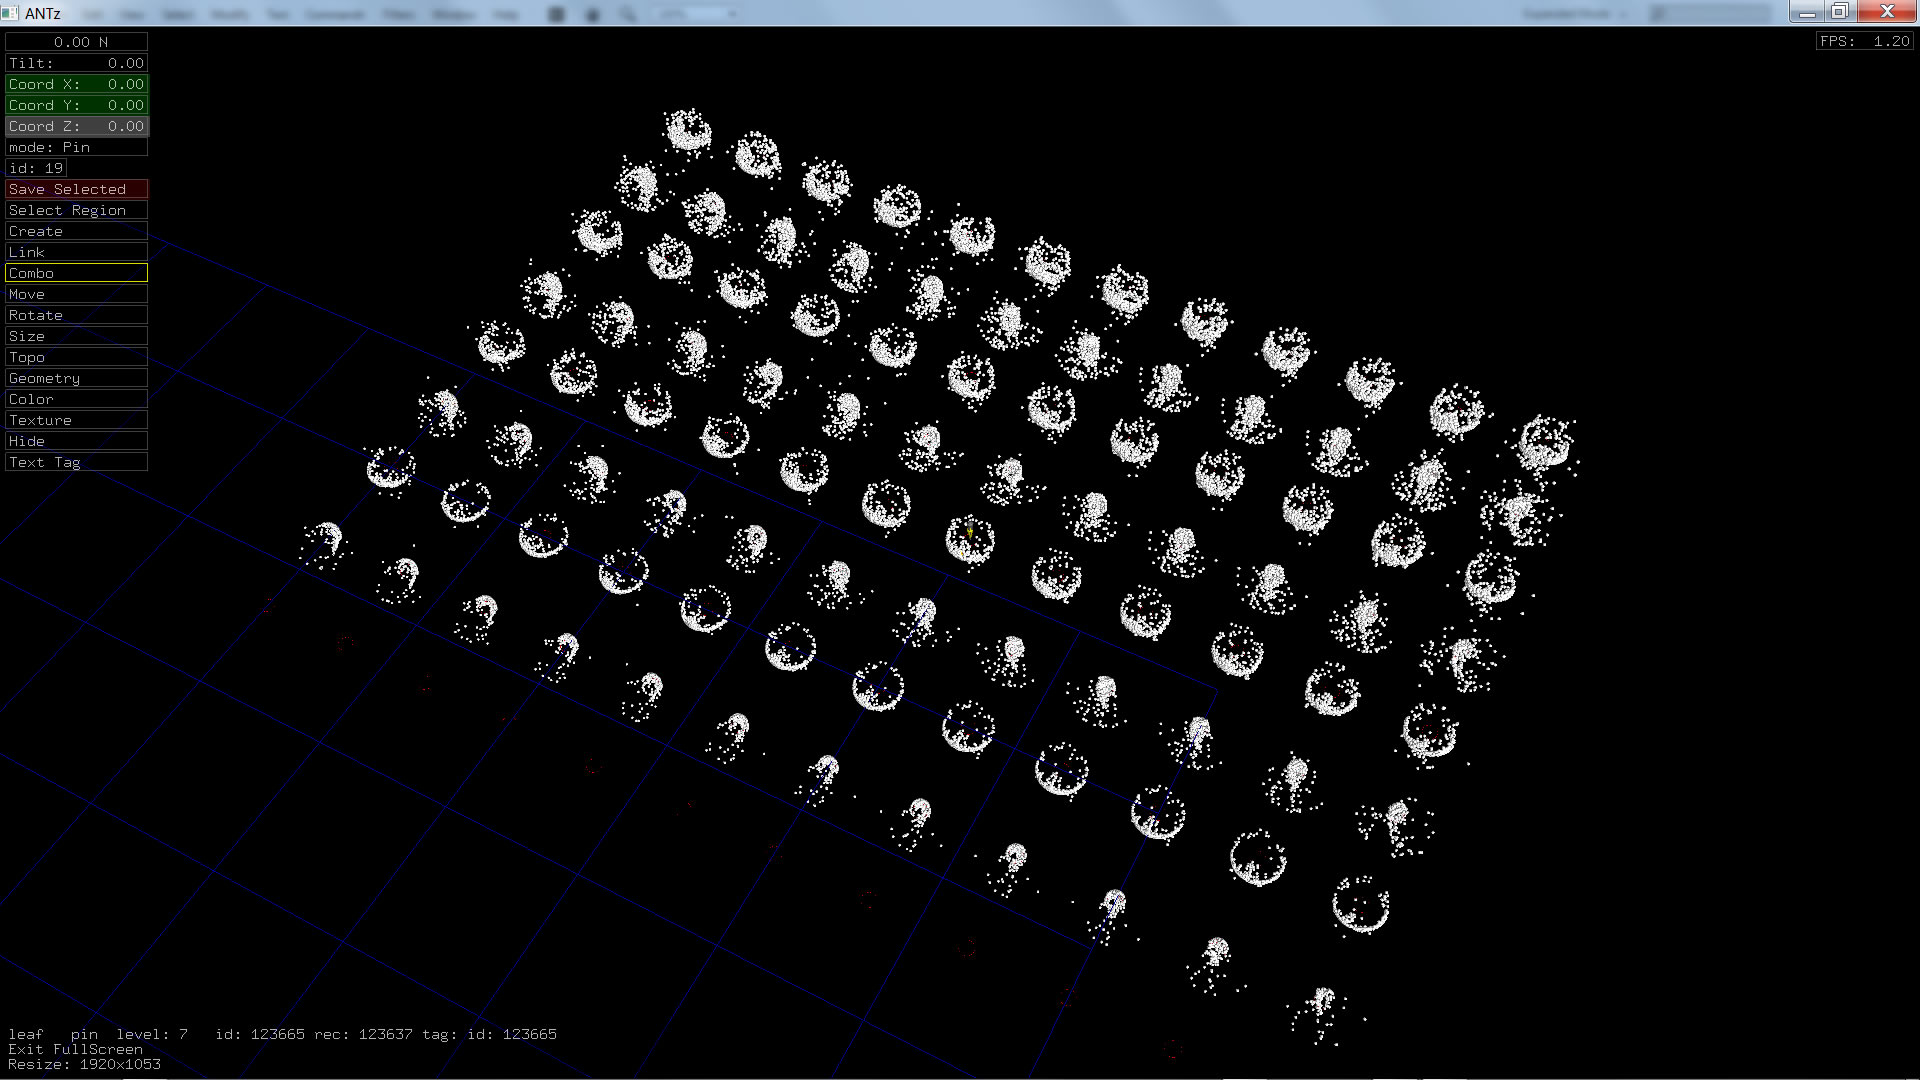
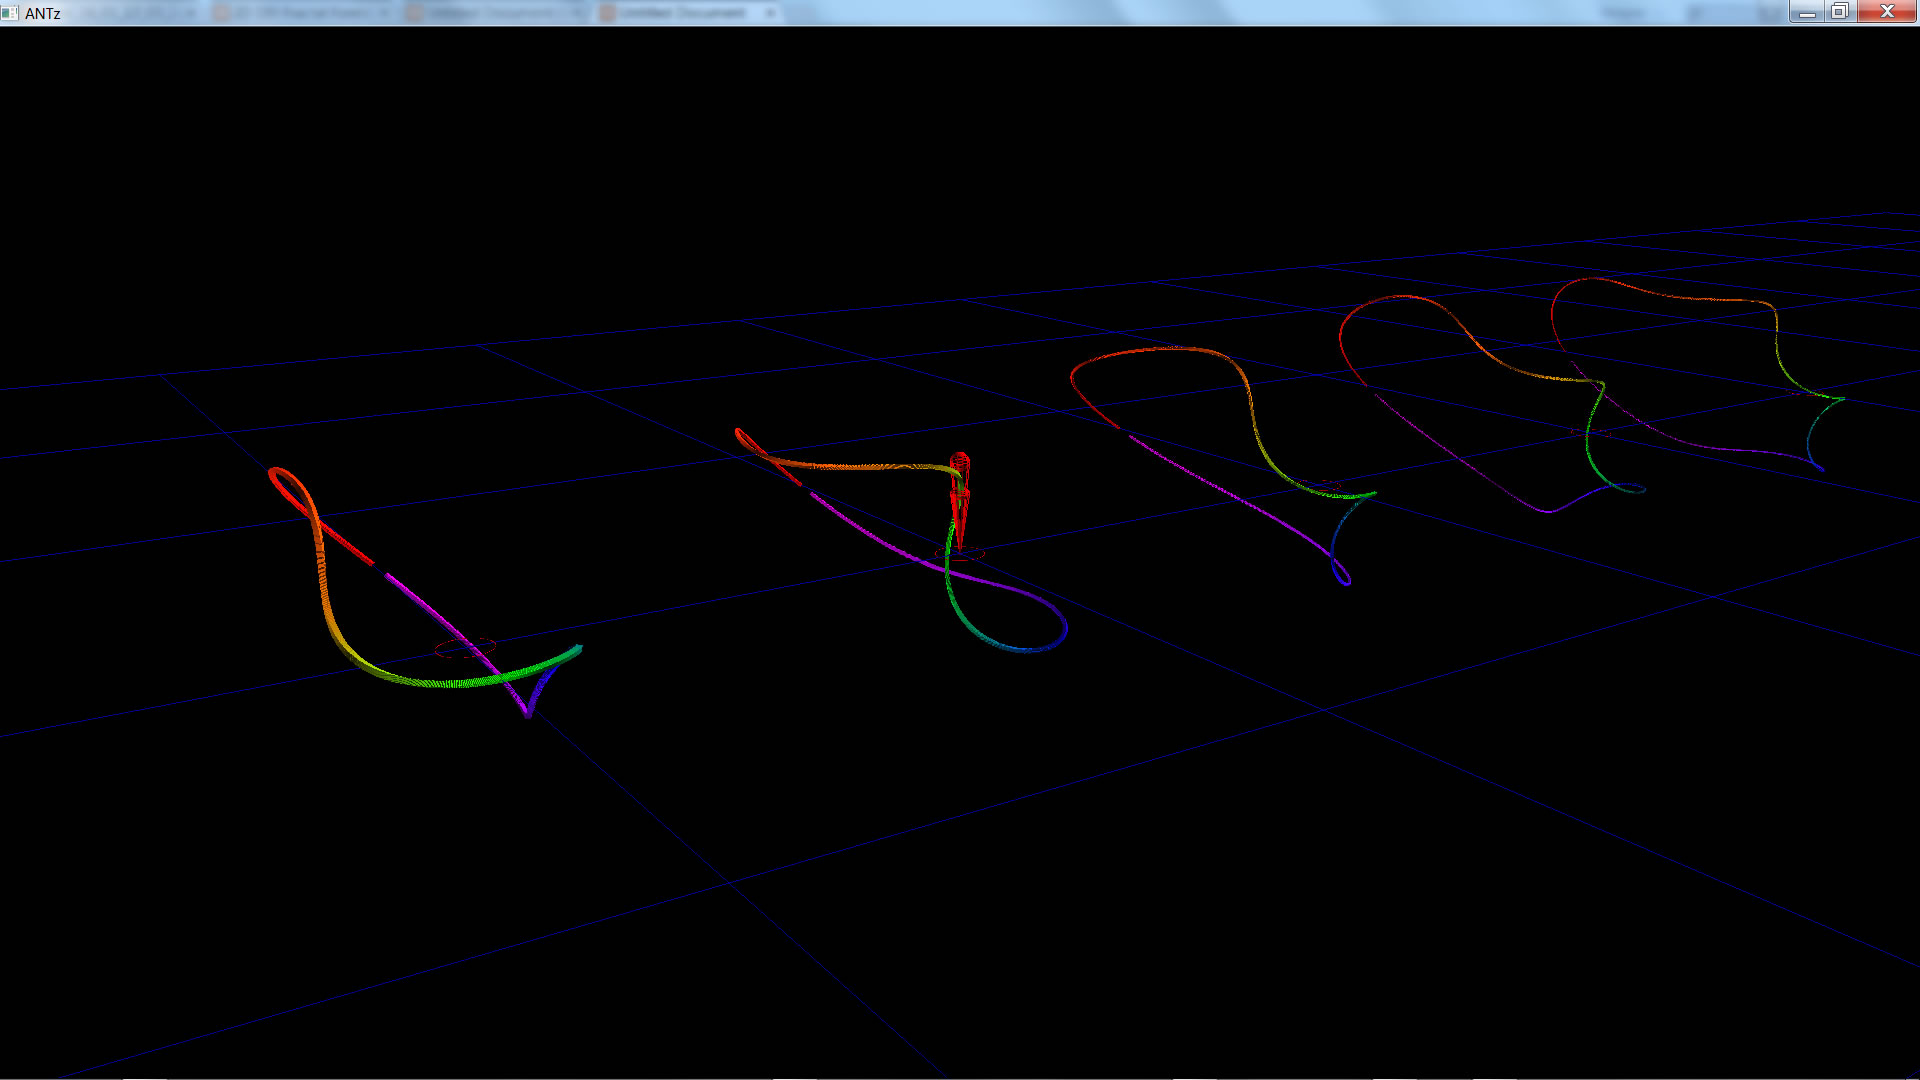
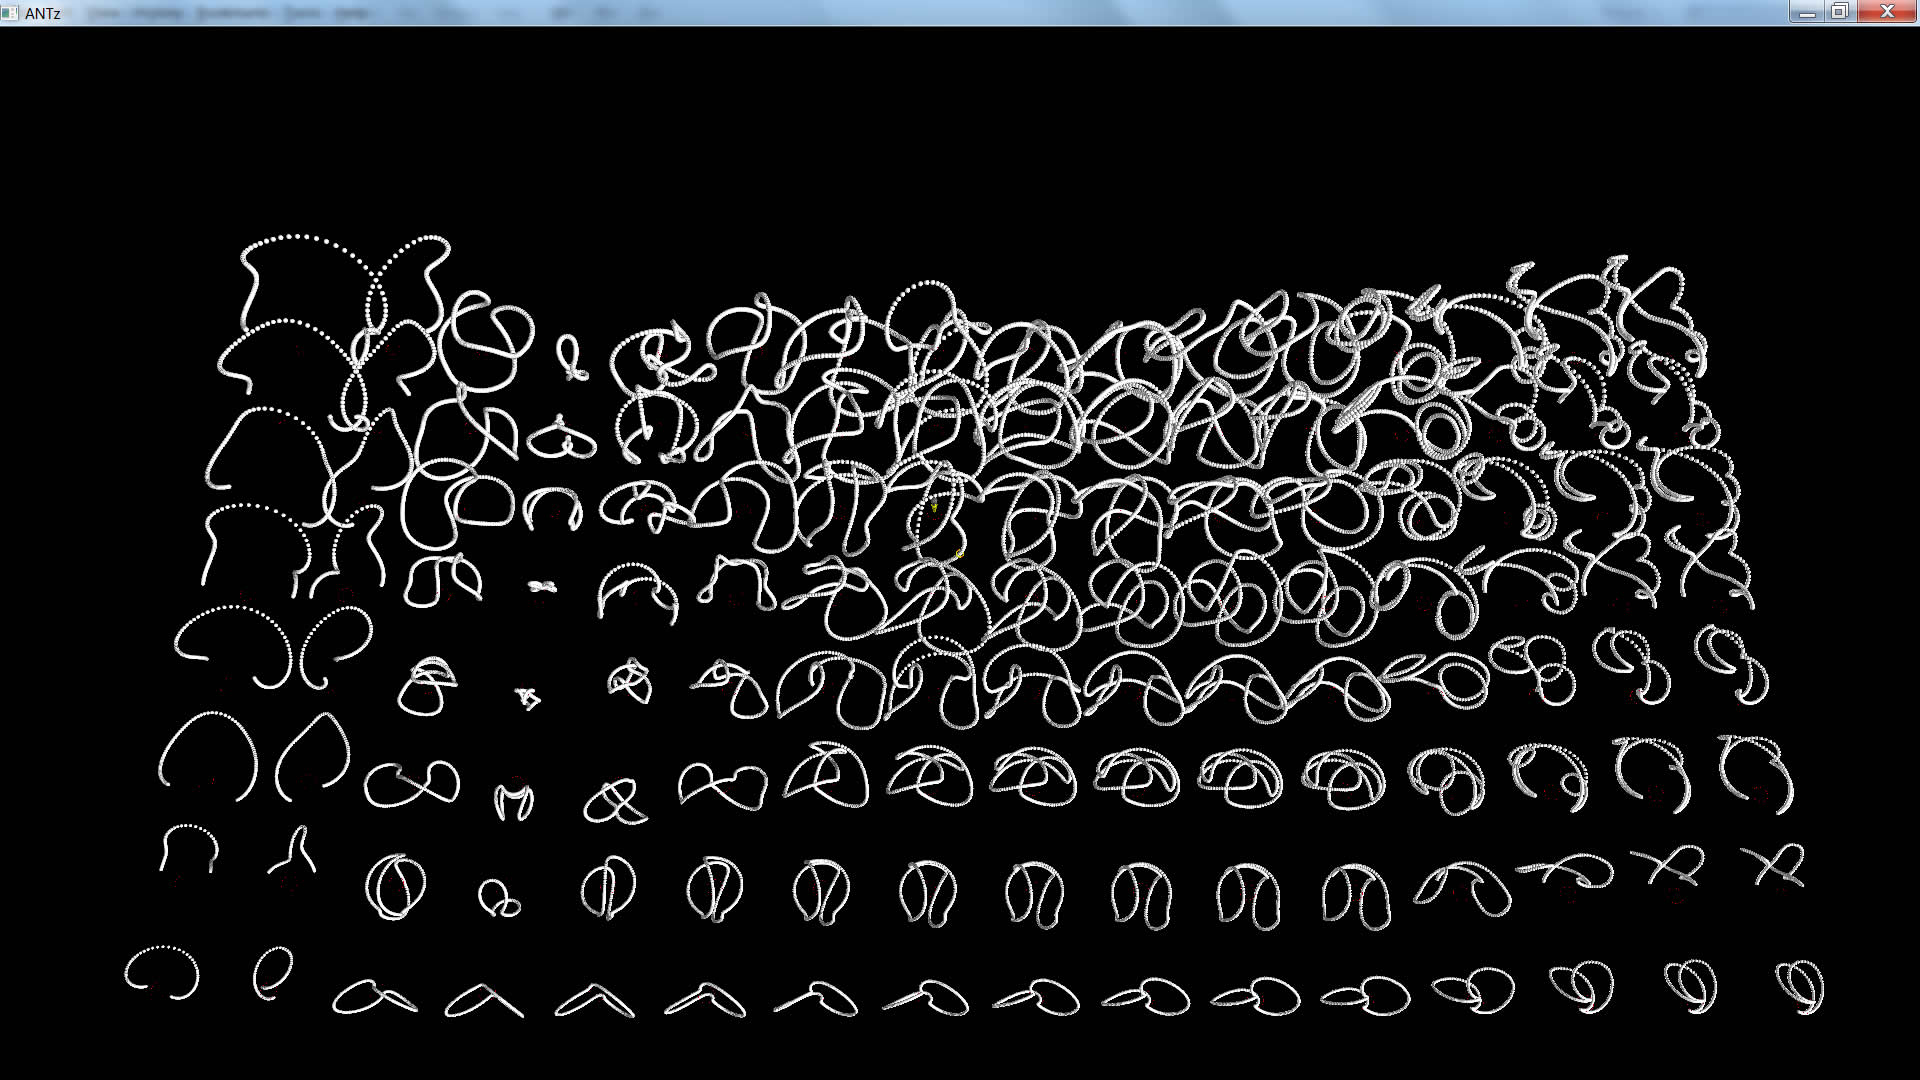
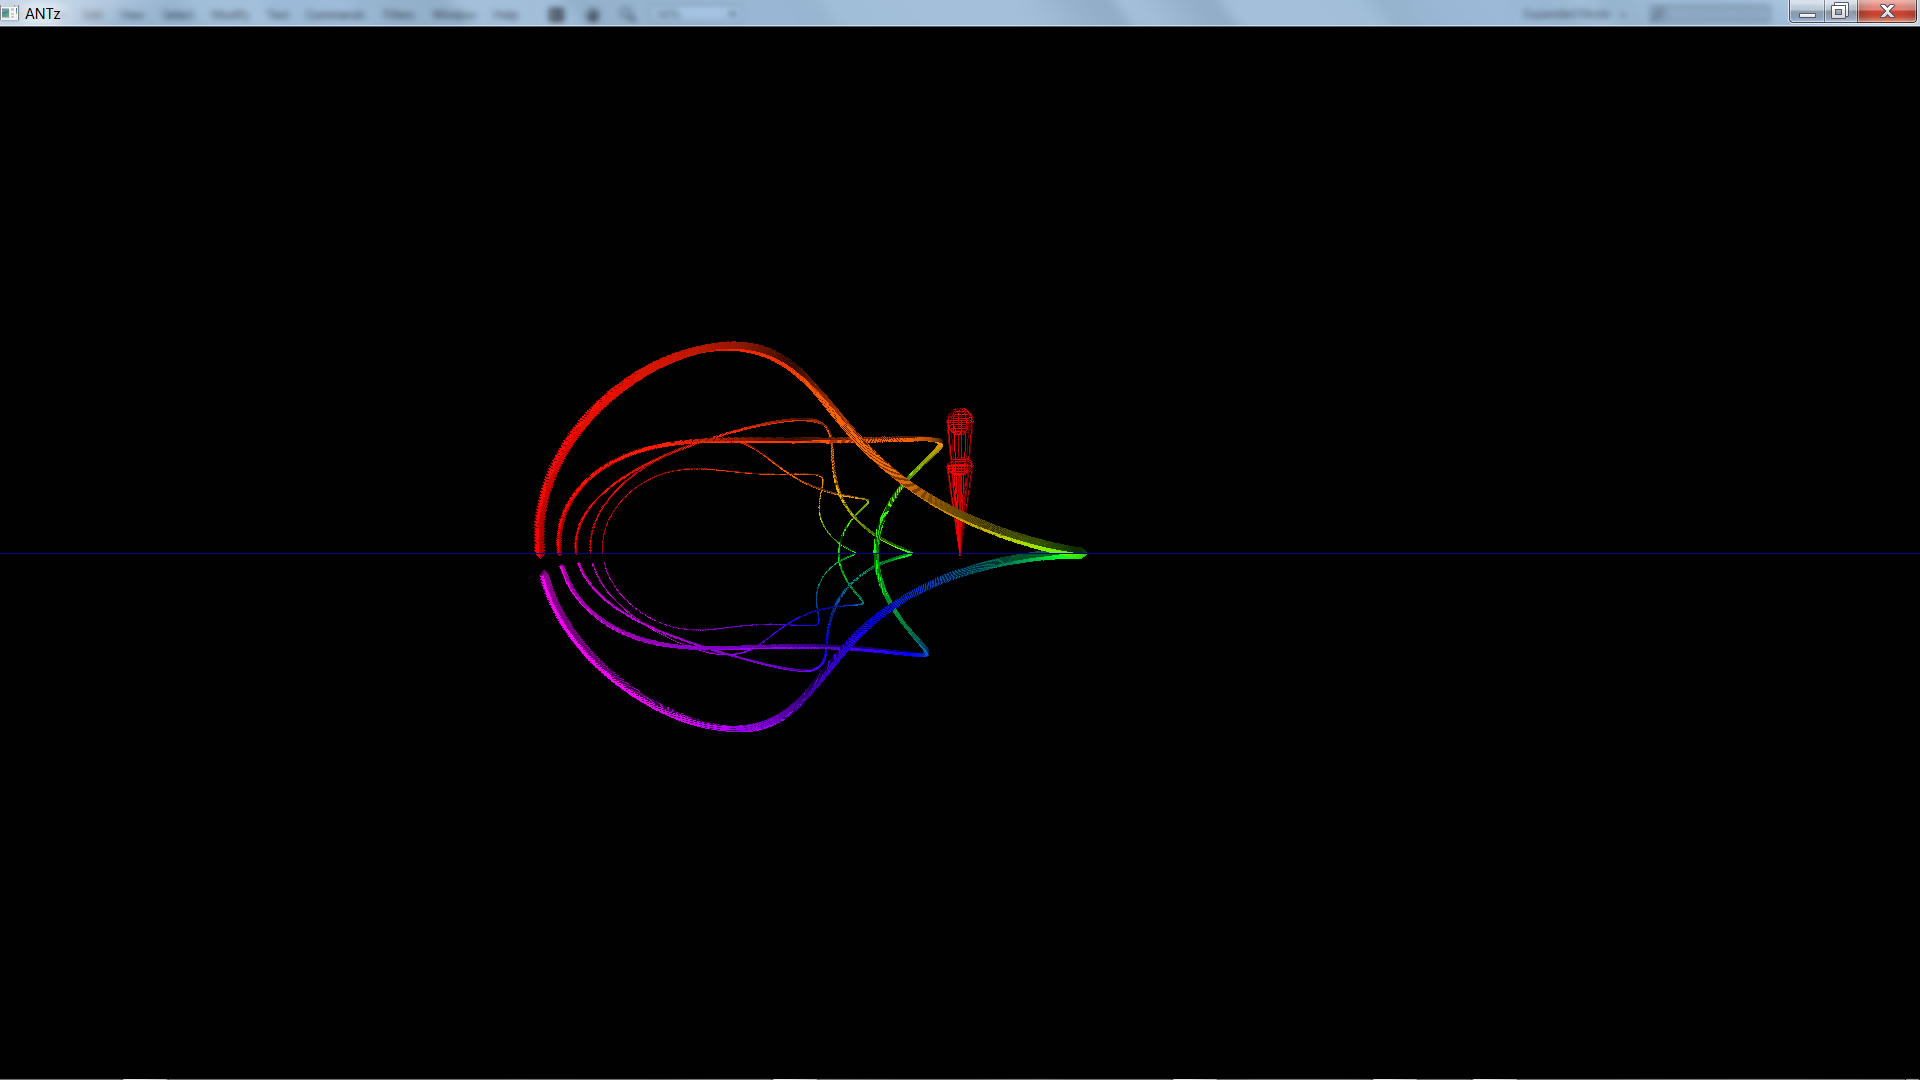
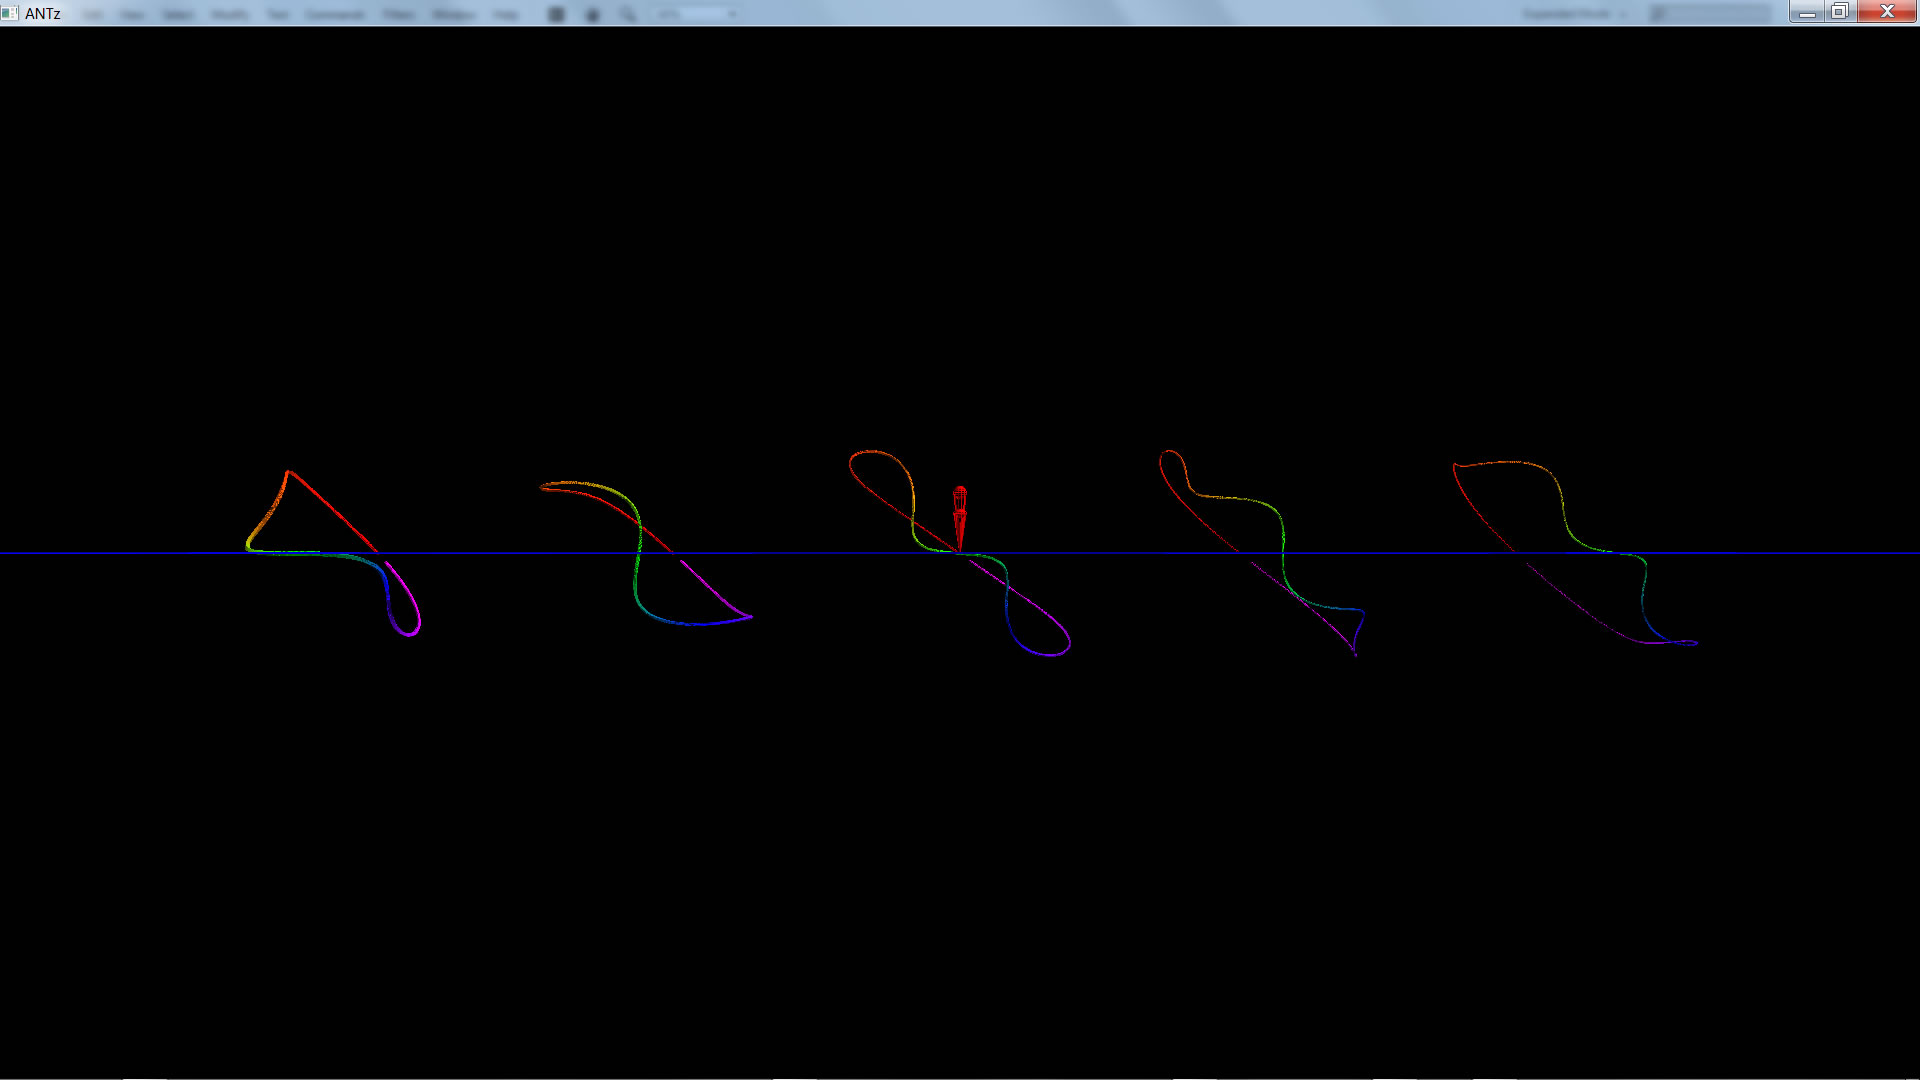
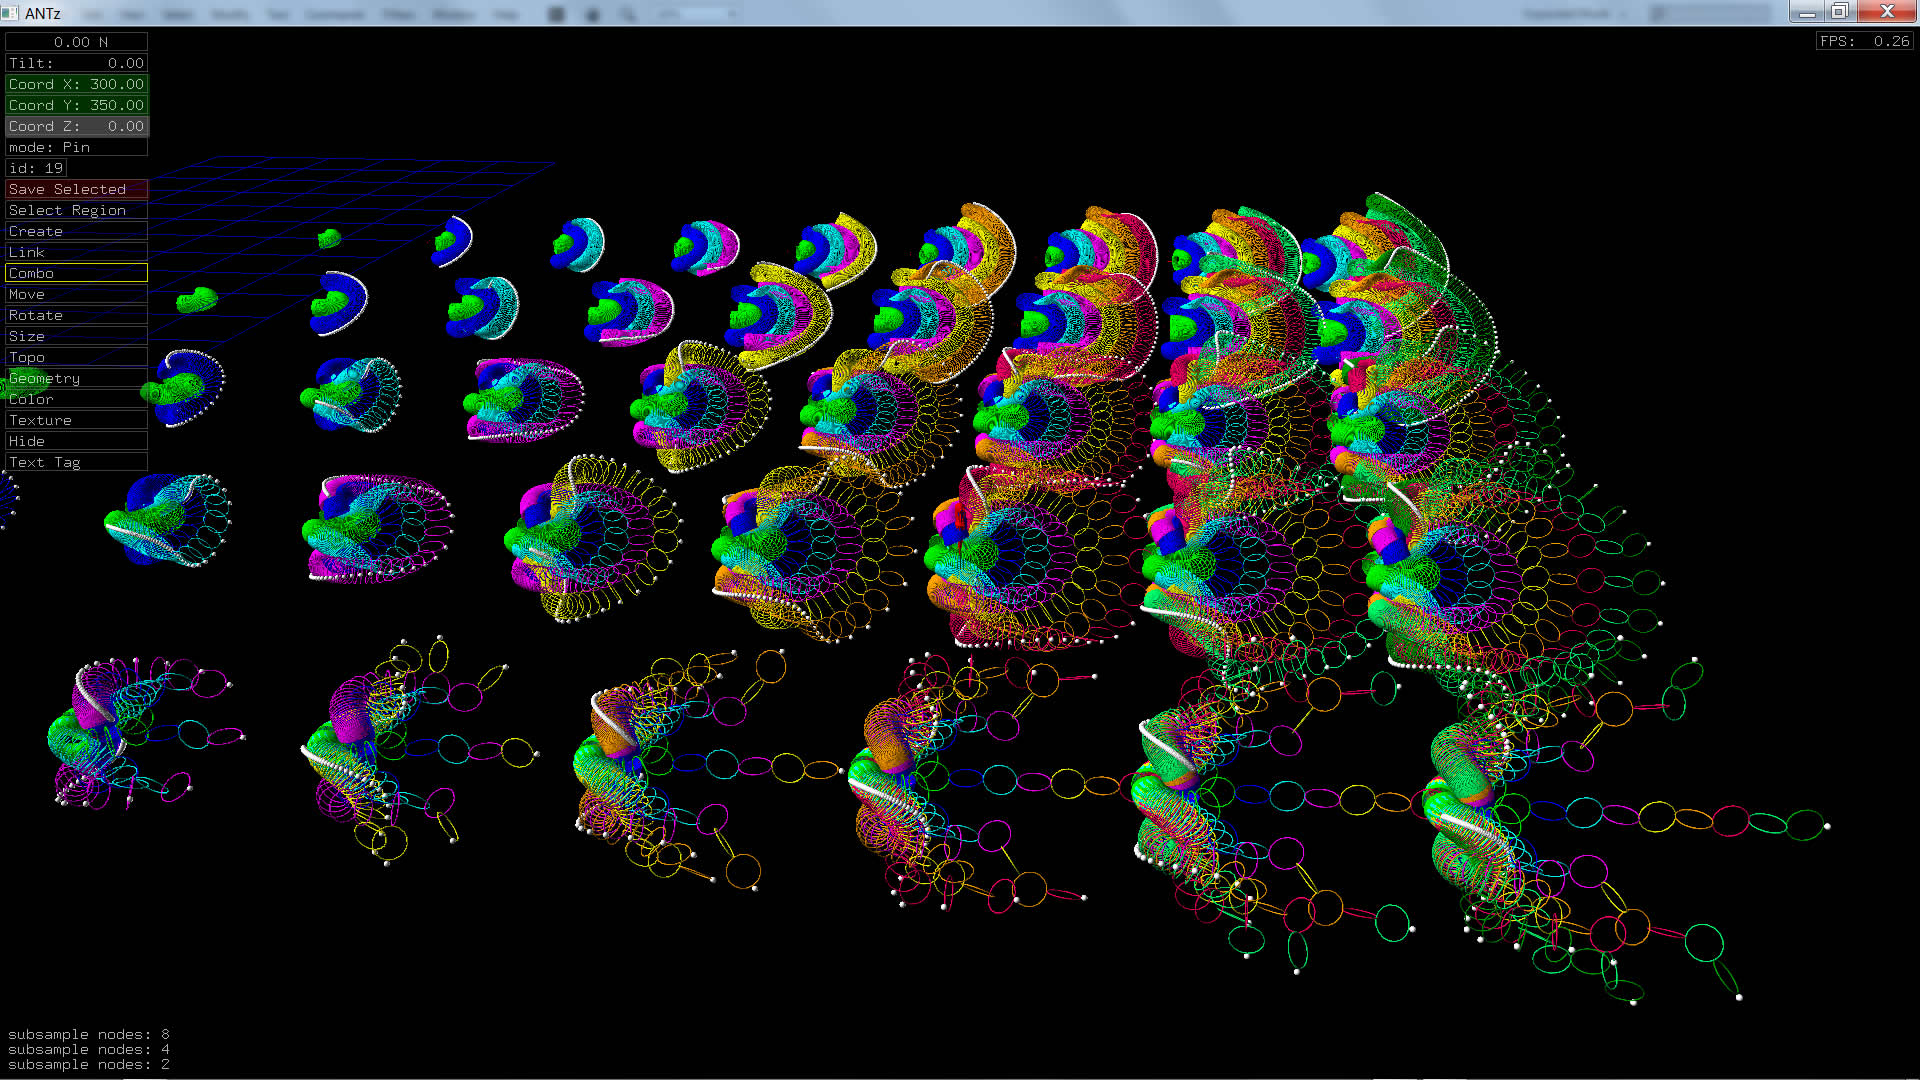
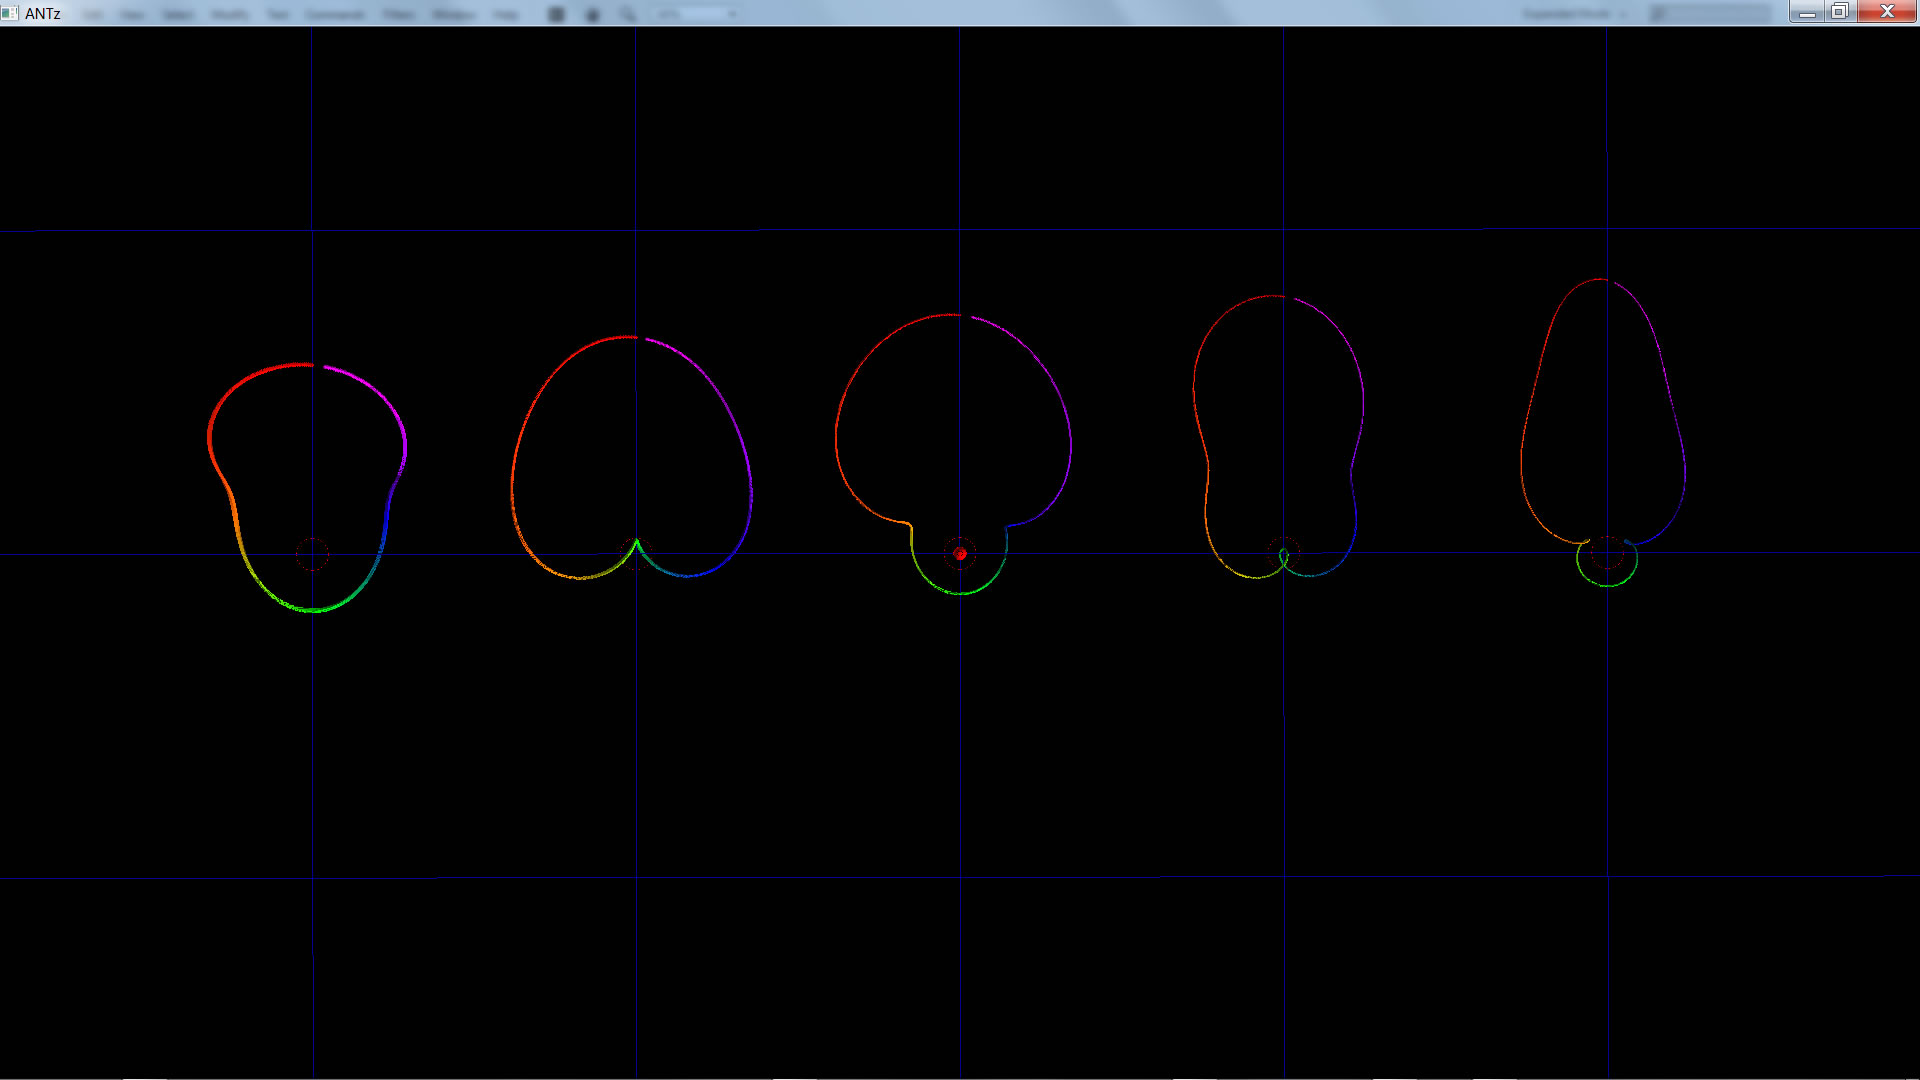
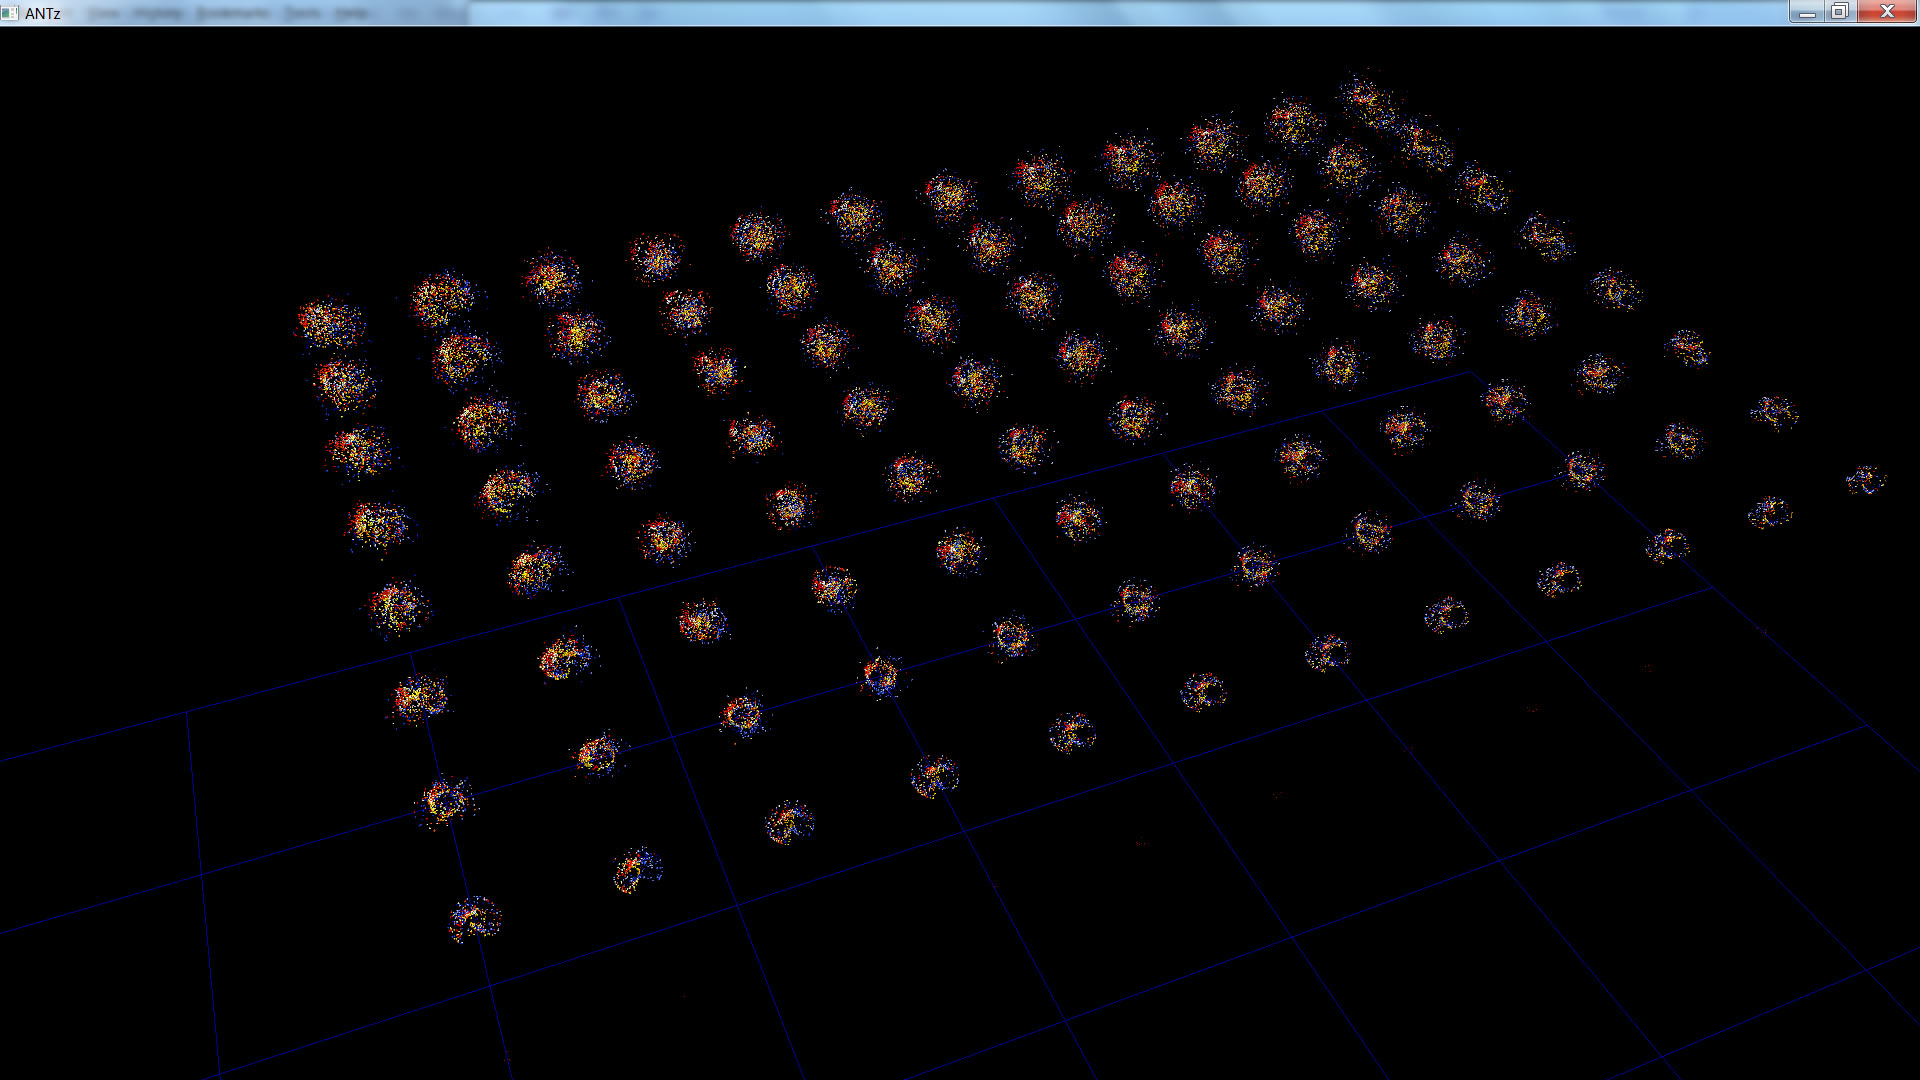
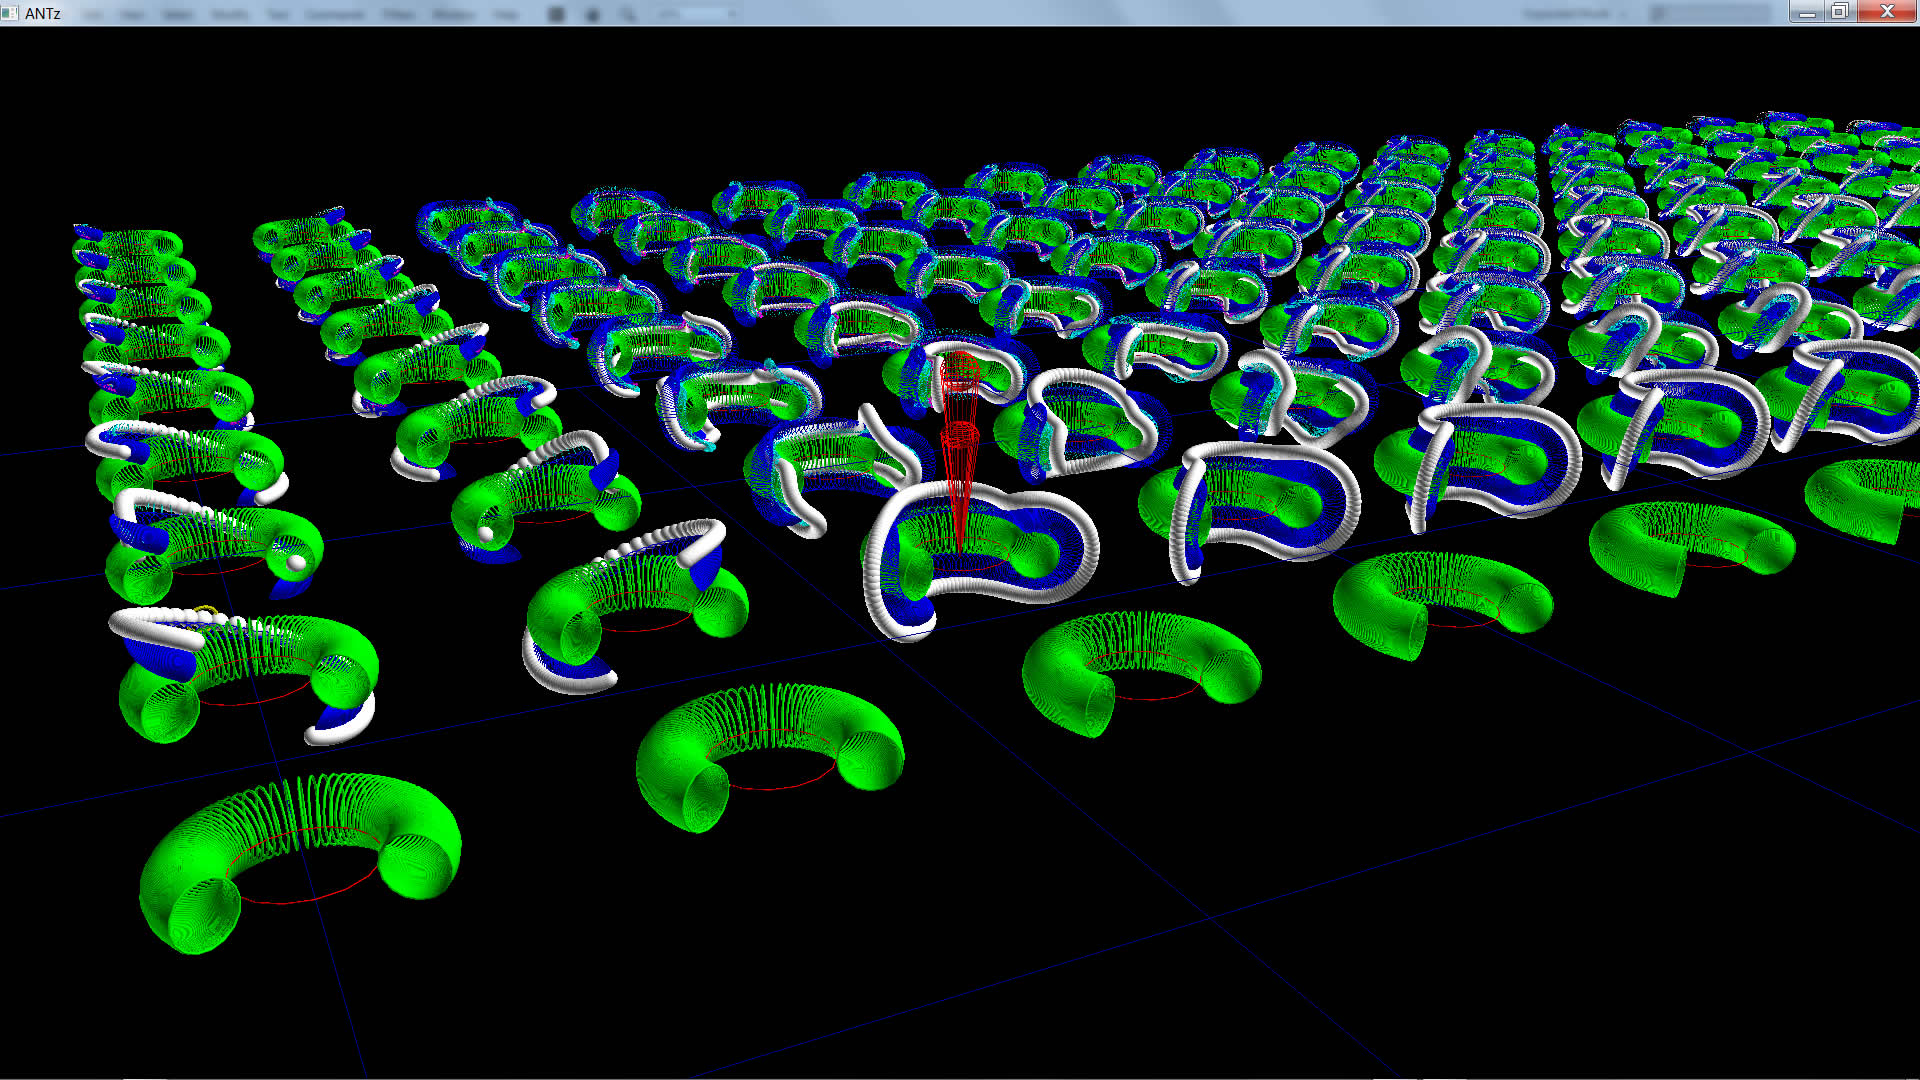
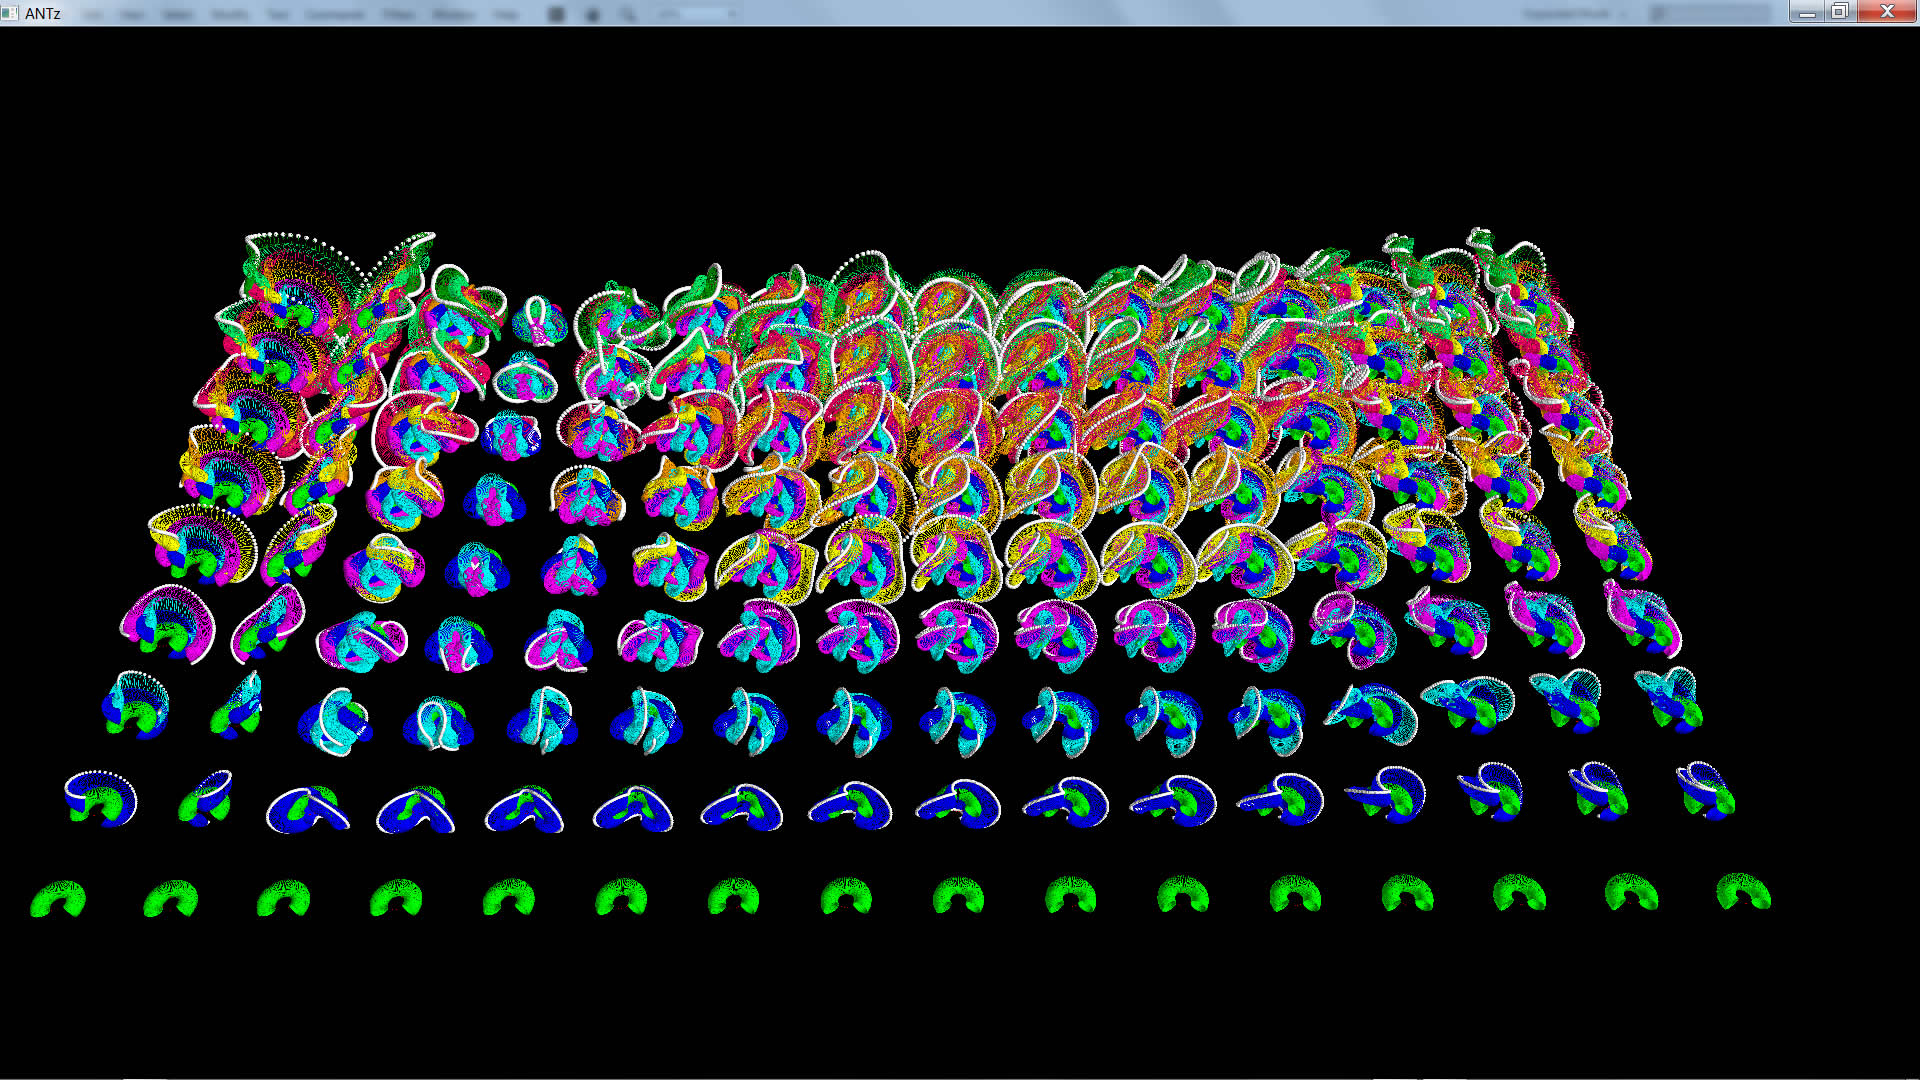
The images below are actually two different ways to render a sin wave in higher dimensions, 1) by rendering the sin wave equally across all dimensions, and 2) by embedding the sin wave using a lagged phase space approach. I have done a parameter sweep of variables including # of dimensions, wave magnitude, and phase lag. I will elaborate further, label axes, create legends, etc. as time permits. Enjoy for now.
Download Embedded Sin Wave rendered in 10 dimensions with varying lag, dimensions hidden. (15 Mb compressed, 180 Mb uncompressed. Open this file if your computer is slow since it only actually renders the final time series objects and not the hyperdimension toroids used to create them.)
Download Embedded Sin Wave rendered in 10 dimensions with varying lag, dimensions visible. (15 Mb compressed, 180 Mb uncompressed.)