These lessons are designed for anyone interested in learning more about ANTz and Hyperglyphs.
Lesson 1: Introduction to Hyperglyphs
Here we include details of the tutorial agenda, the history of glyphs and the concept of a hyperglyph in preparation for some hands-on experience.
Go to Lesson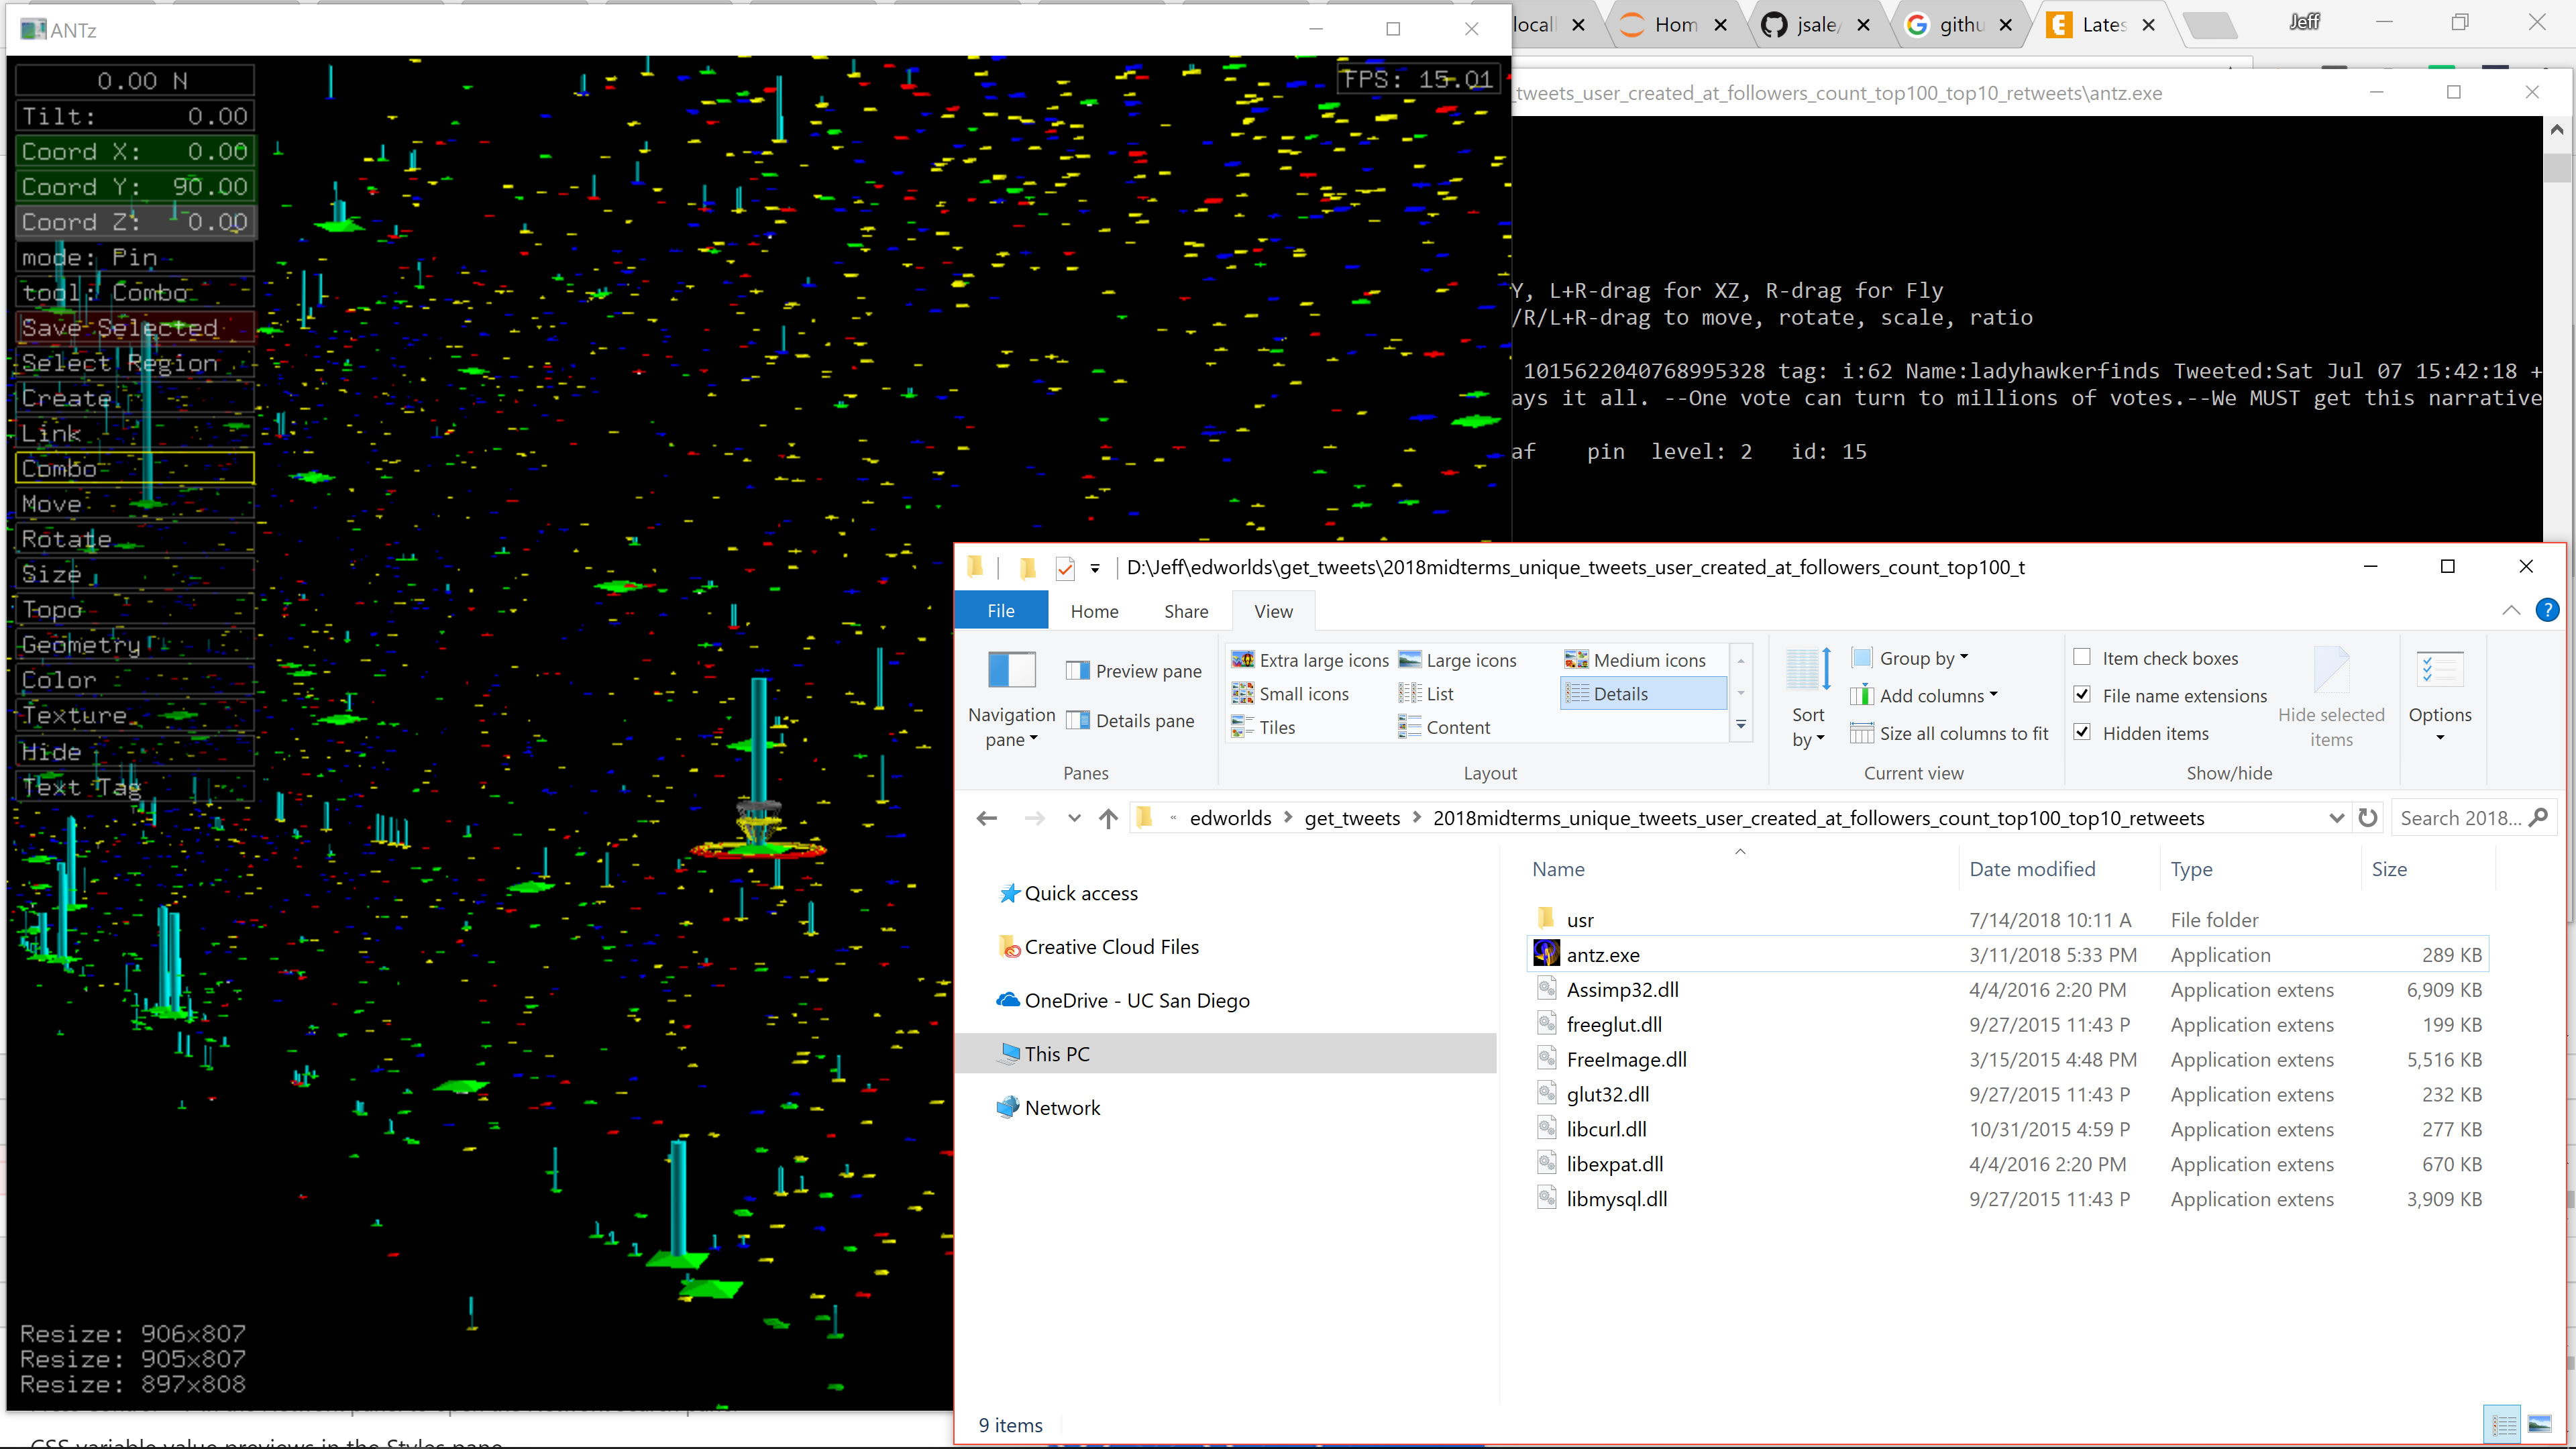
Lesson 2: Jumping Into It
In this lesson we will become familiar with the ANTz hyperglyph visualization program for Windows and Mac OS X.
Go to Lesson
Lesson 3: DIY Hyperglyphs
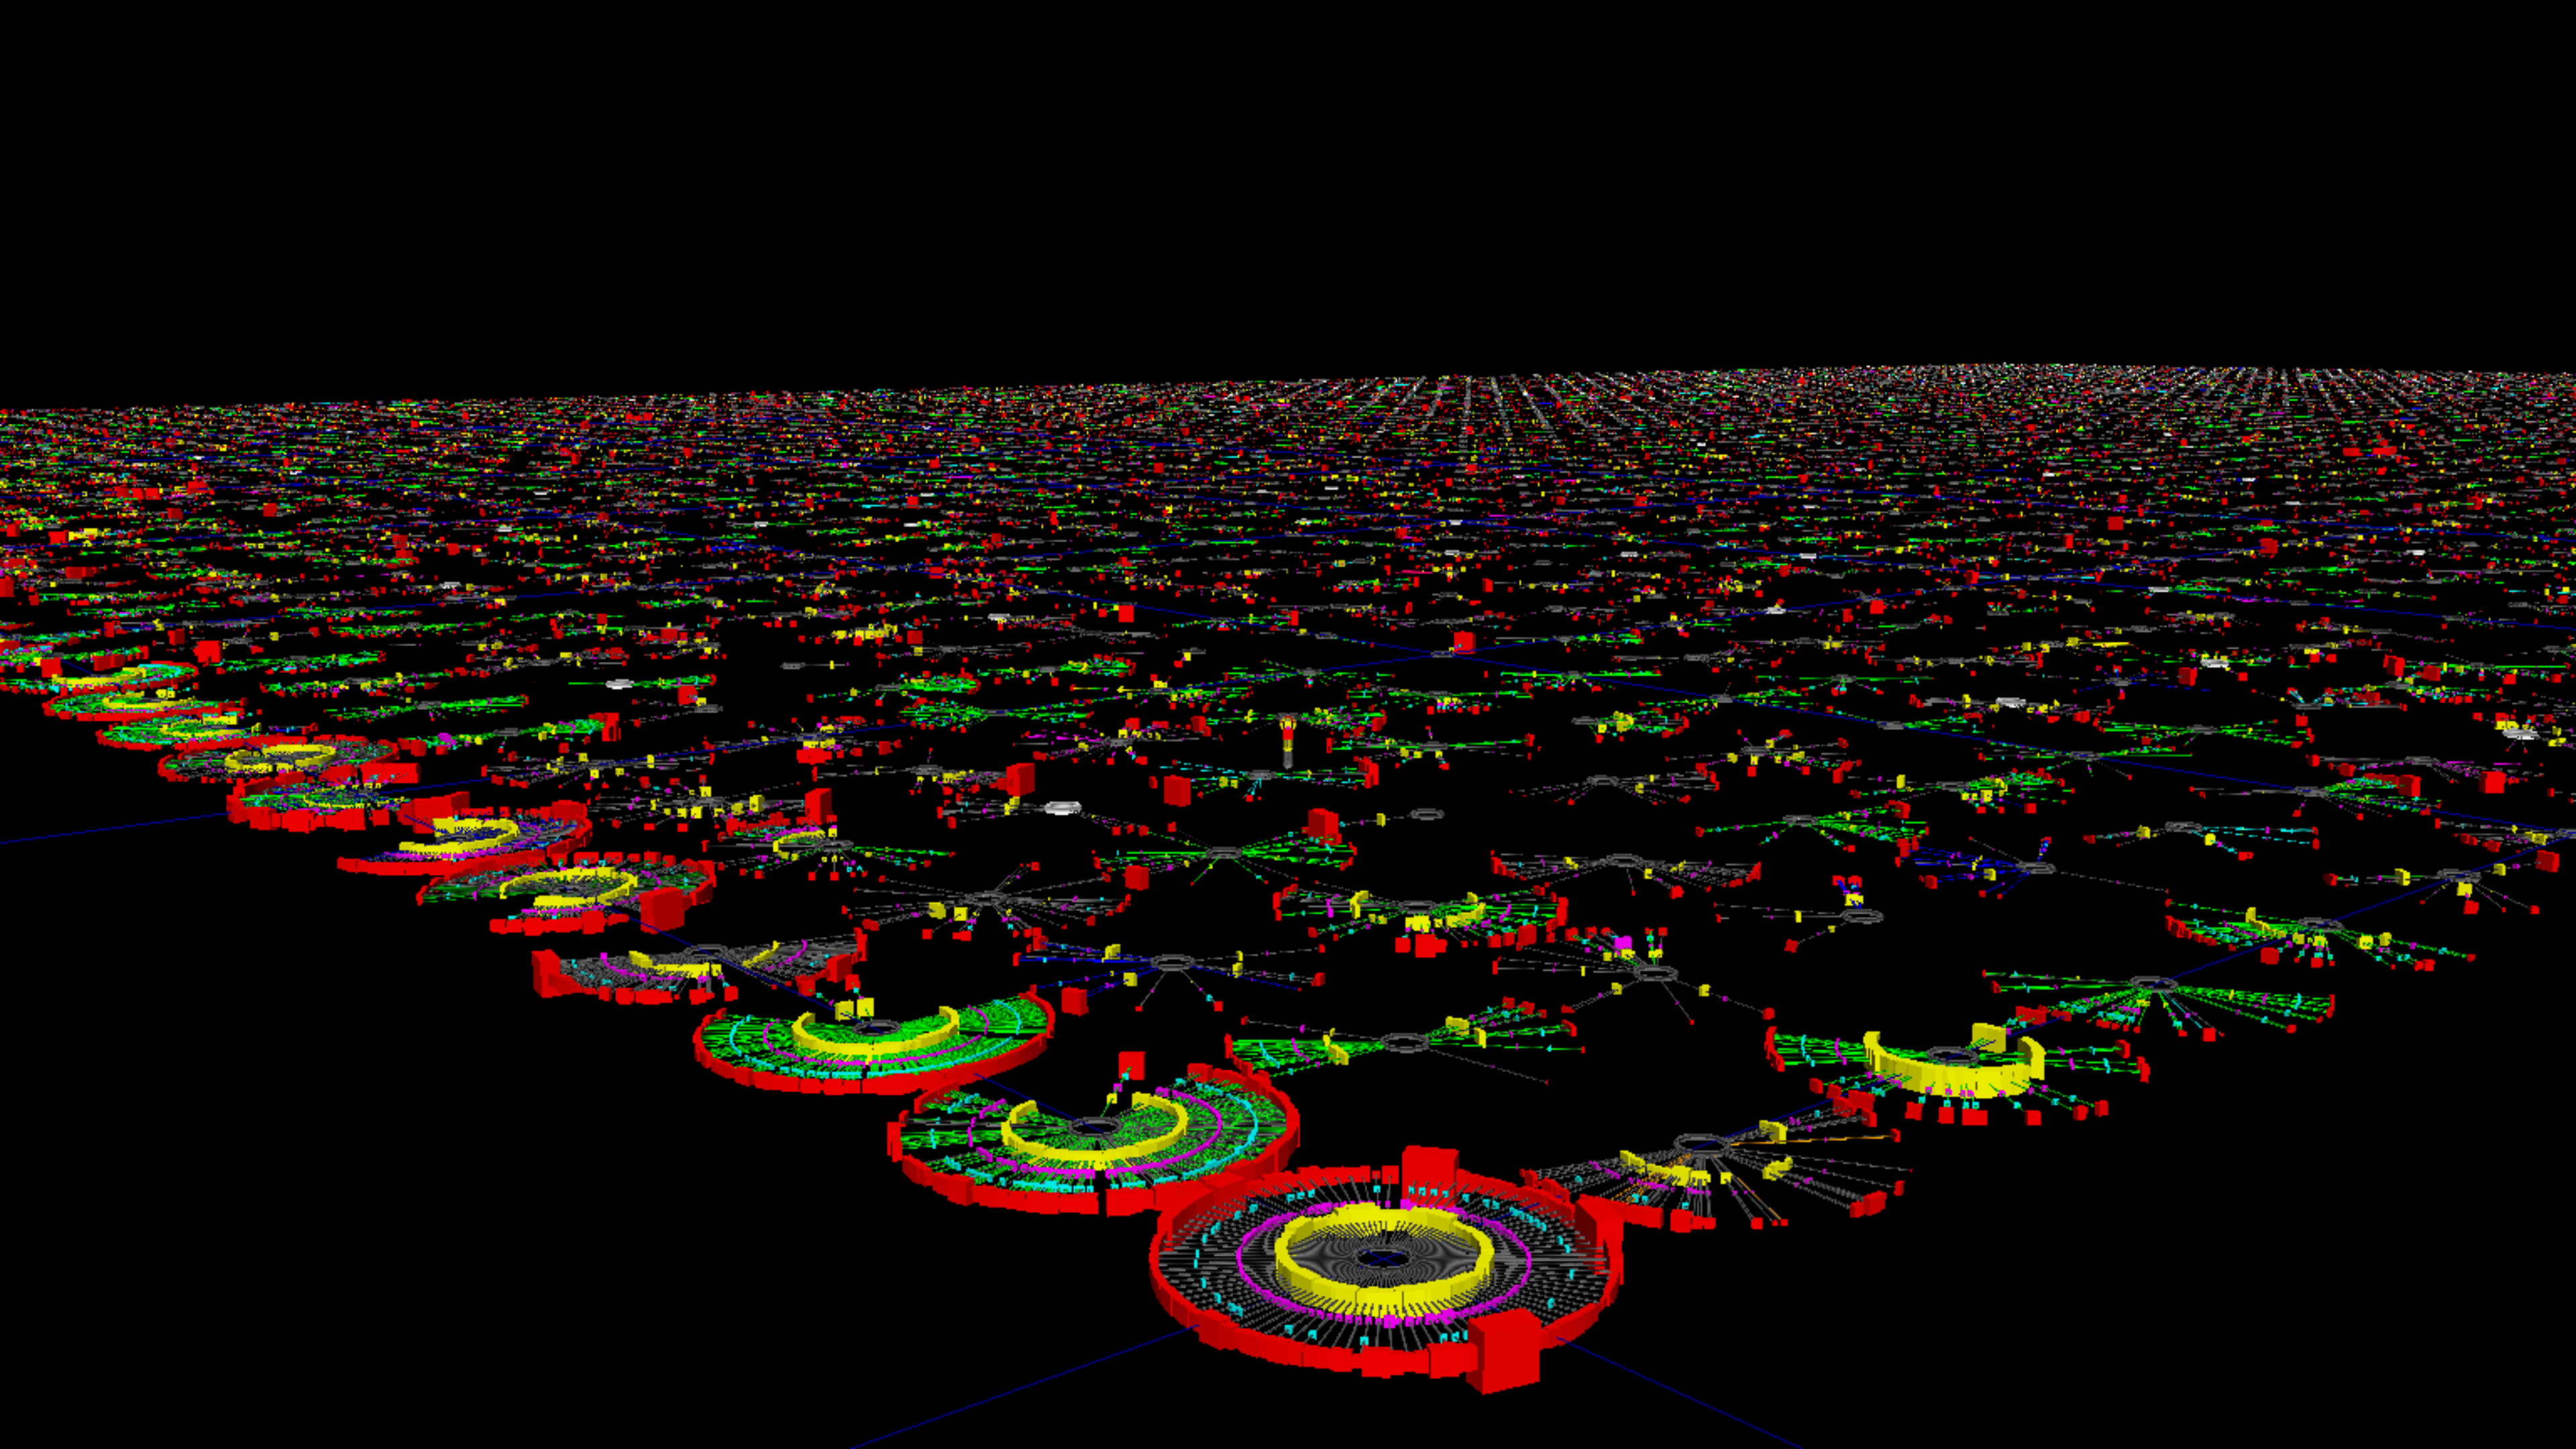
In this lesson we demonstrate ways to create a hyperglyph and hyperglyph distributions in space.
Go to Lesson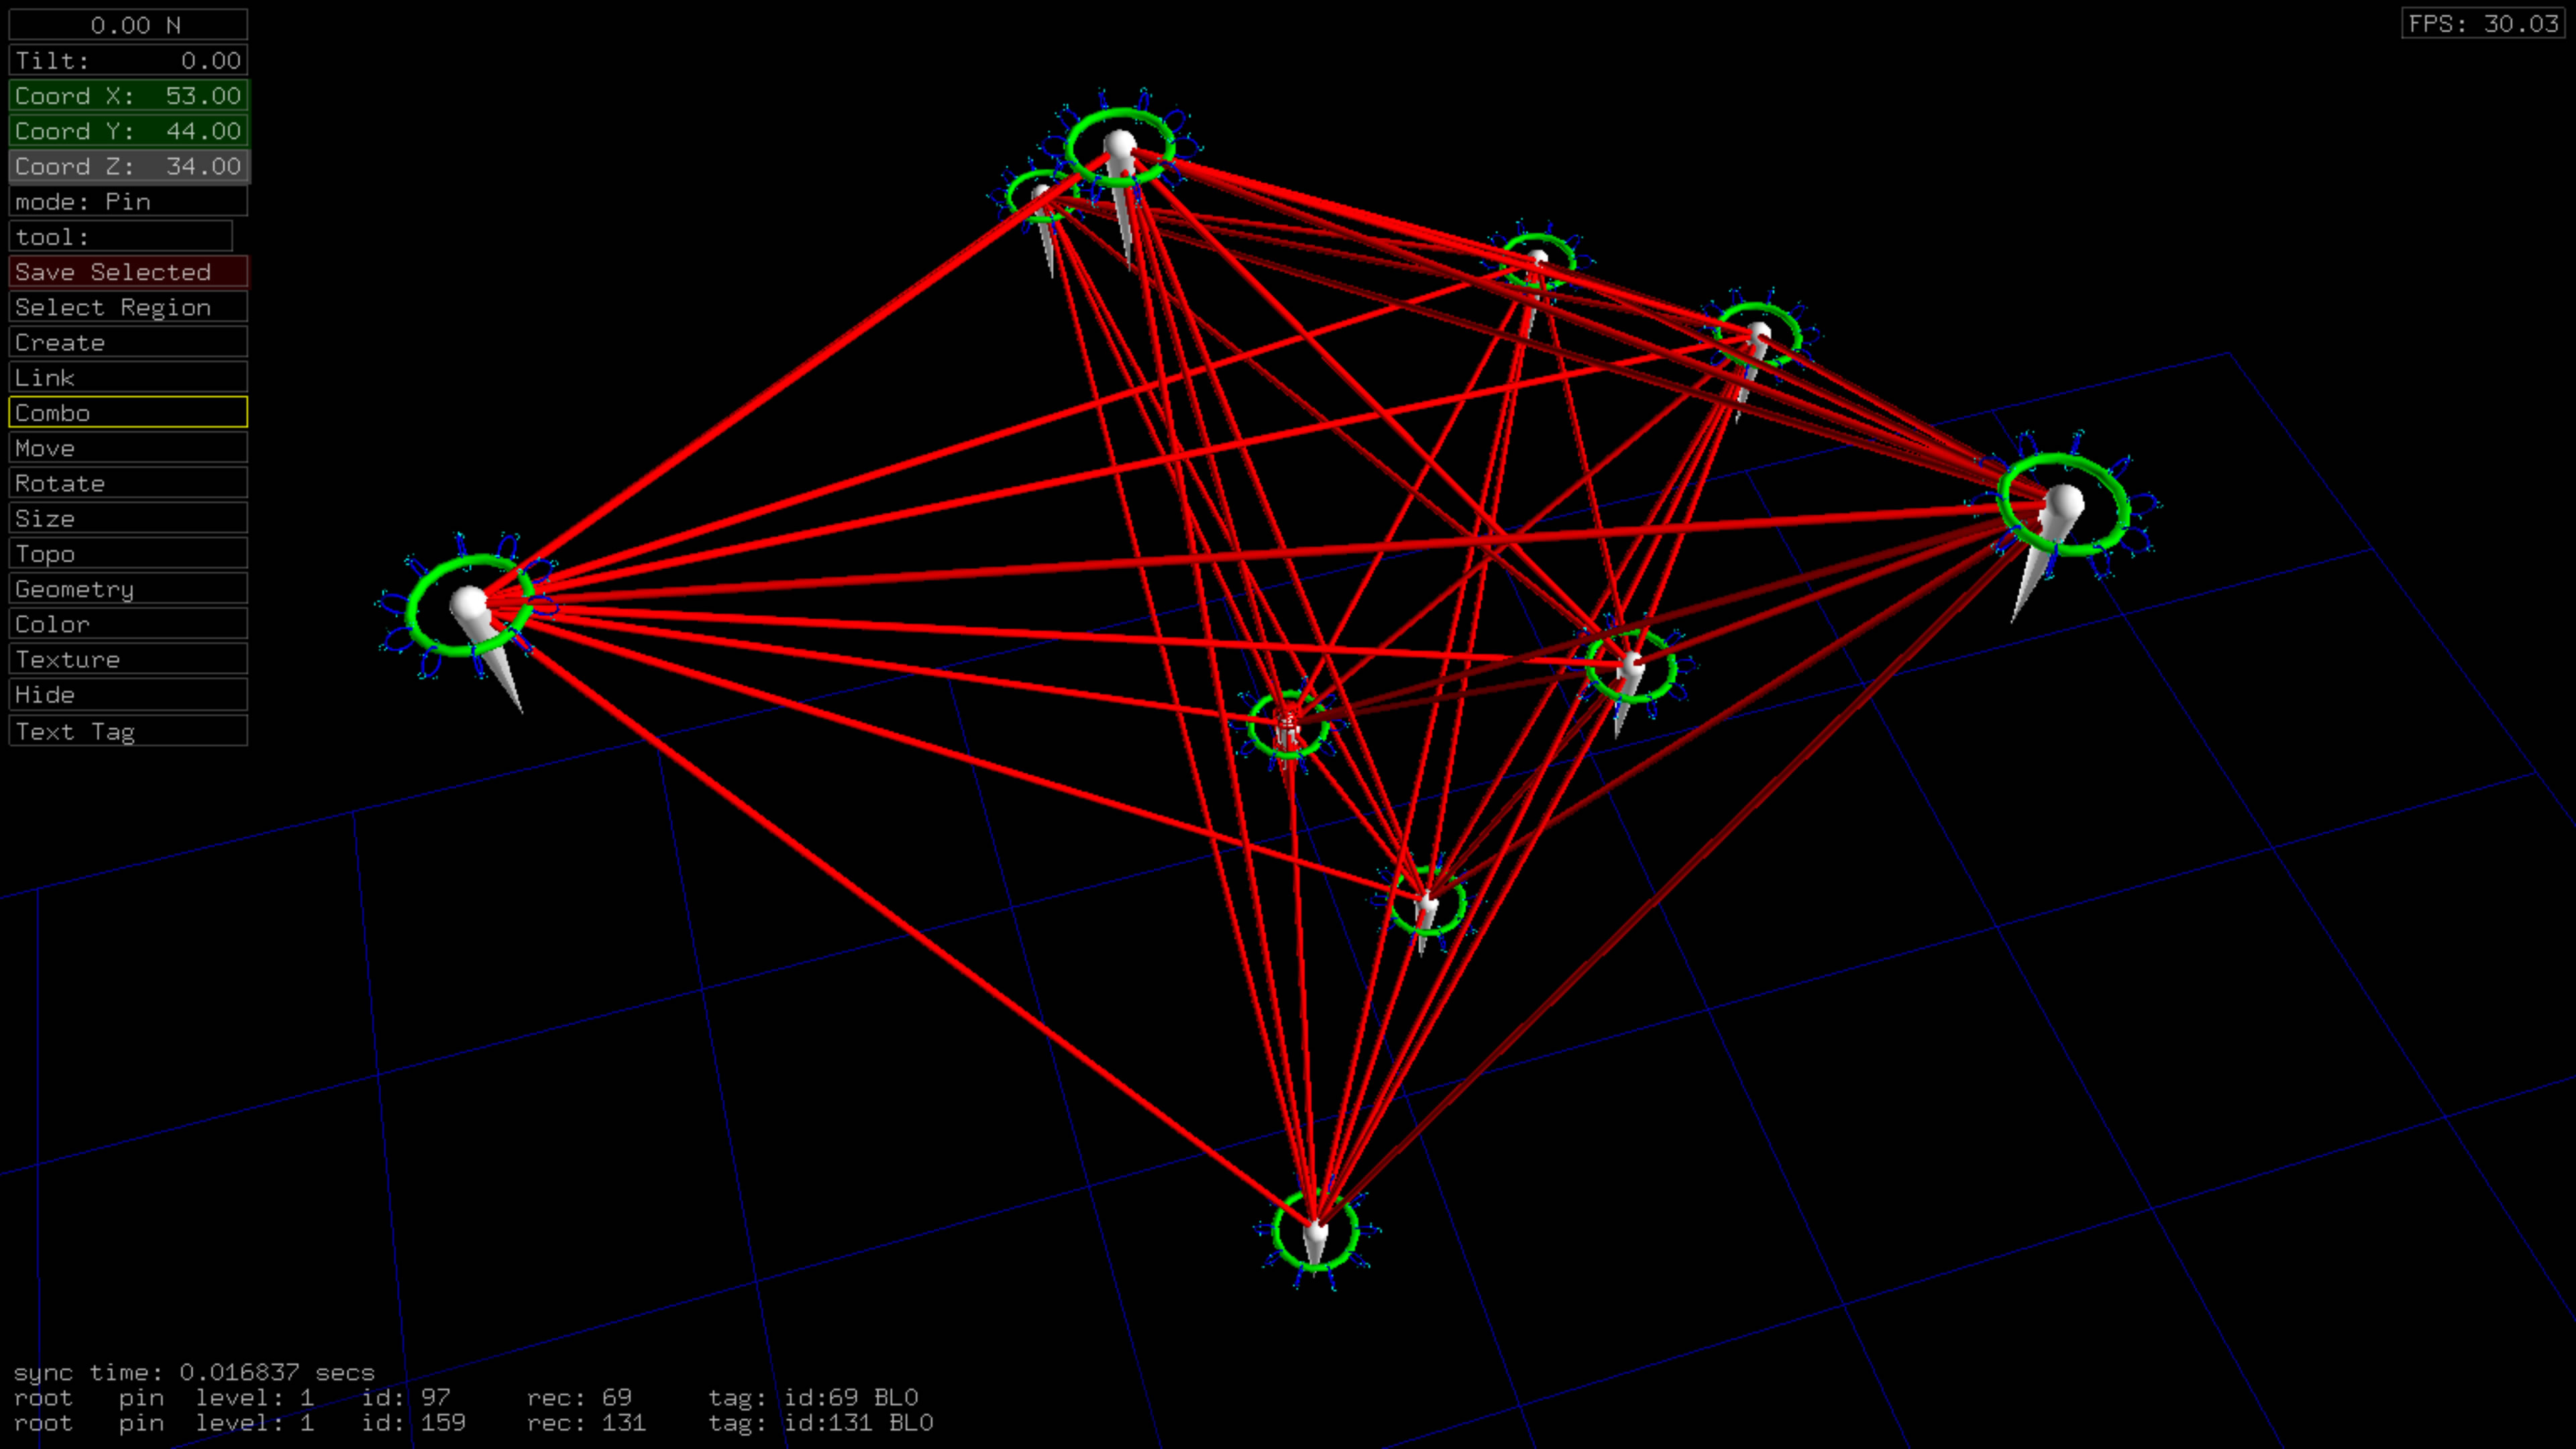
Lessons 4: A Simple Example of How to Script a Hyperglyph Visualization
In this lesson I offer source code in C, Python, and Jupyter Notebooks to generate your own simple visualization. This example includes most of the main features of ANTz hyperglyph visualization. It plots 10 hyperglyphs randomly in space. Each glyph includes multiple parent-child 'branch levels', color-coding, multiple geometry types, and includes links (edges) and metadata 'tags'.
Go to Lesson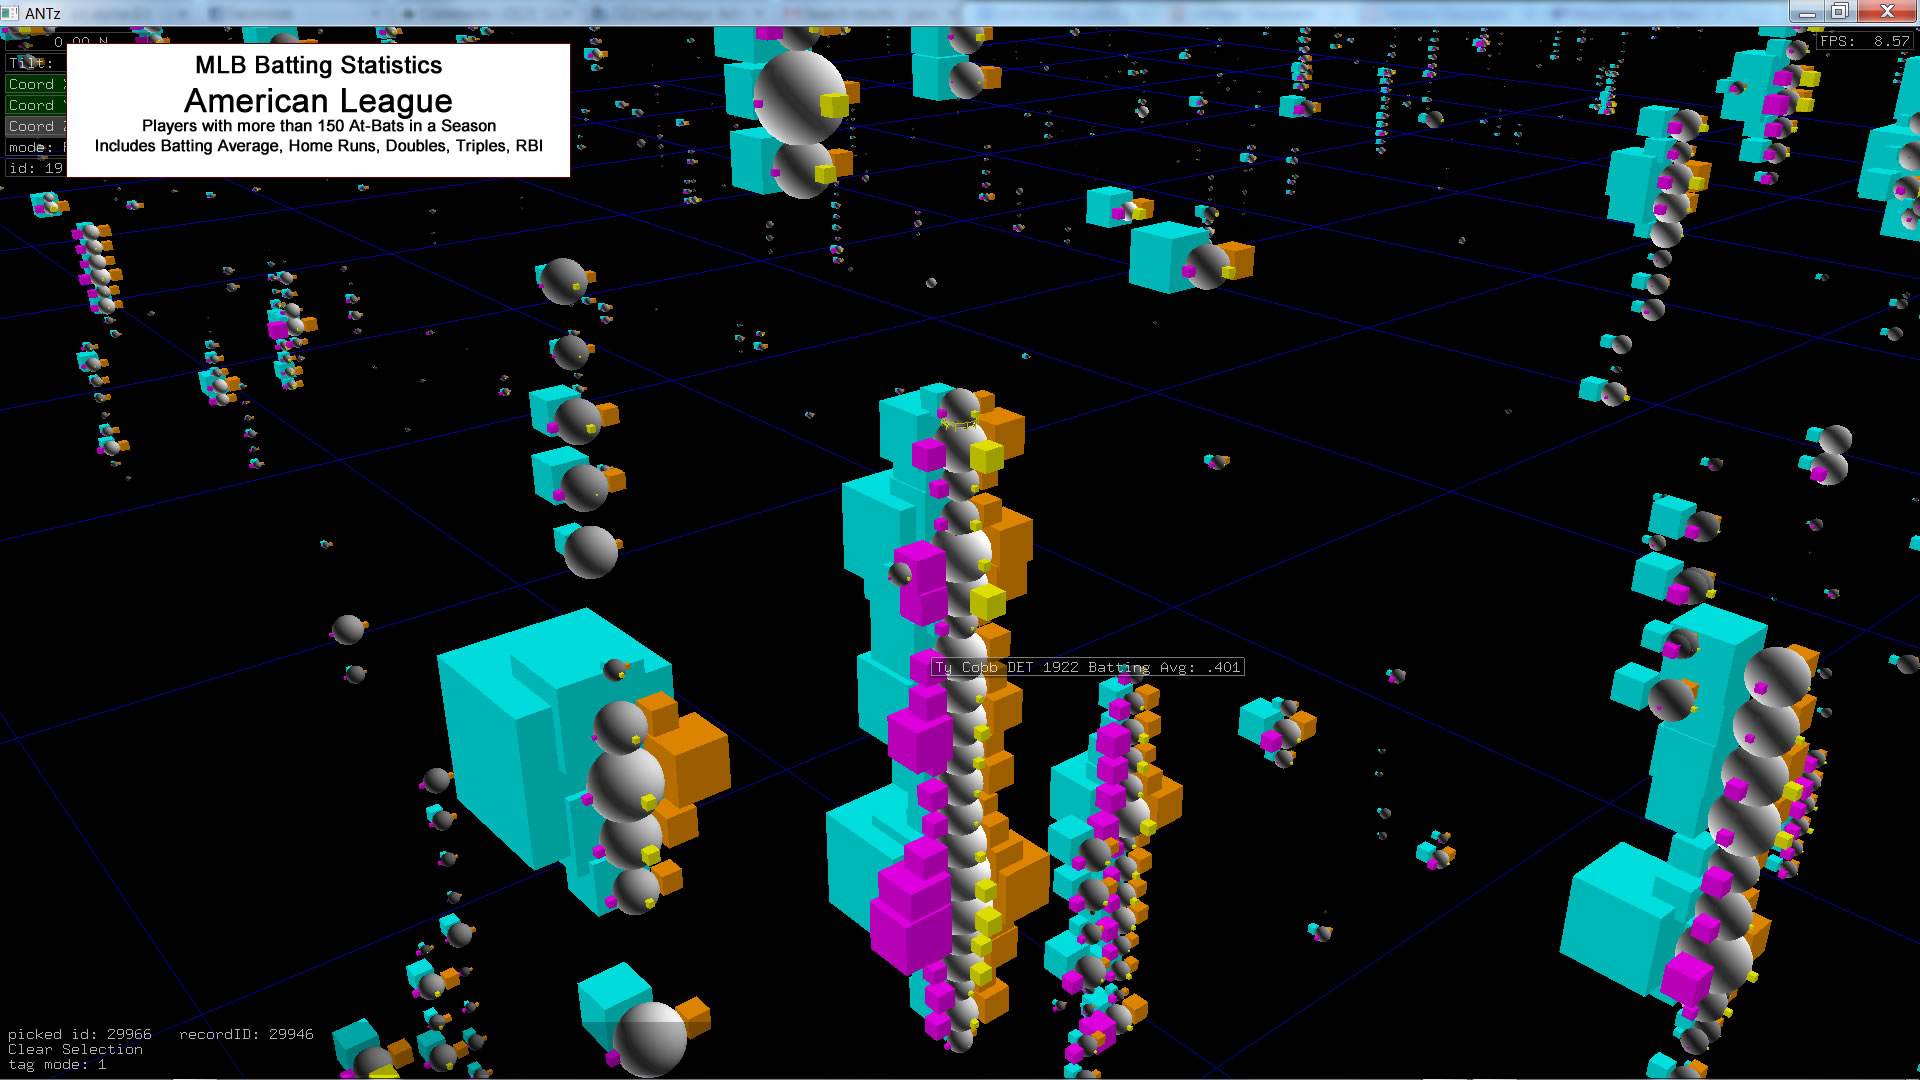
Lesson 5: Importing and Visualizing Data: A Simple Example of Hyperglyph Visualization for the Lahman Baseball Database
This lesson demonstrates how to format your tabular (row and column spreadsheet) data for ANTz using C, Python, or Jupyter Notebook scripts.
Go to Lesson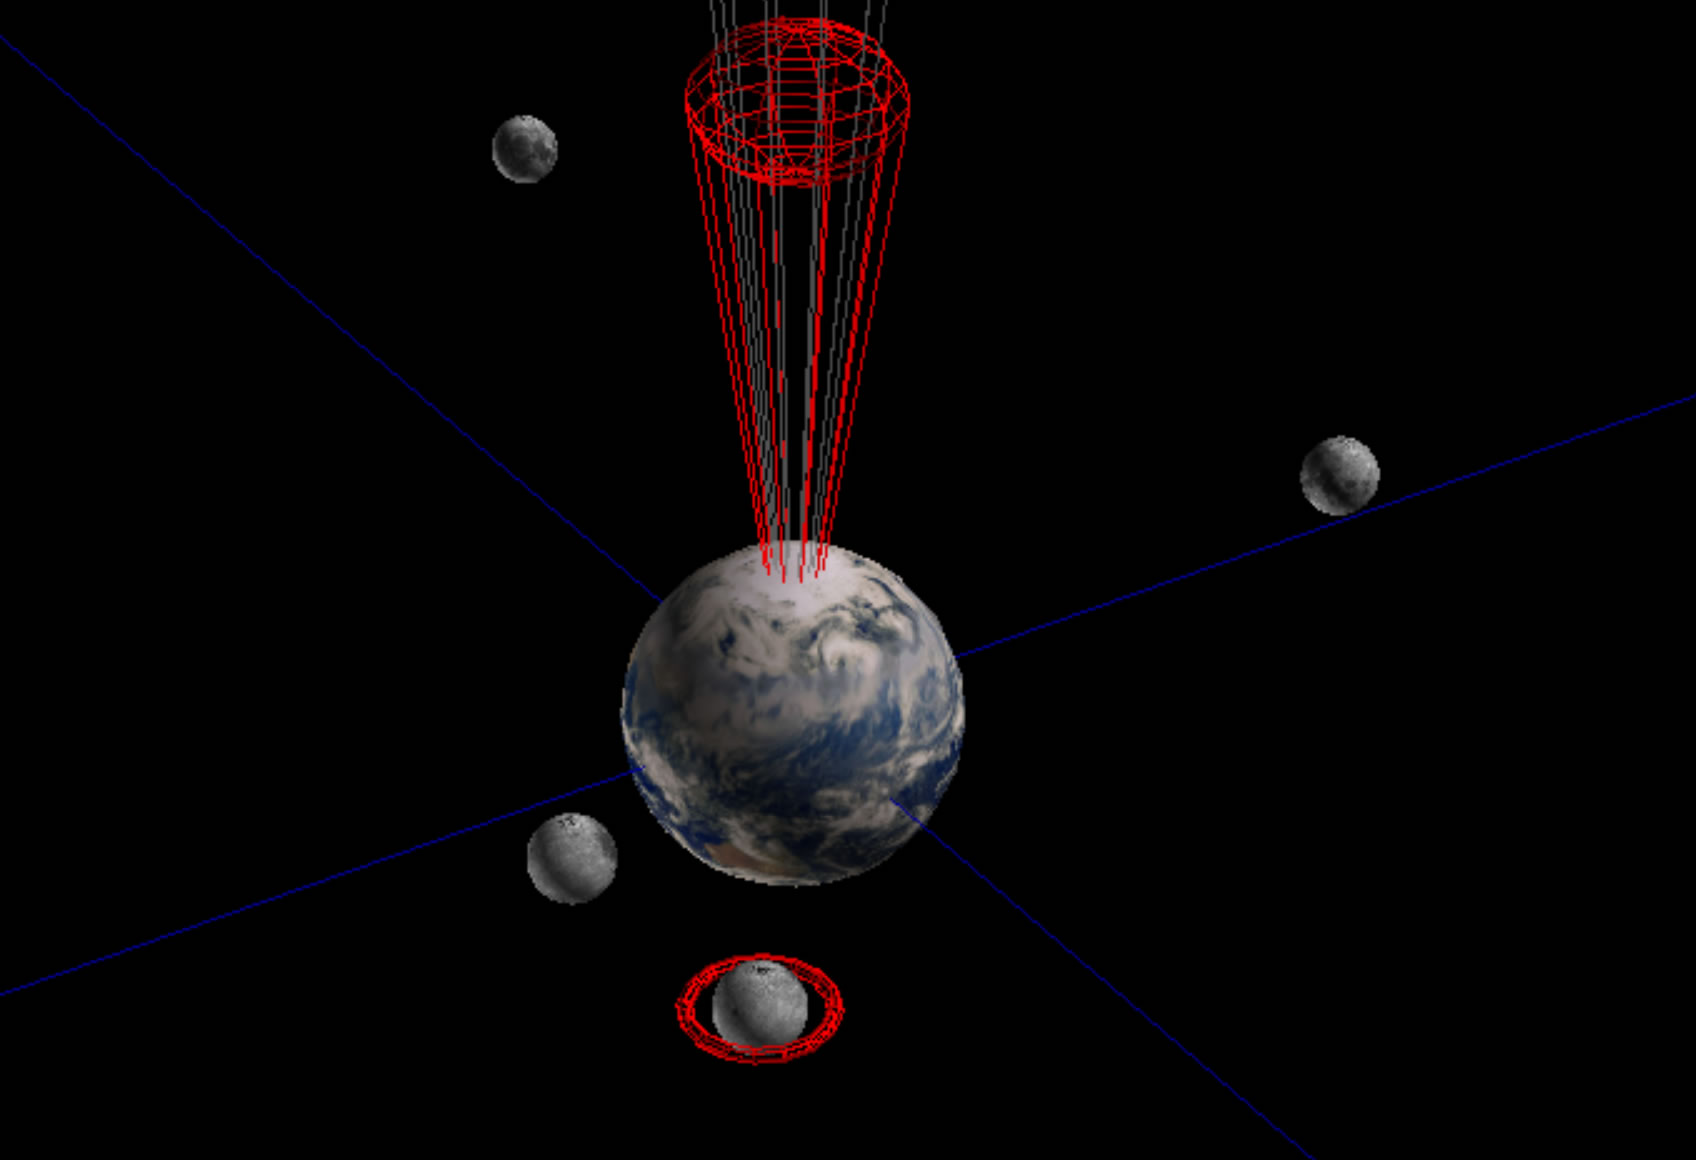
Lesson 6: Hyperglyph Animation Using ANTz Channels
This example demonstrates how to use the ANTz Channels file to animate a moon around a planet.
Go to Lesson