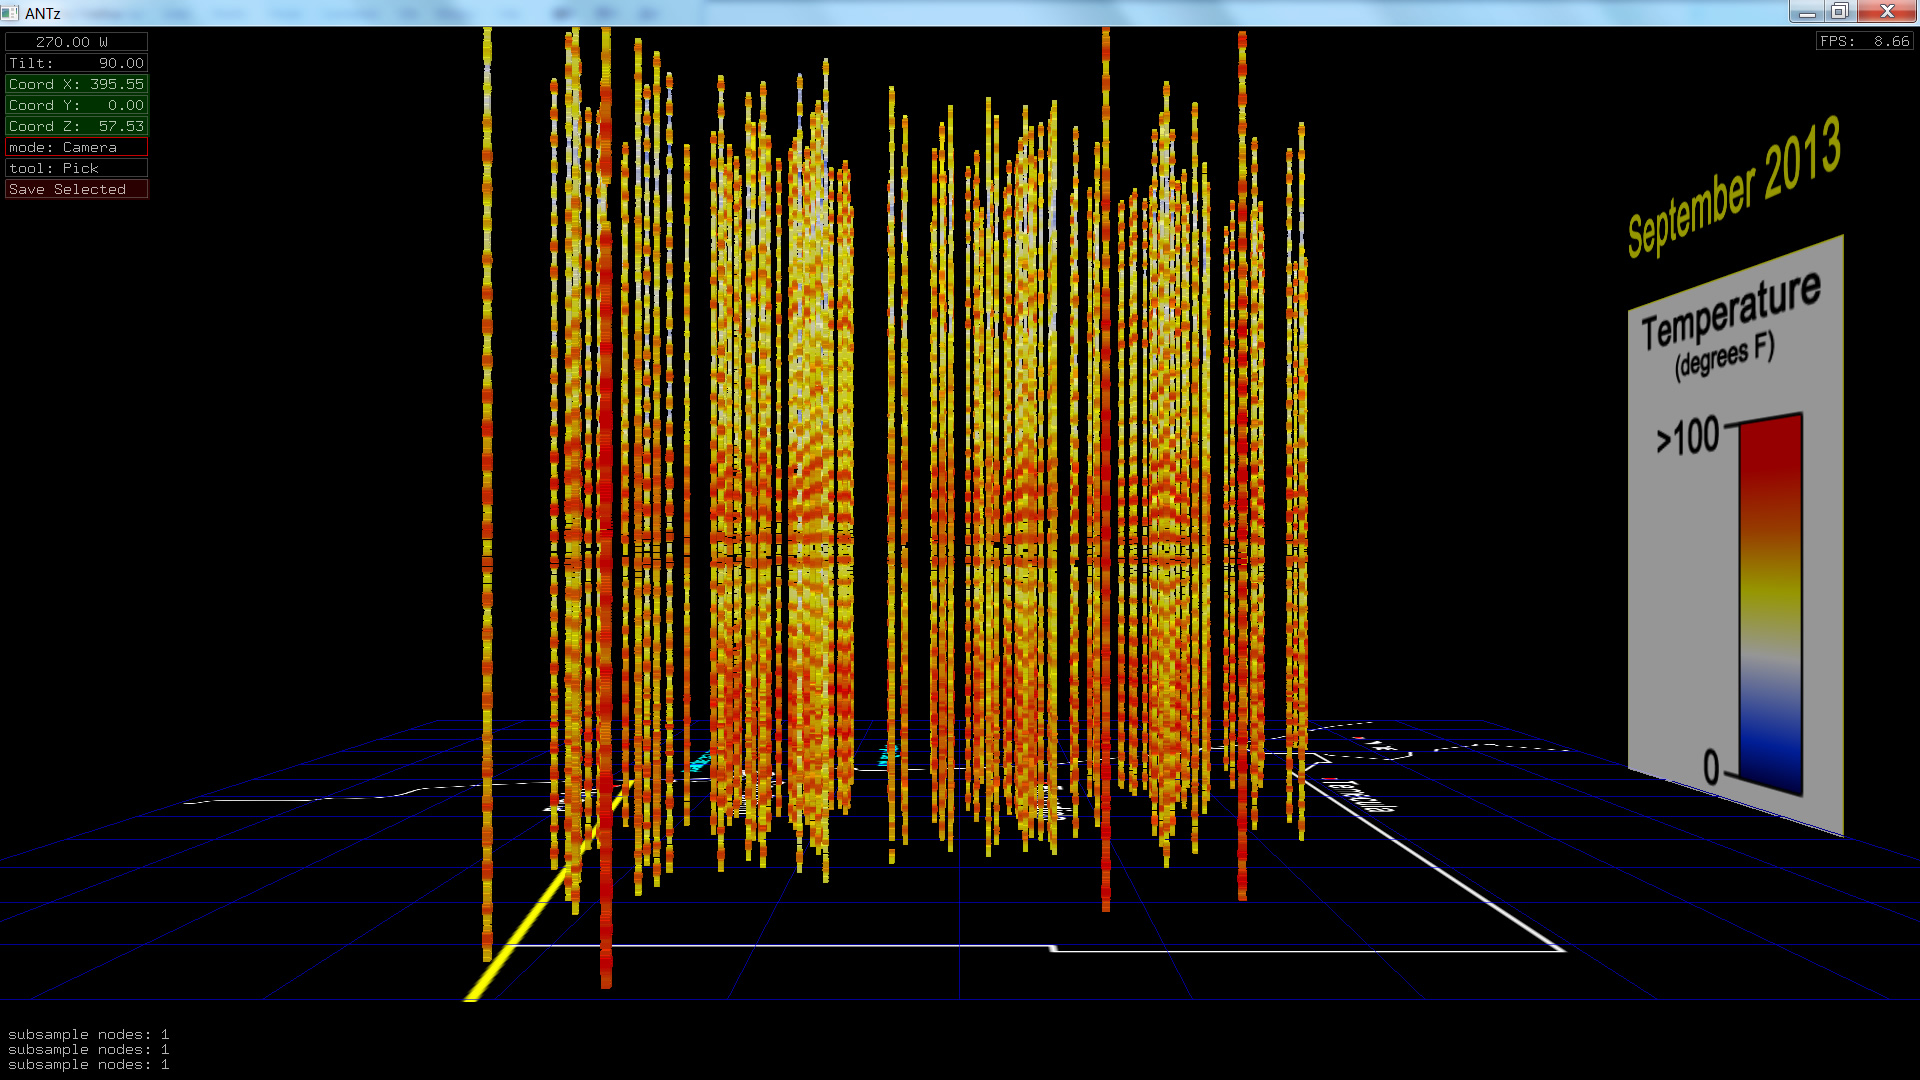
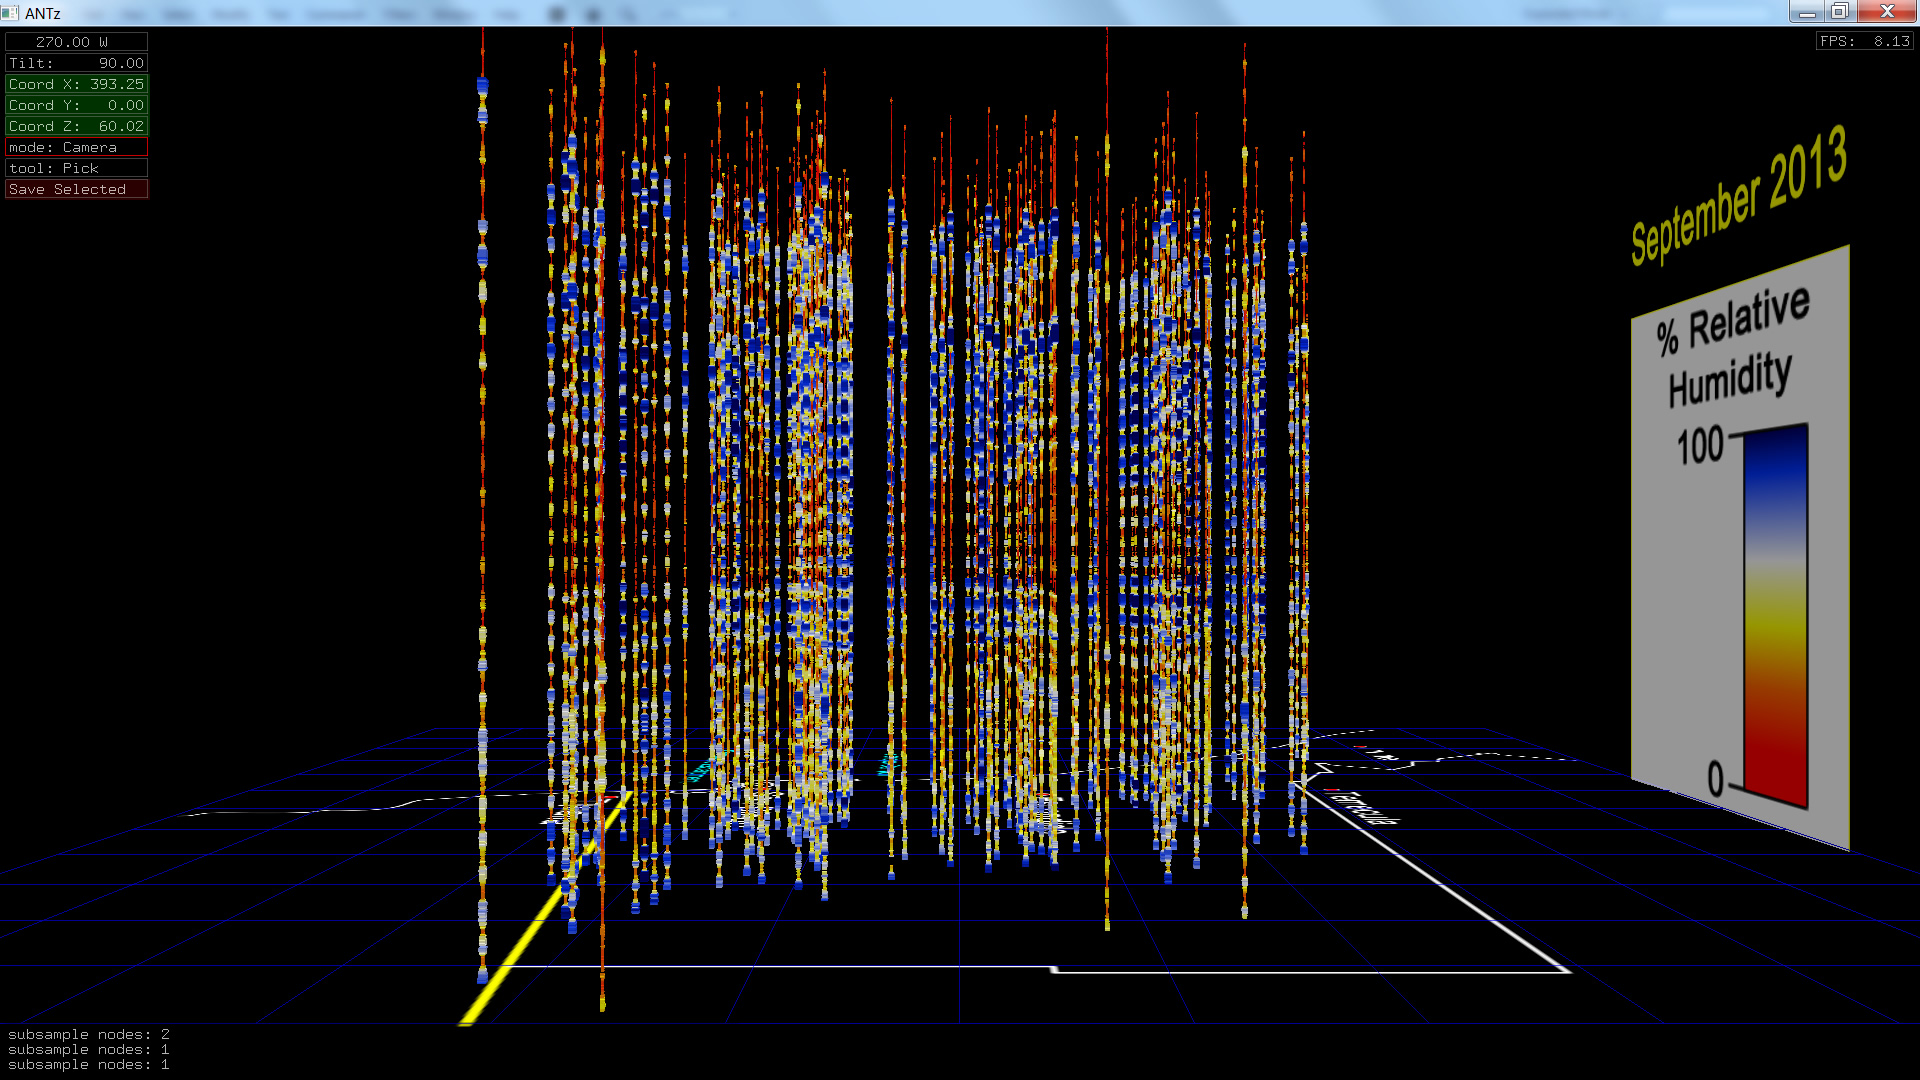
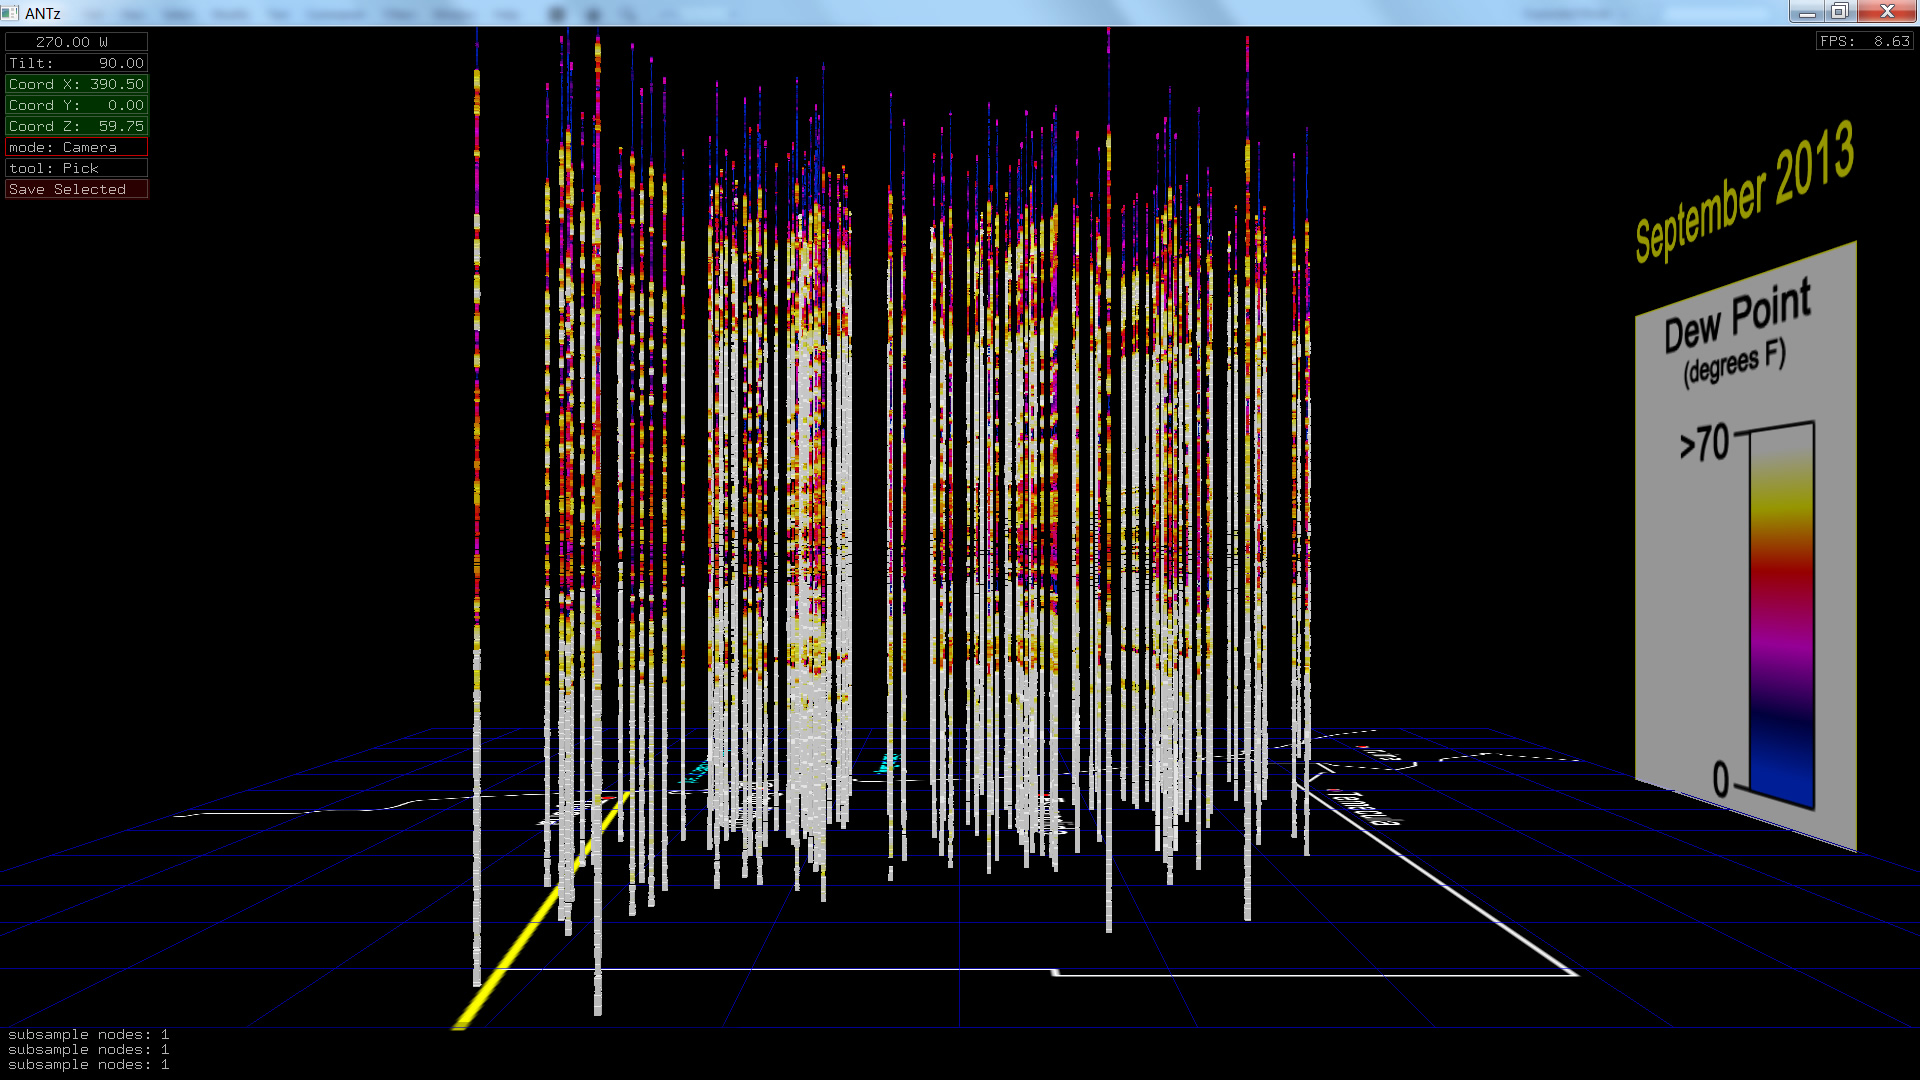
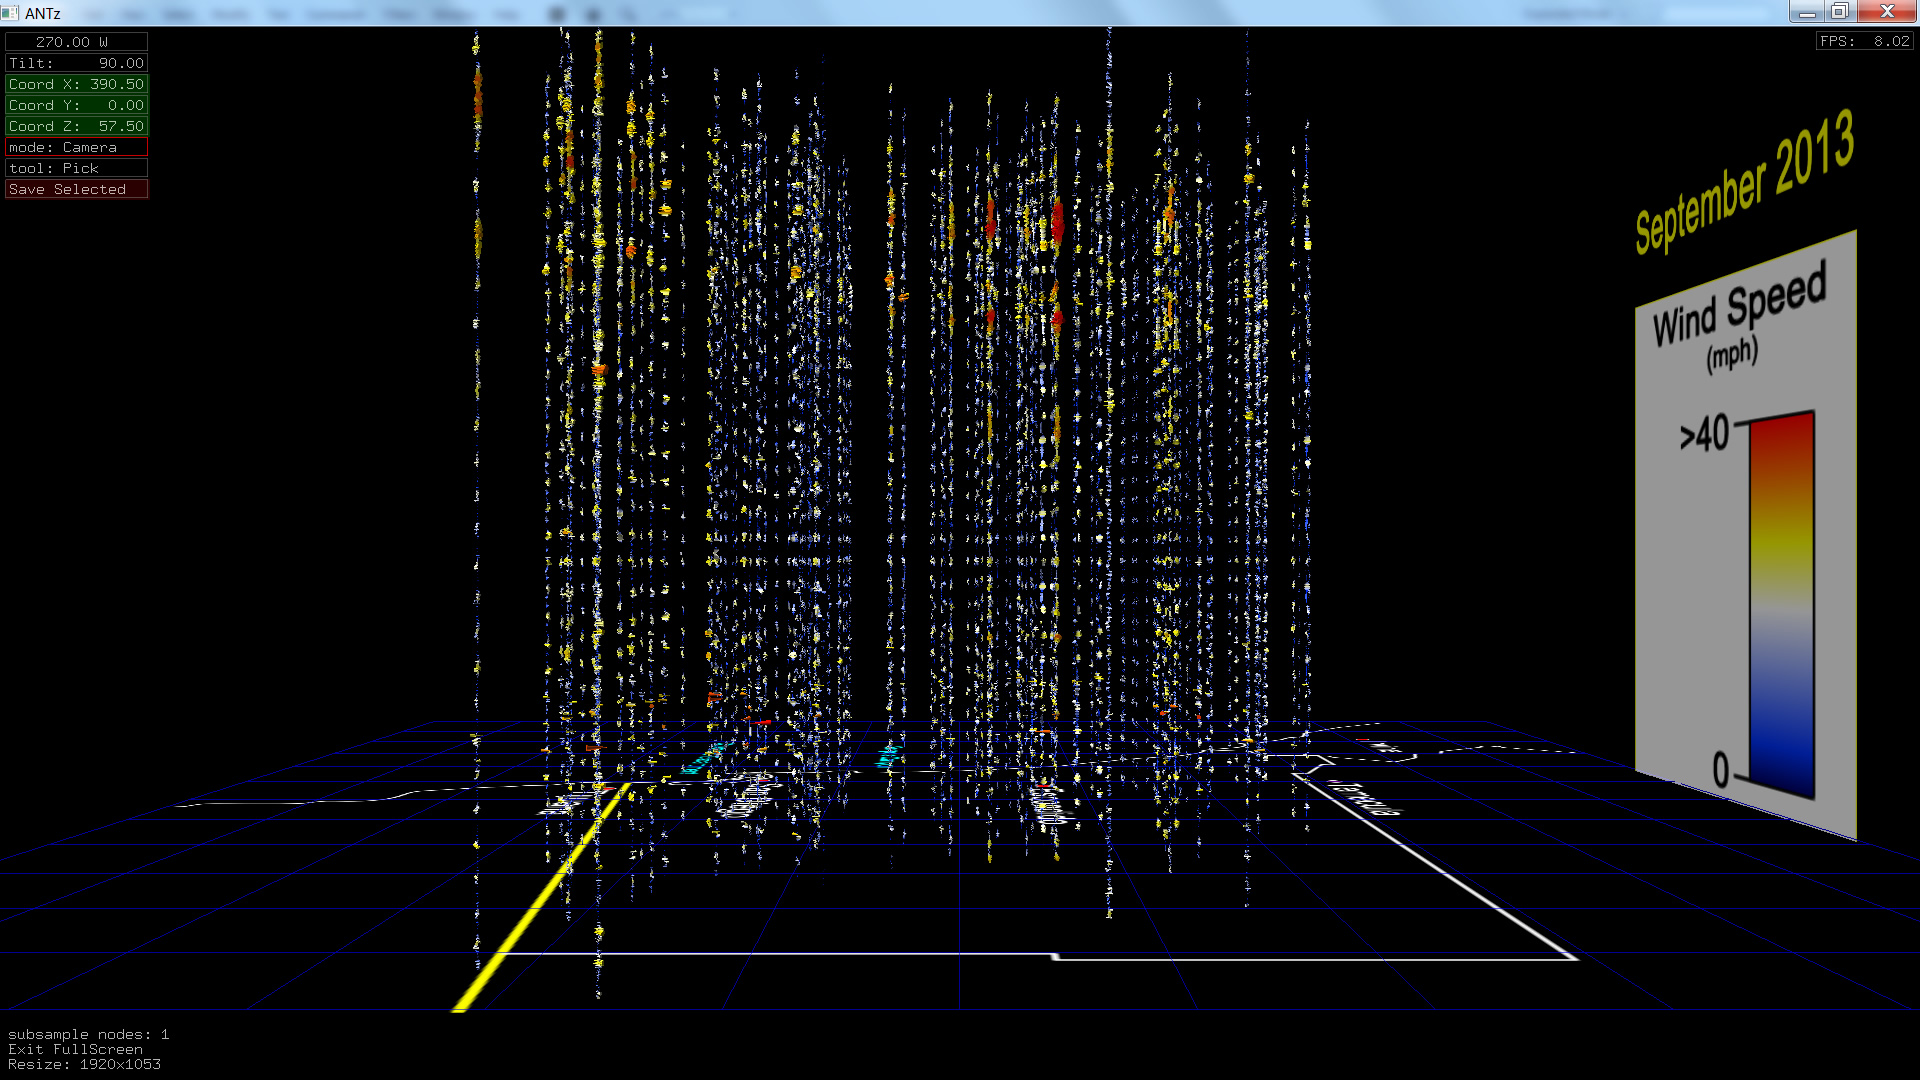
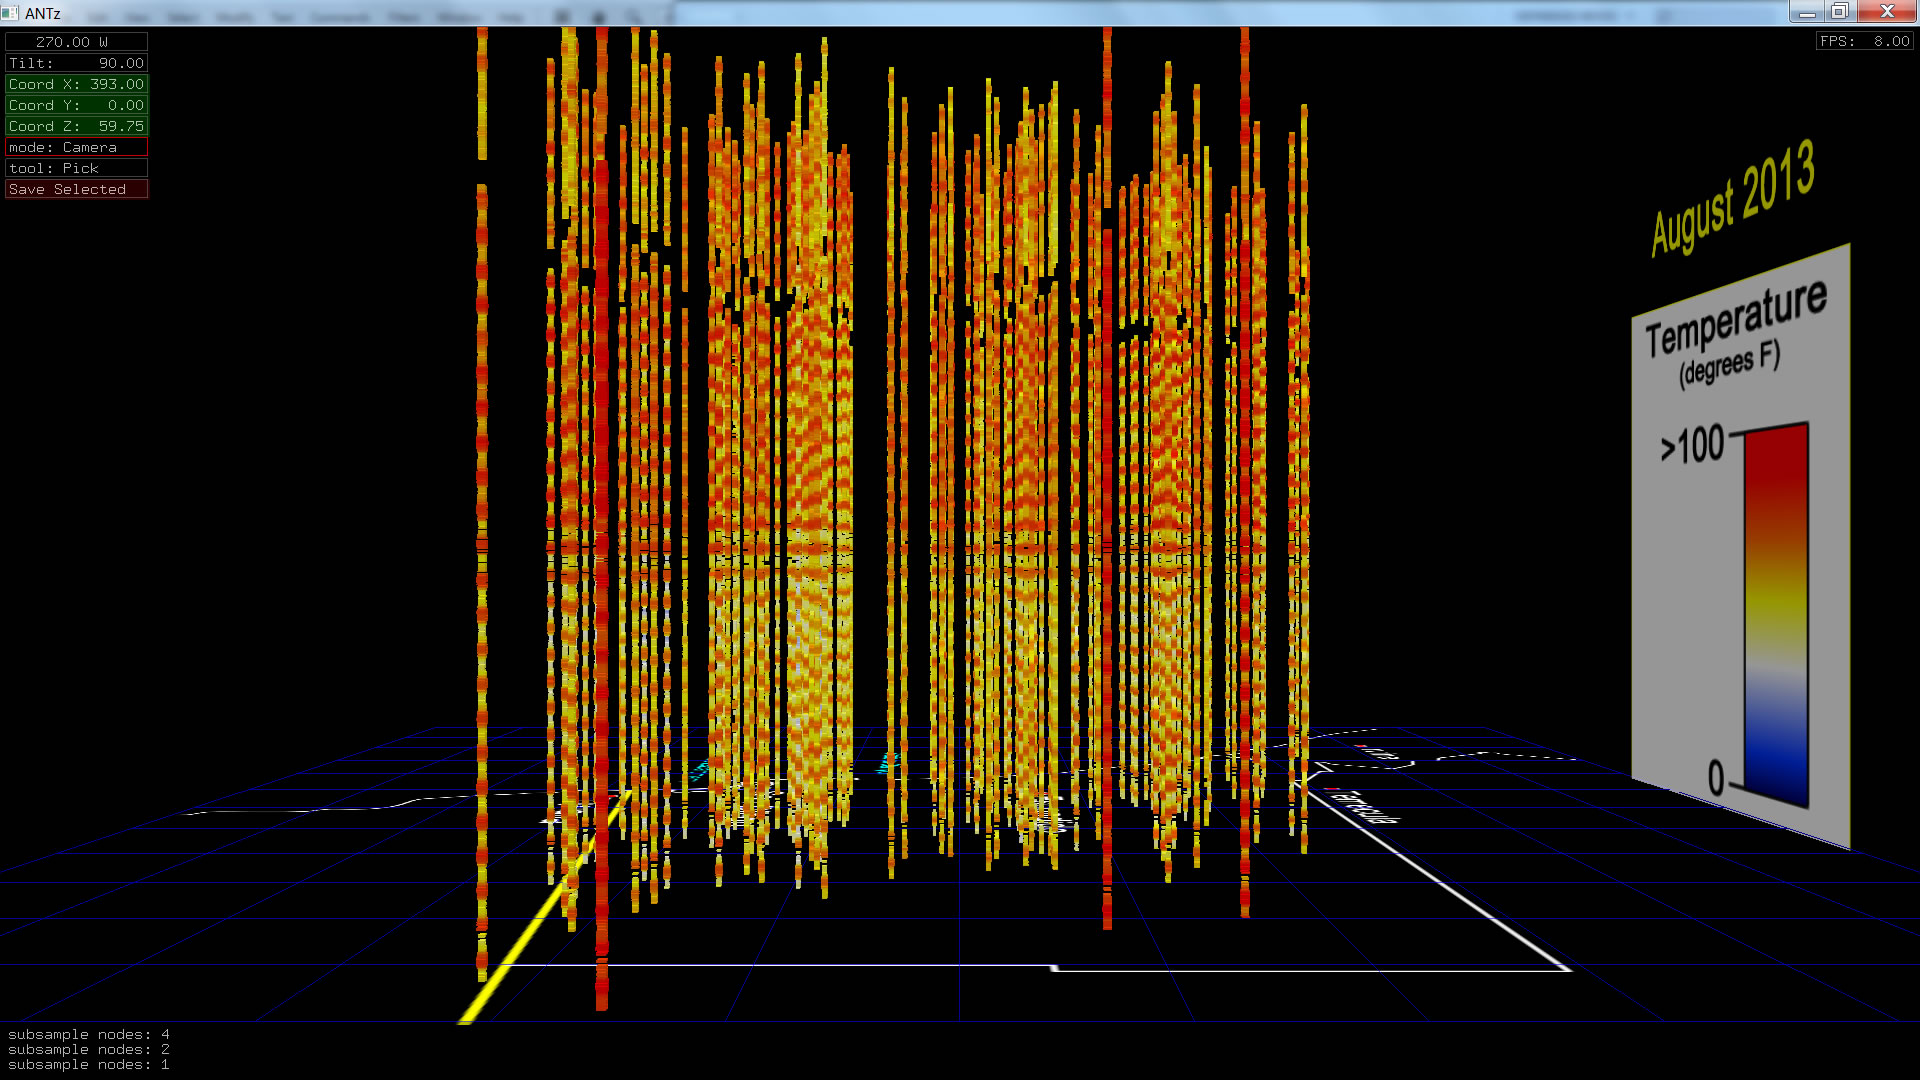
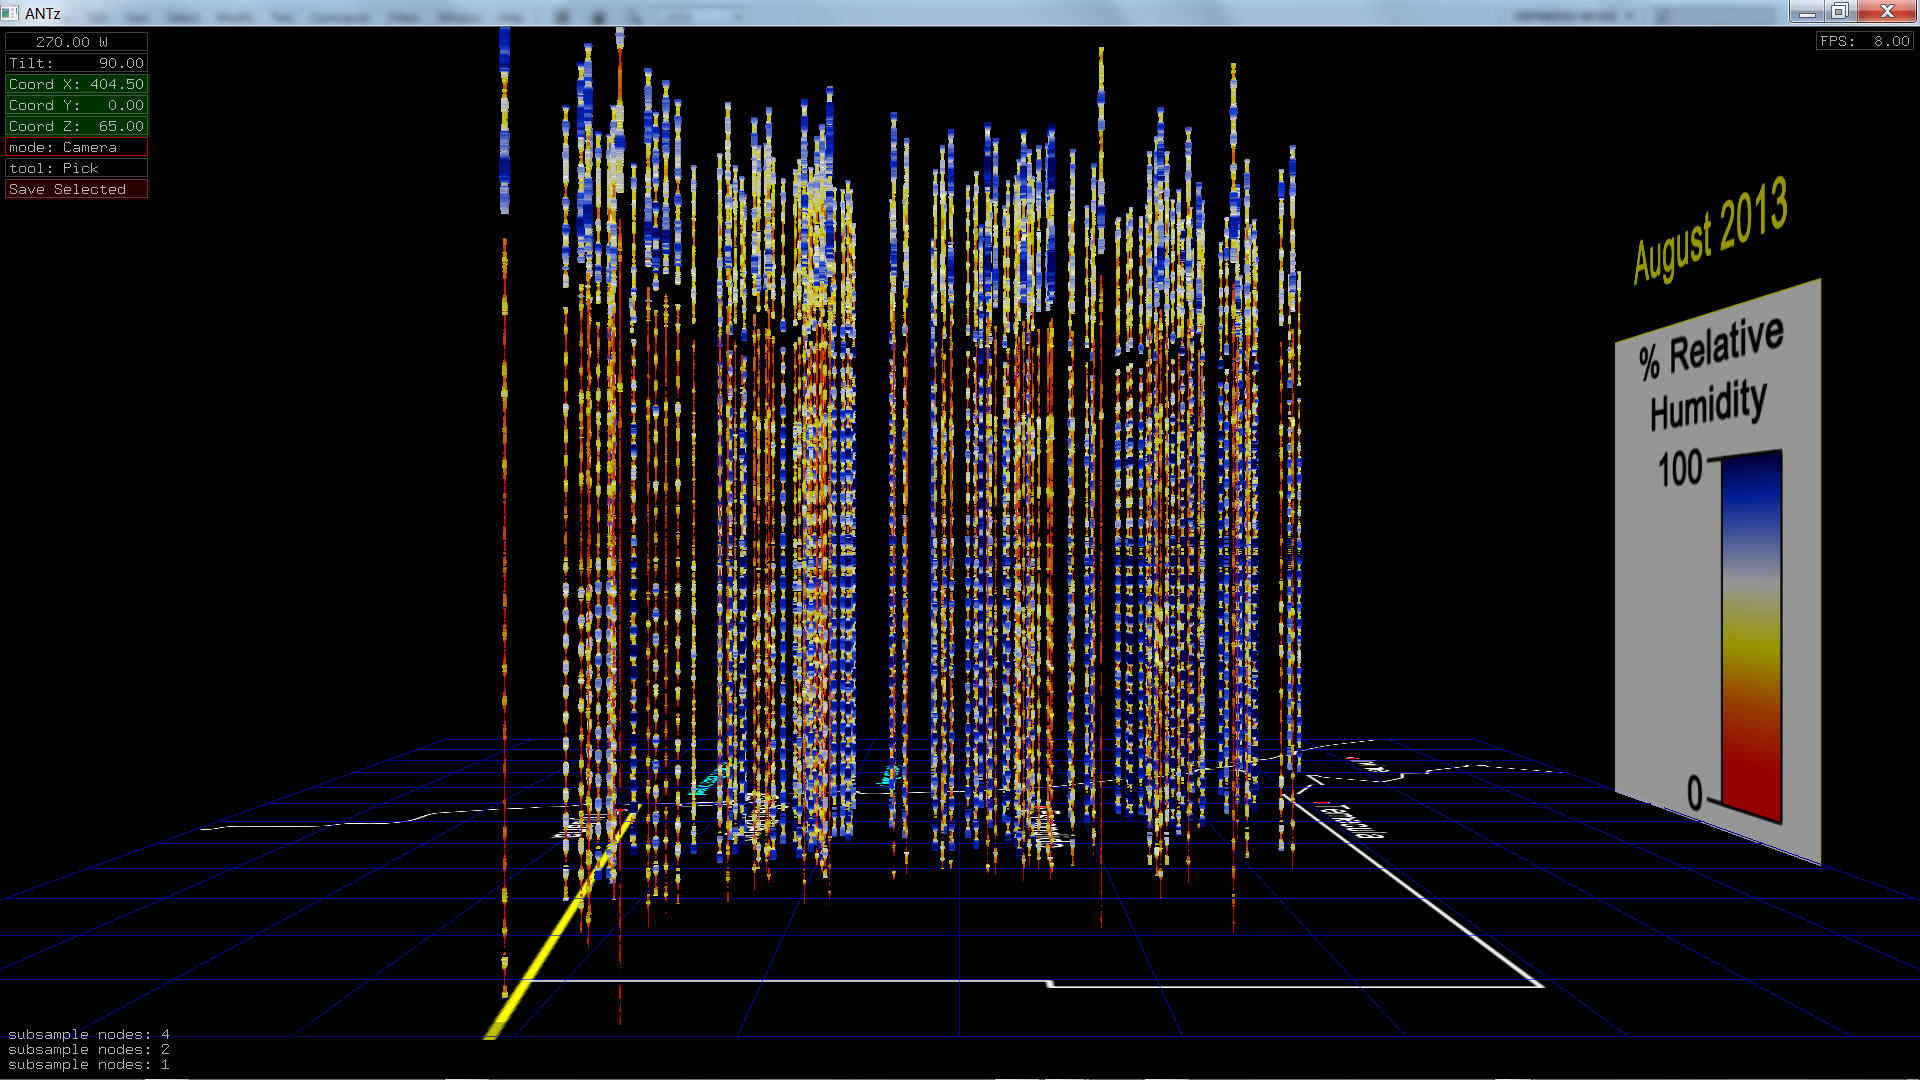
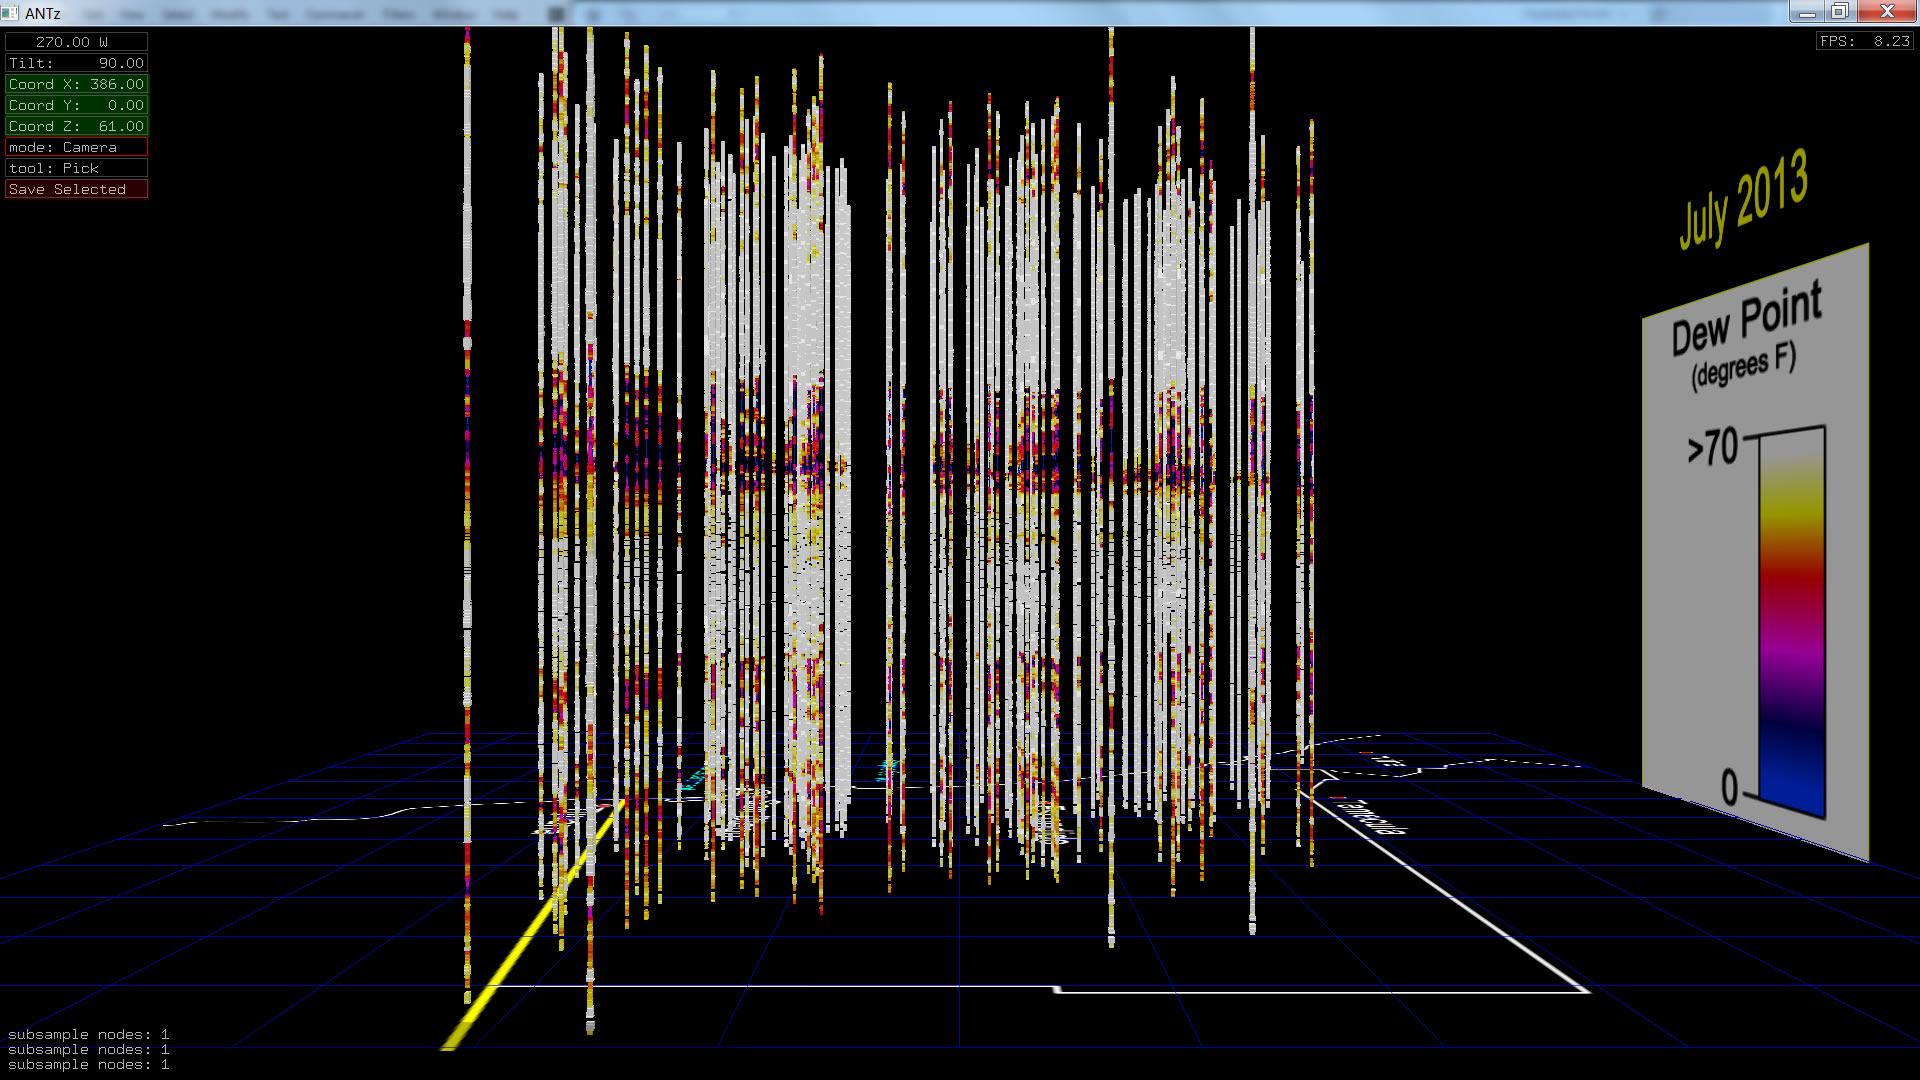
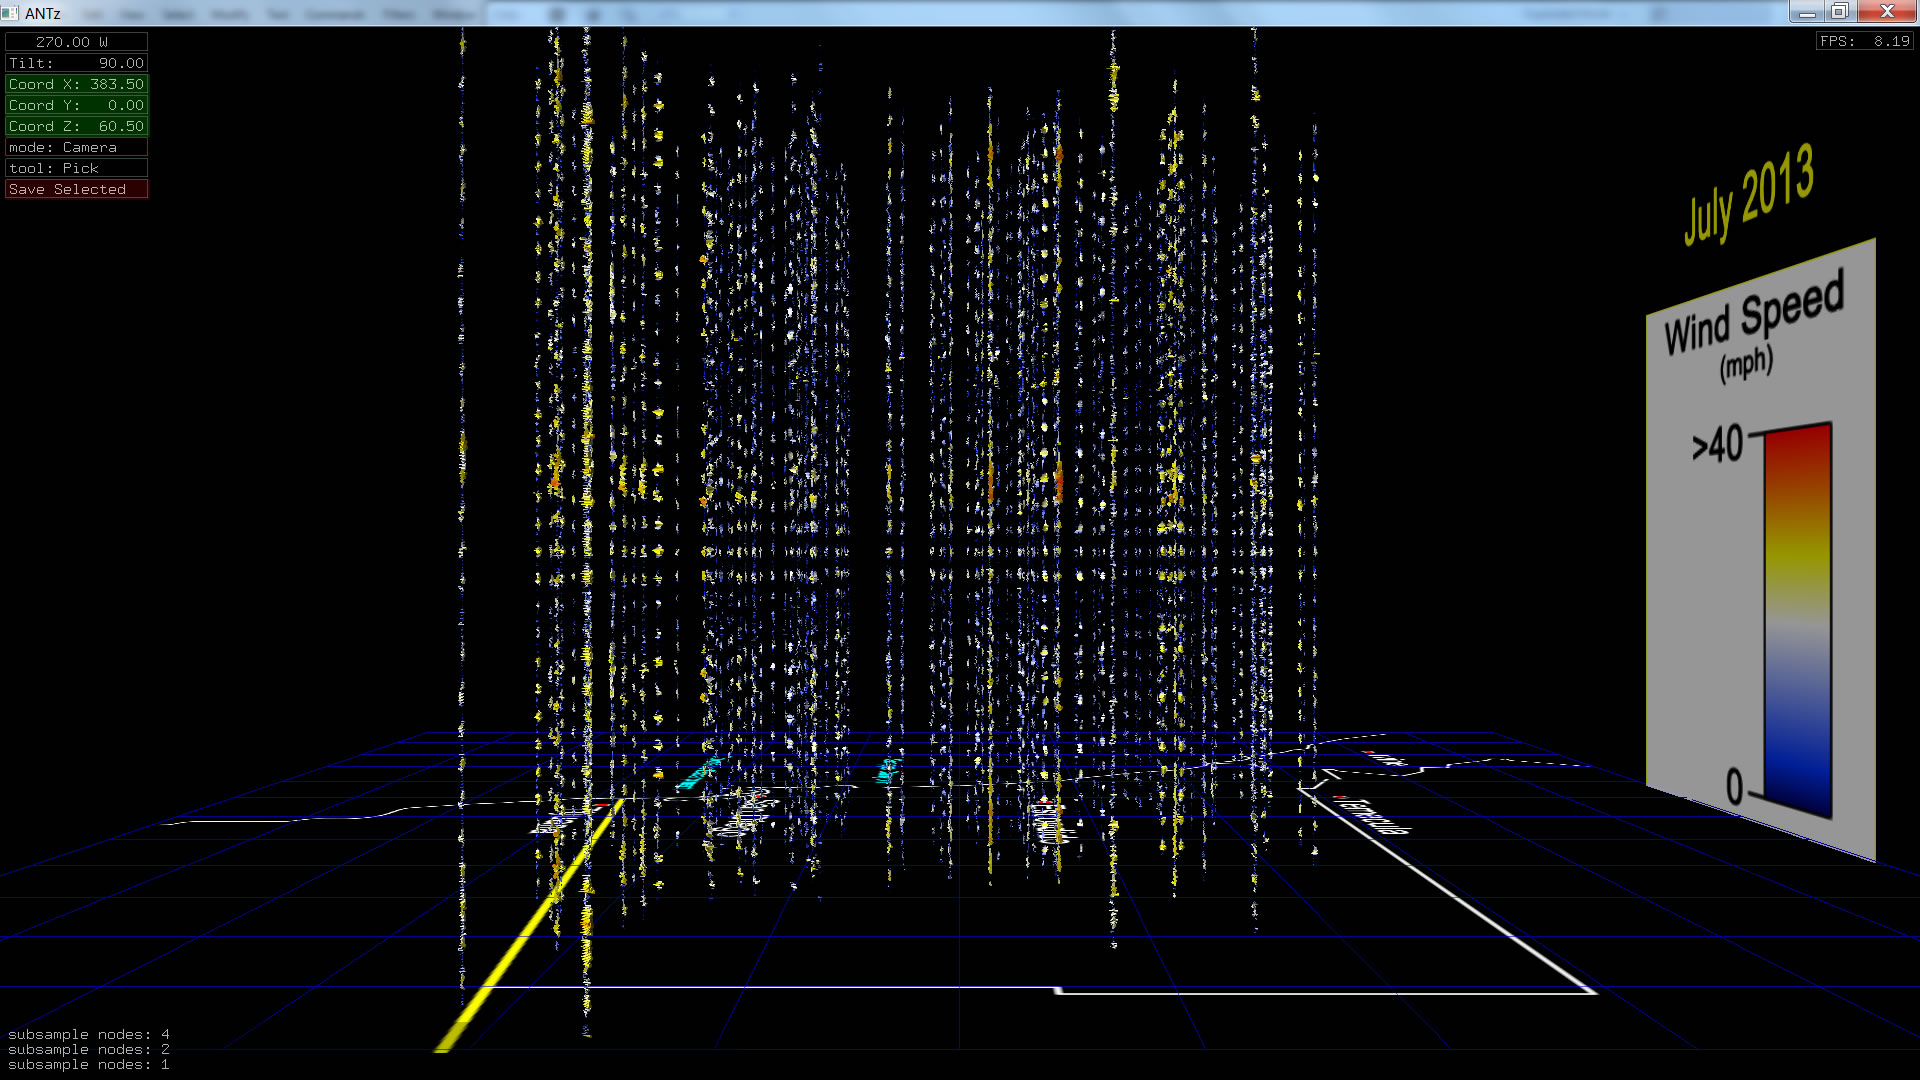
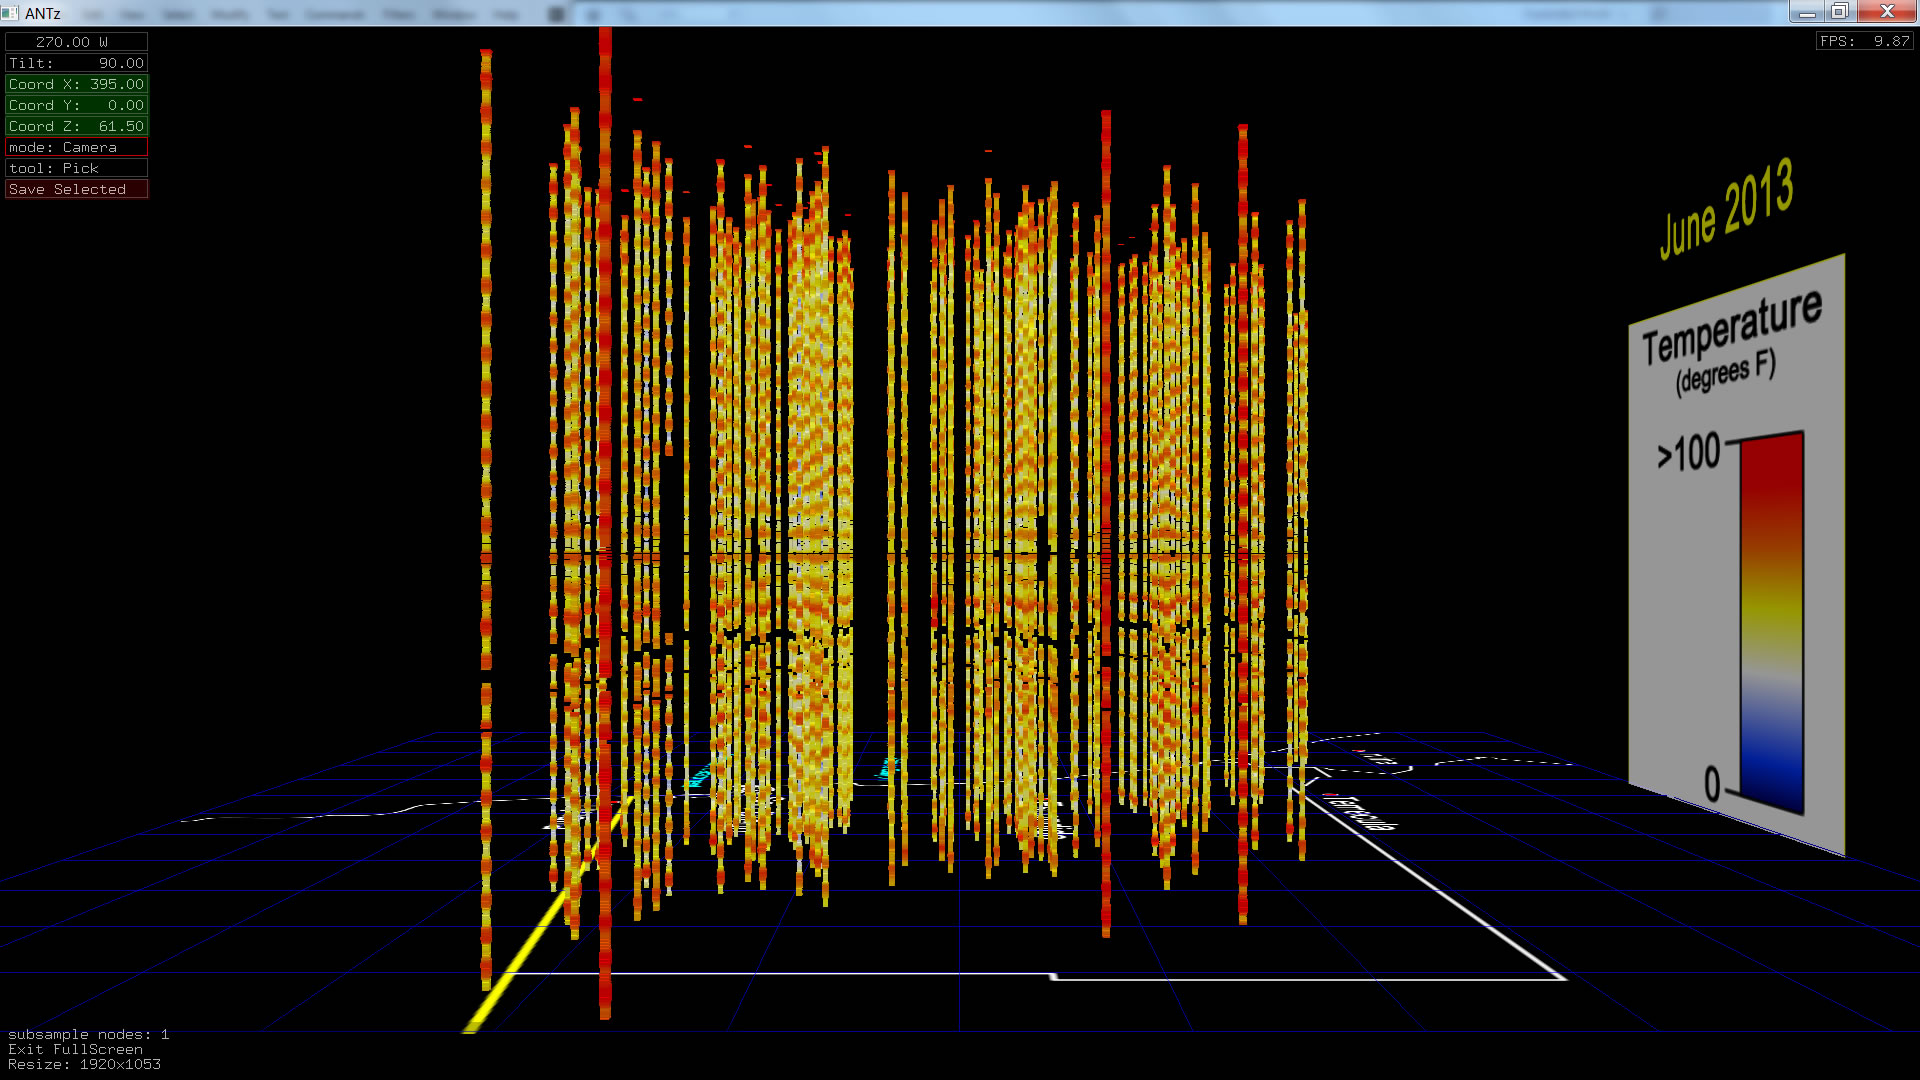
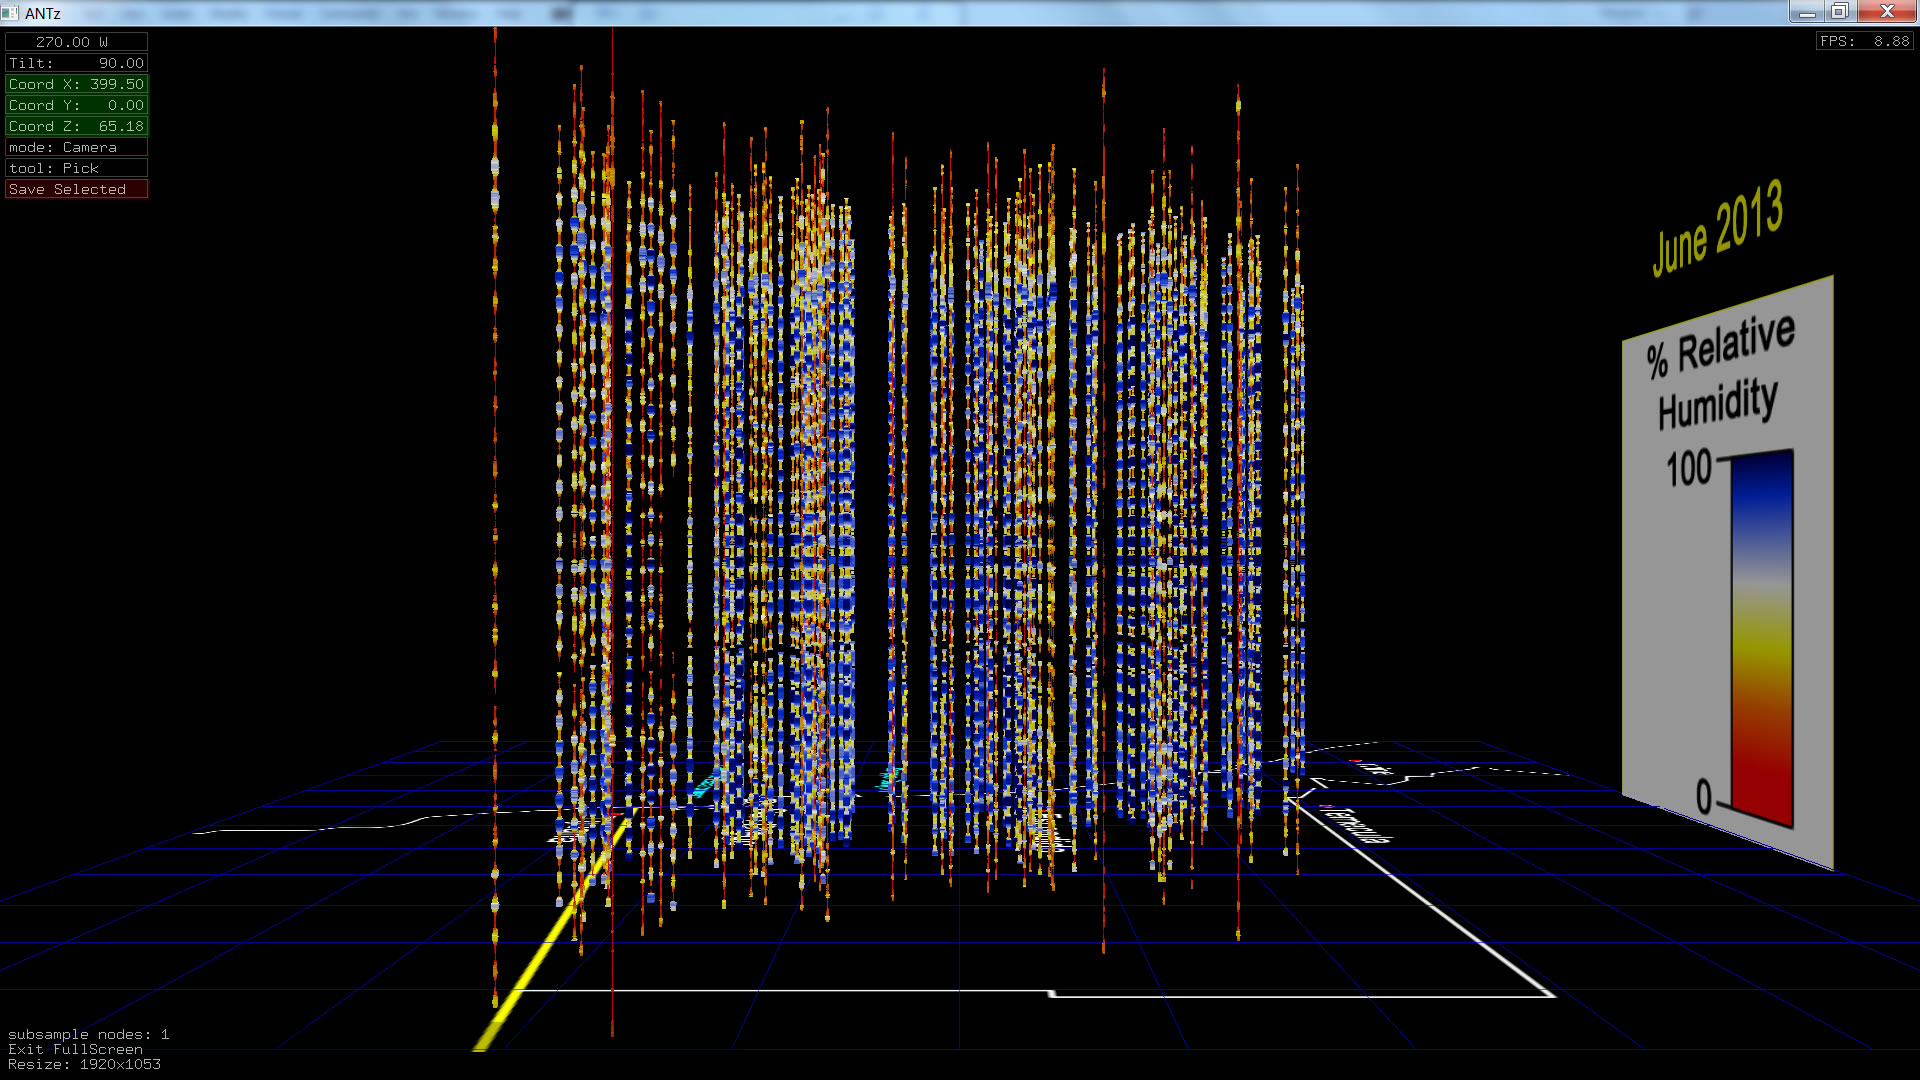
Visualization of HPWREN-SDGE Weather Station Data
| Temperature | Relative Humidity | Dew Point | Wind Speed/Direction | |
September 2013 |
 |
 |
 |
 |
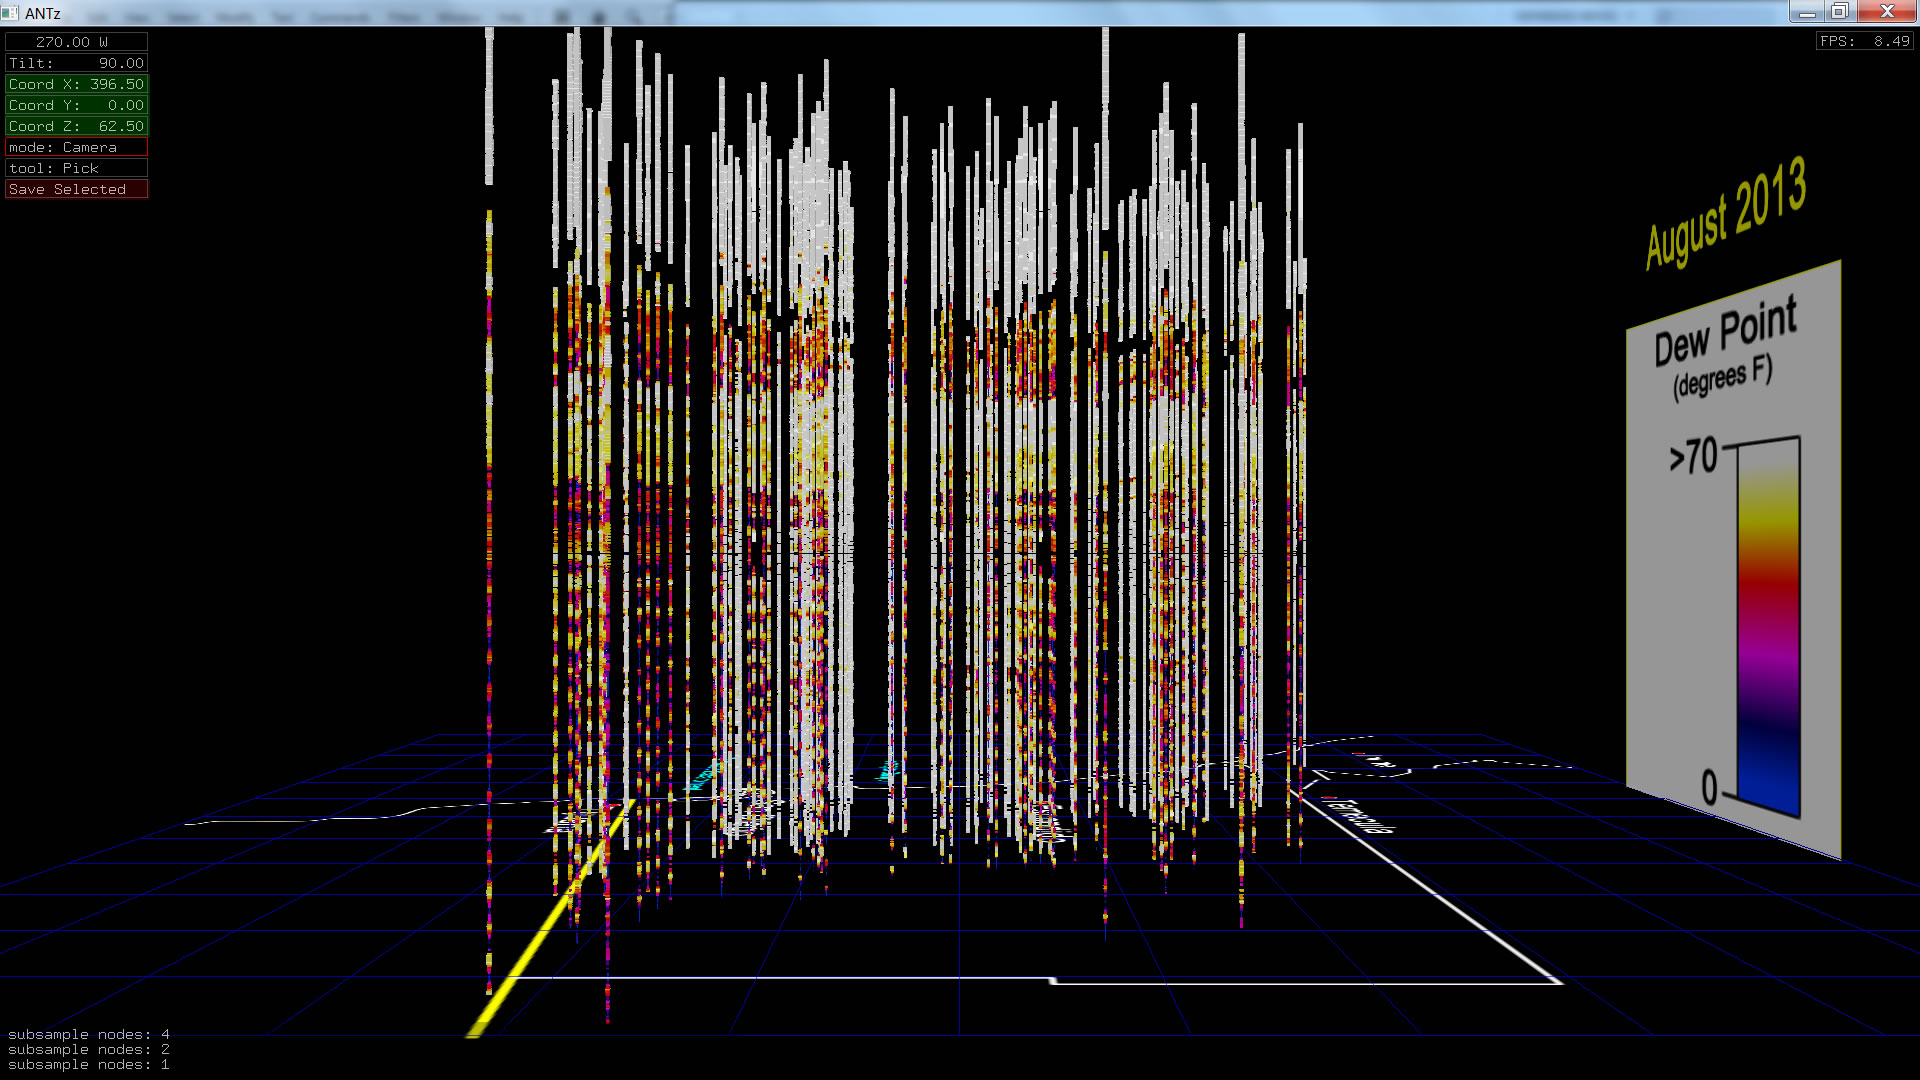
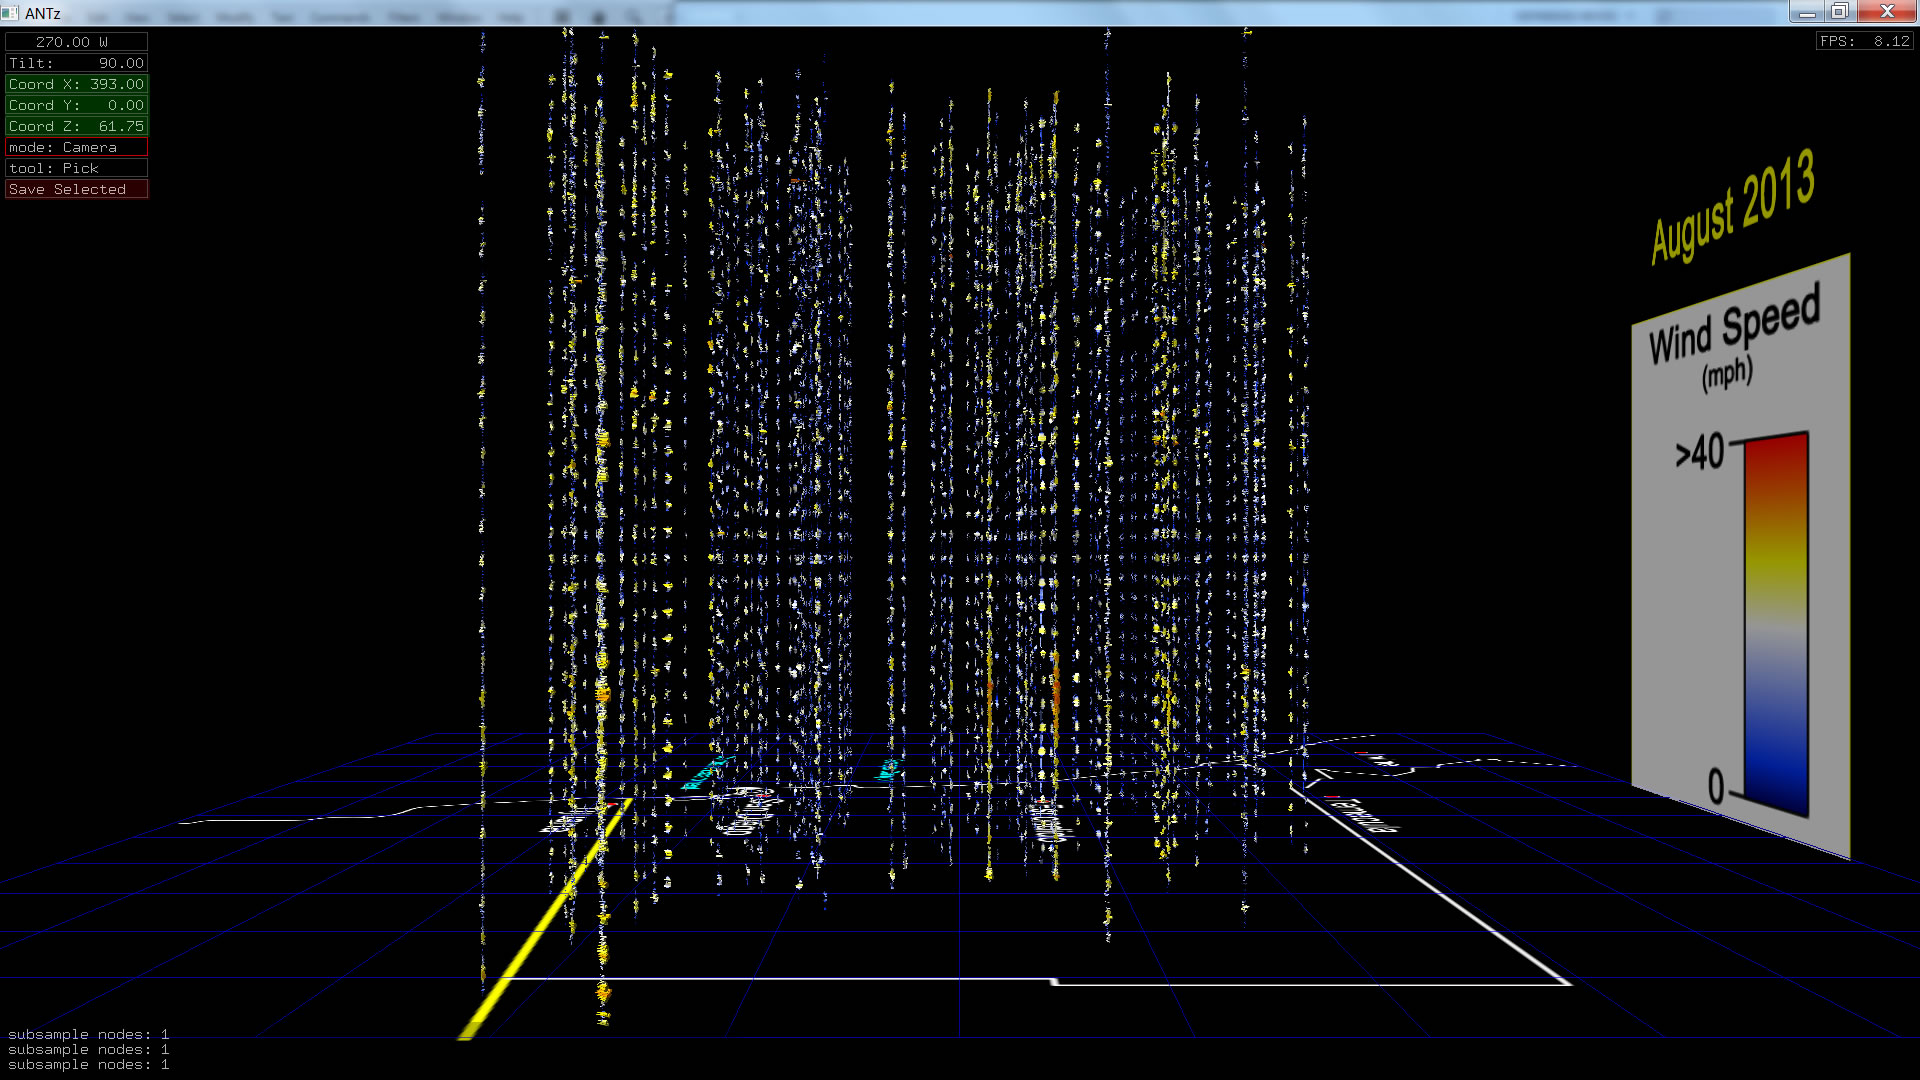
August 2013 |
 |
 |
 |
 |
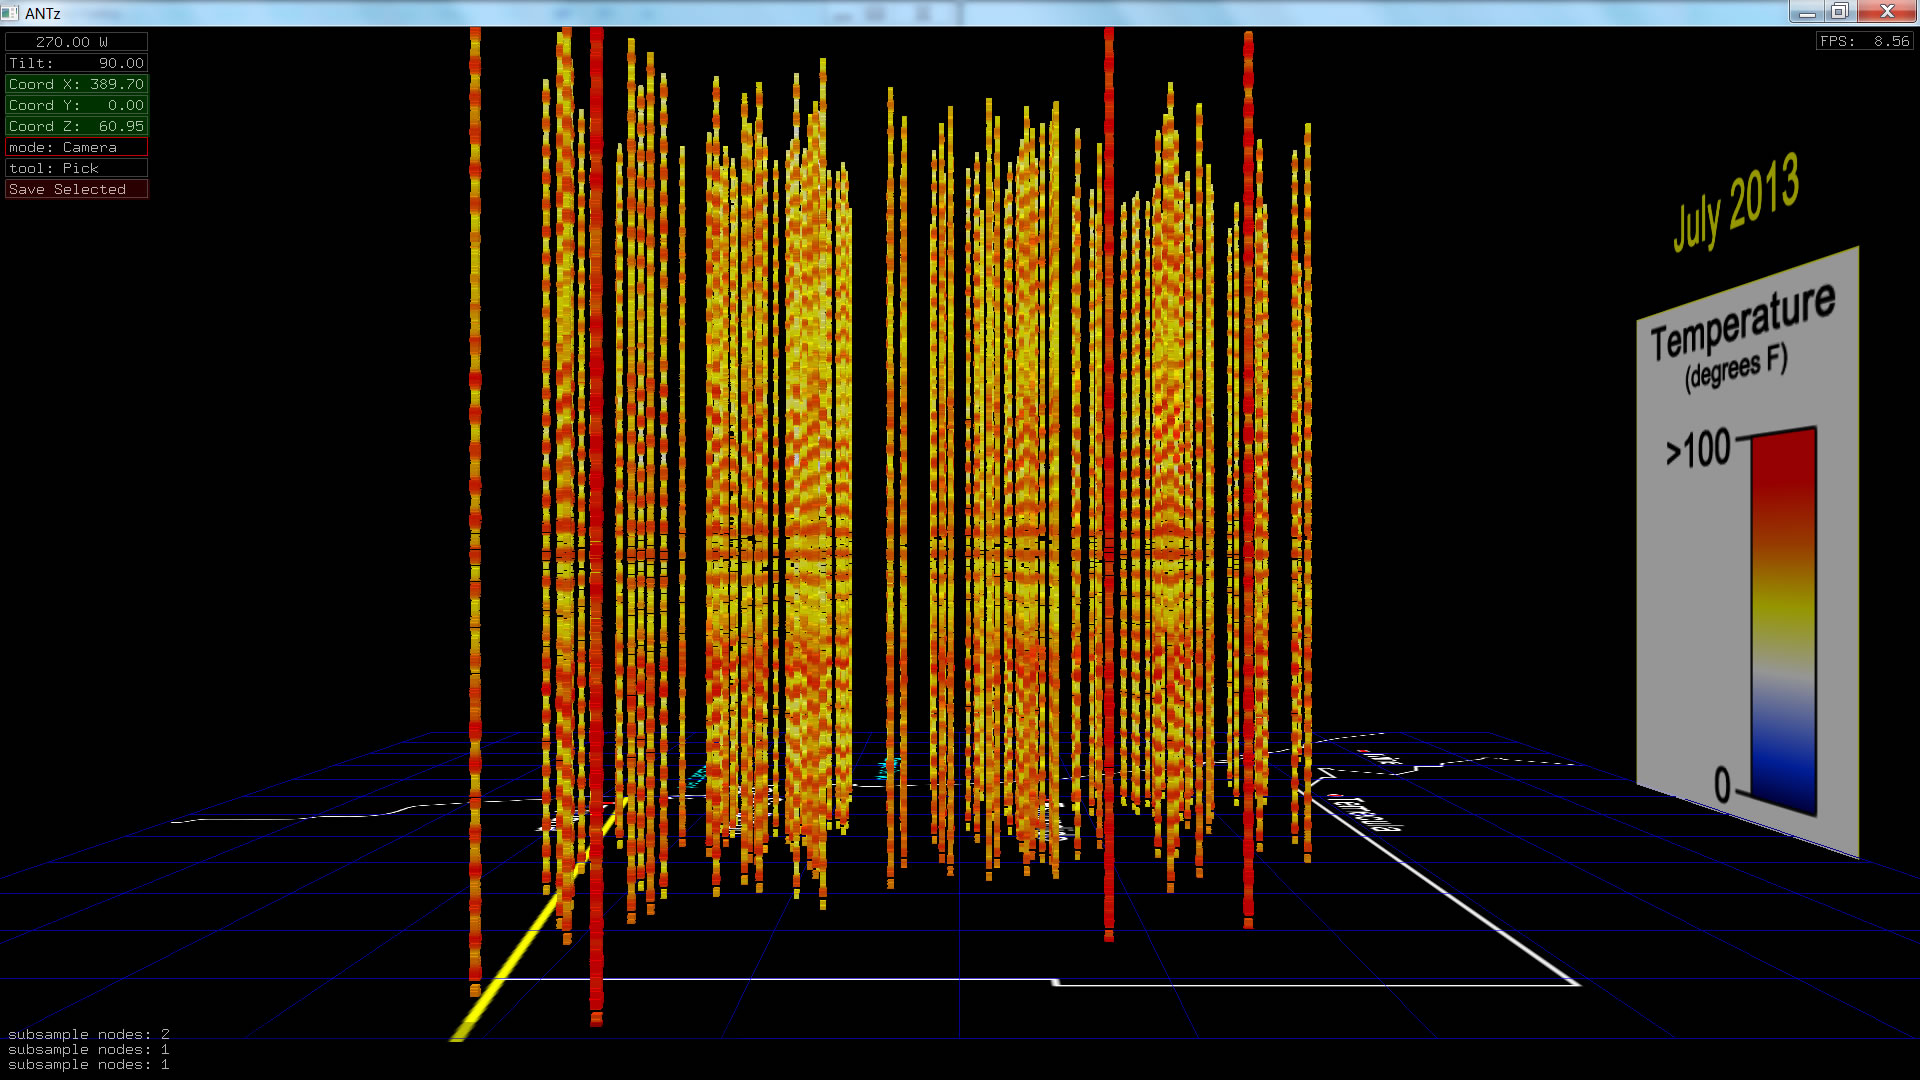
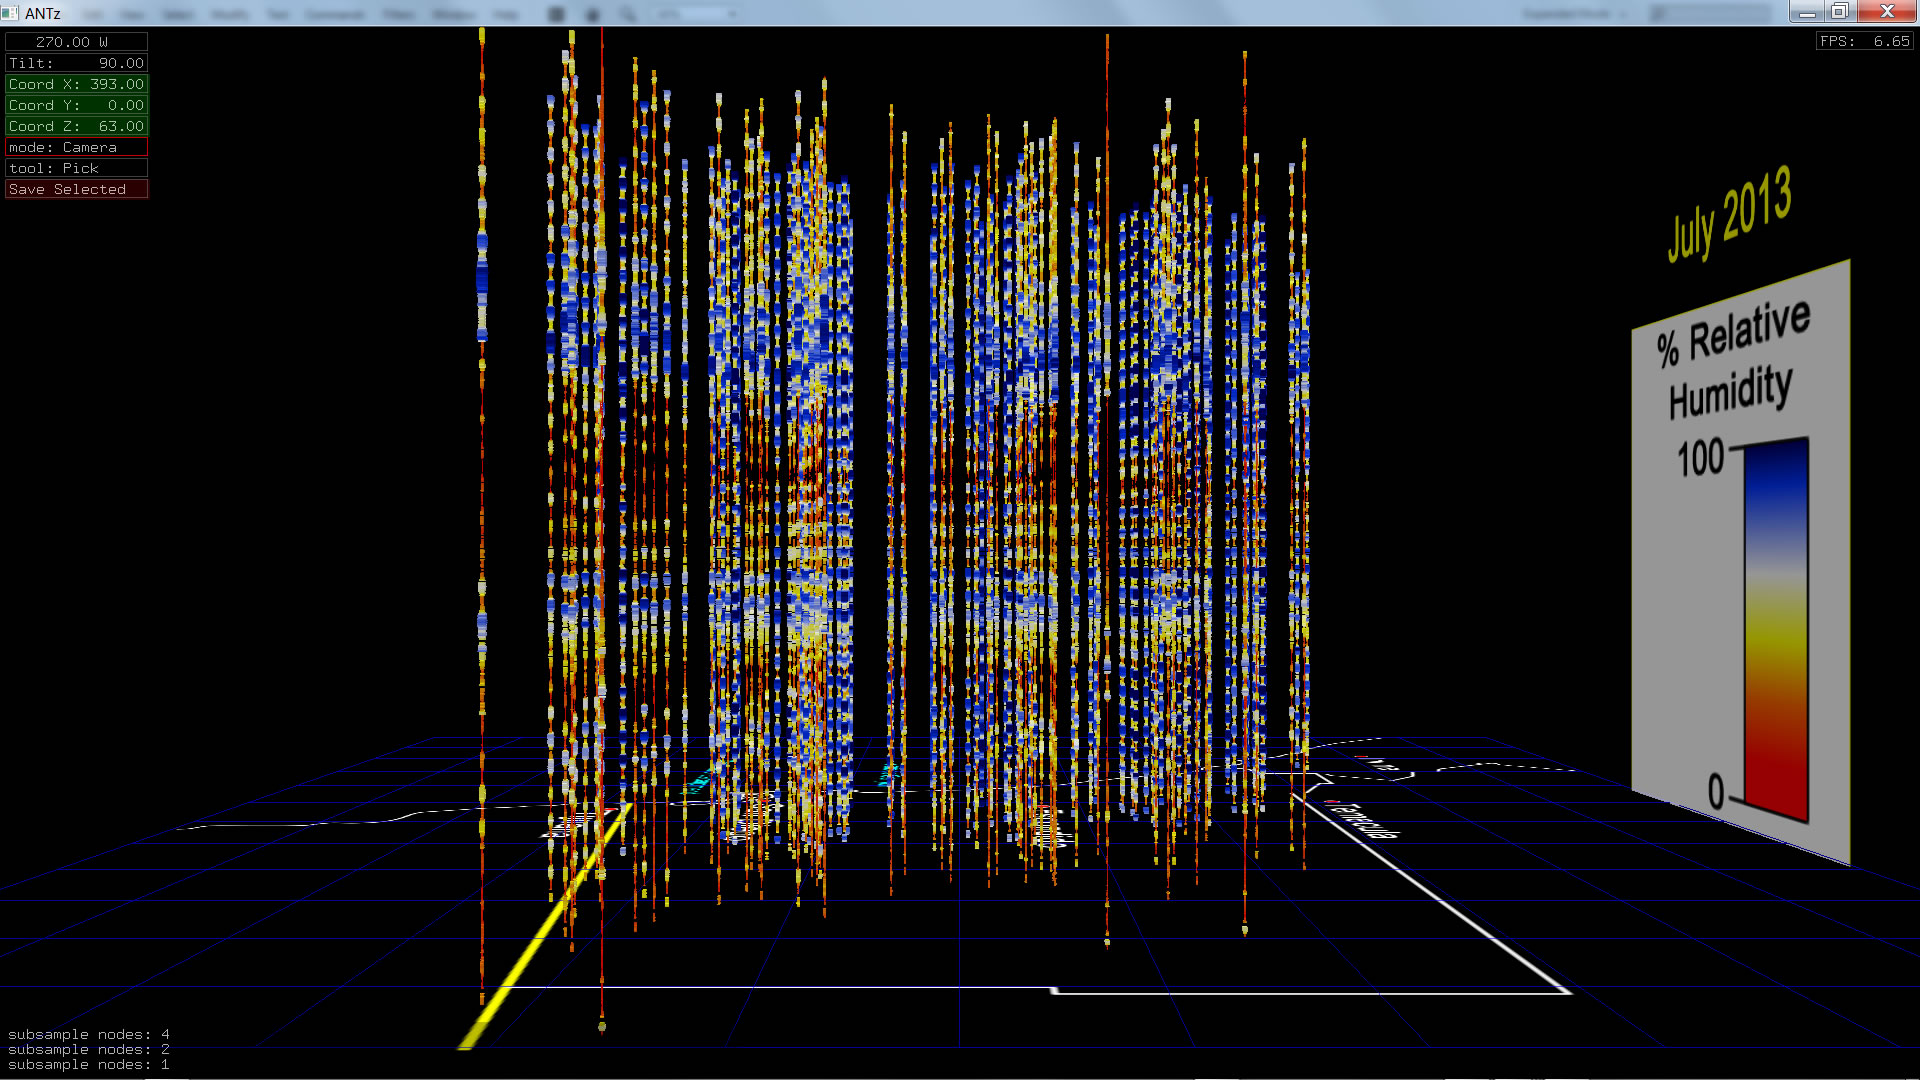
July 2013 |
 |
 |
 |
 |
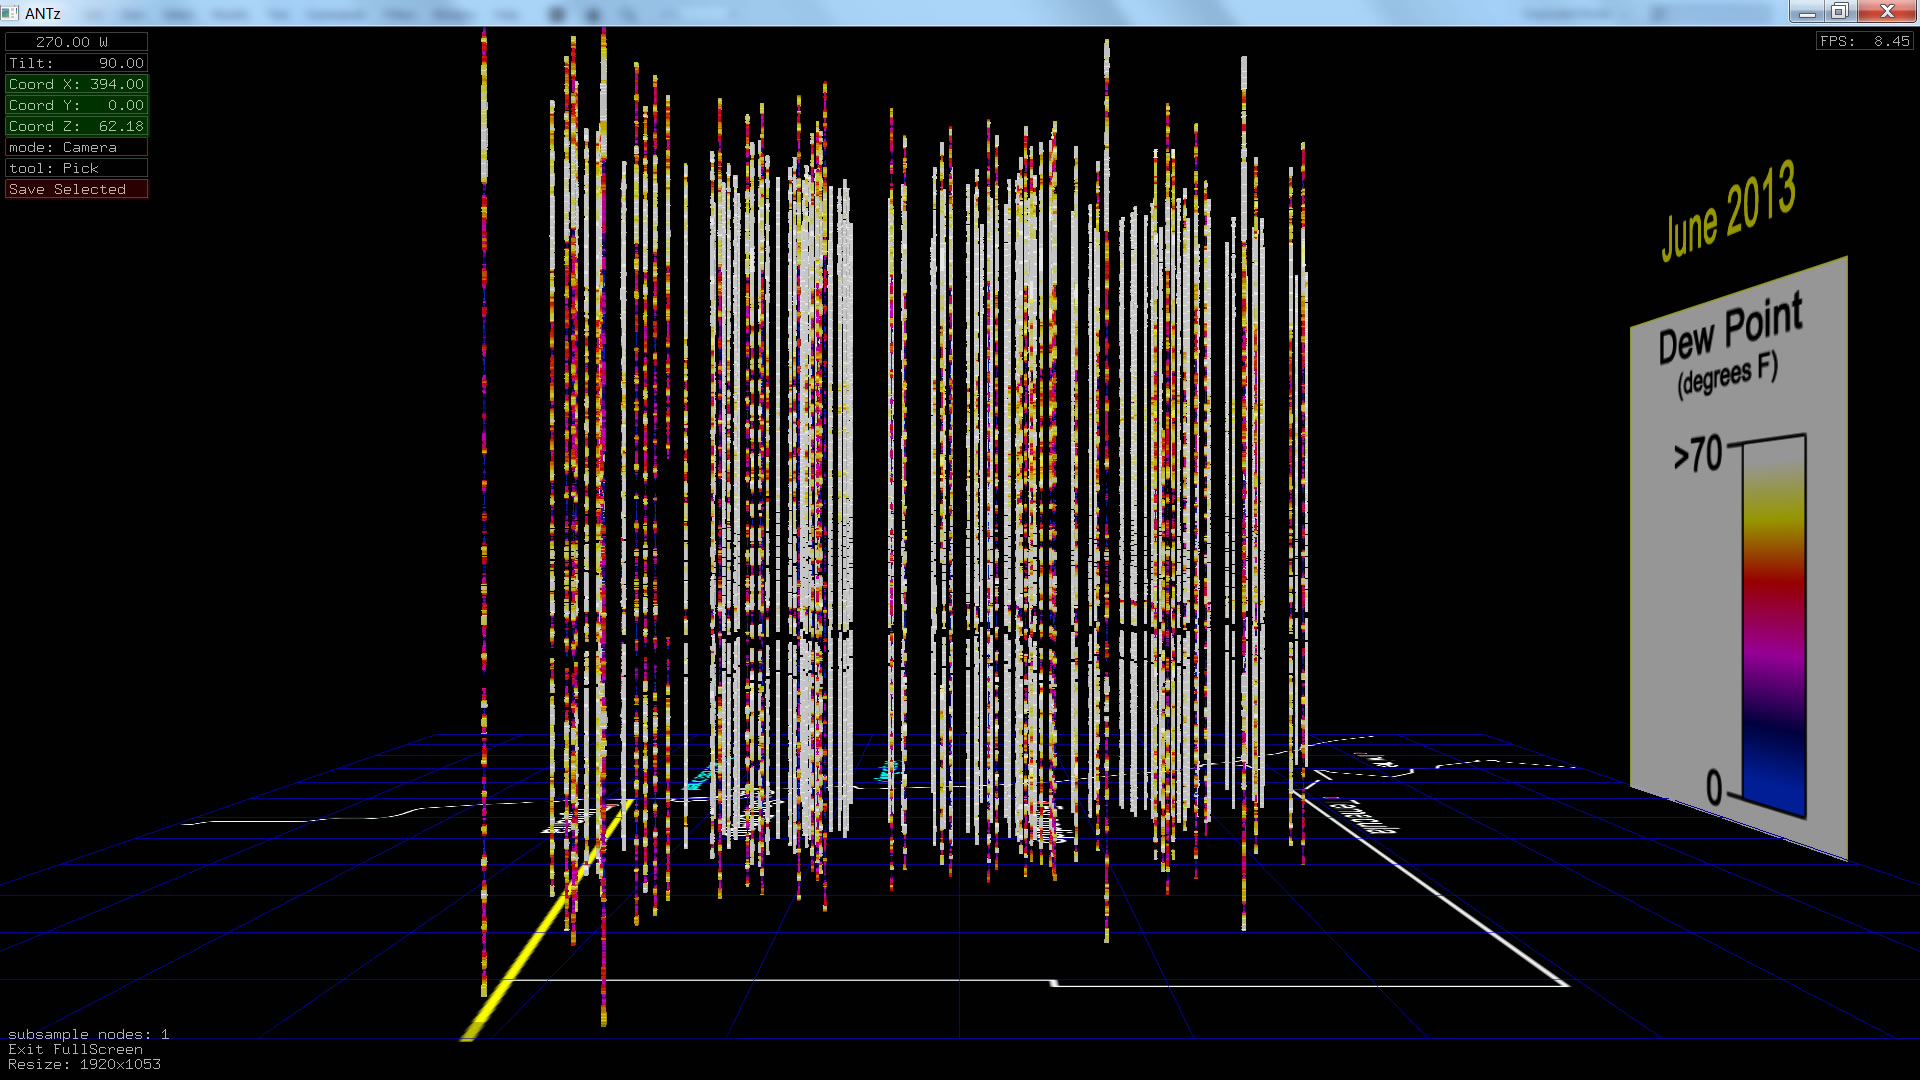
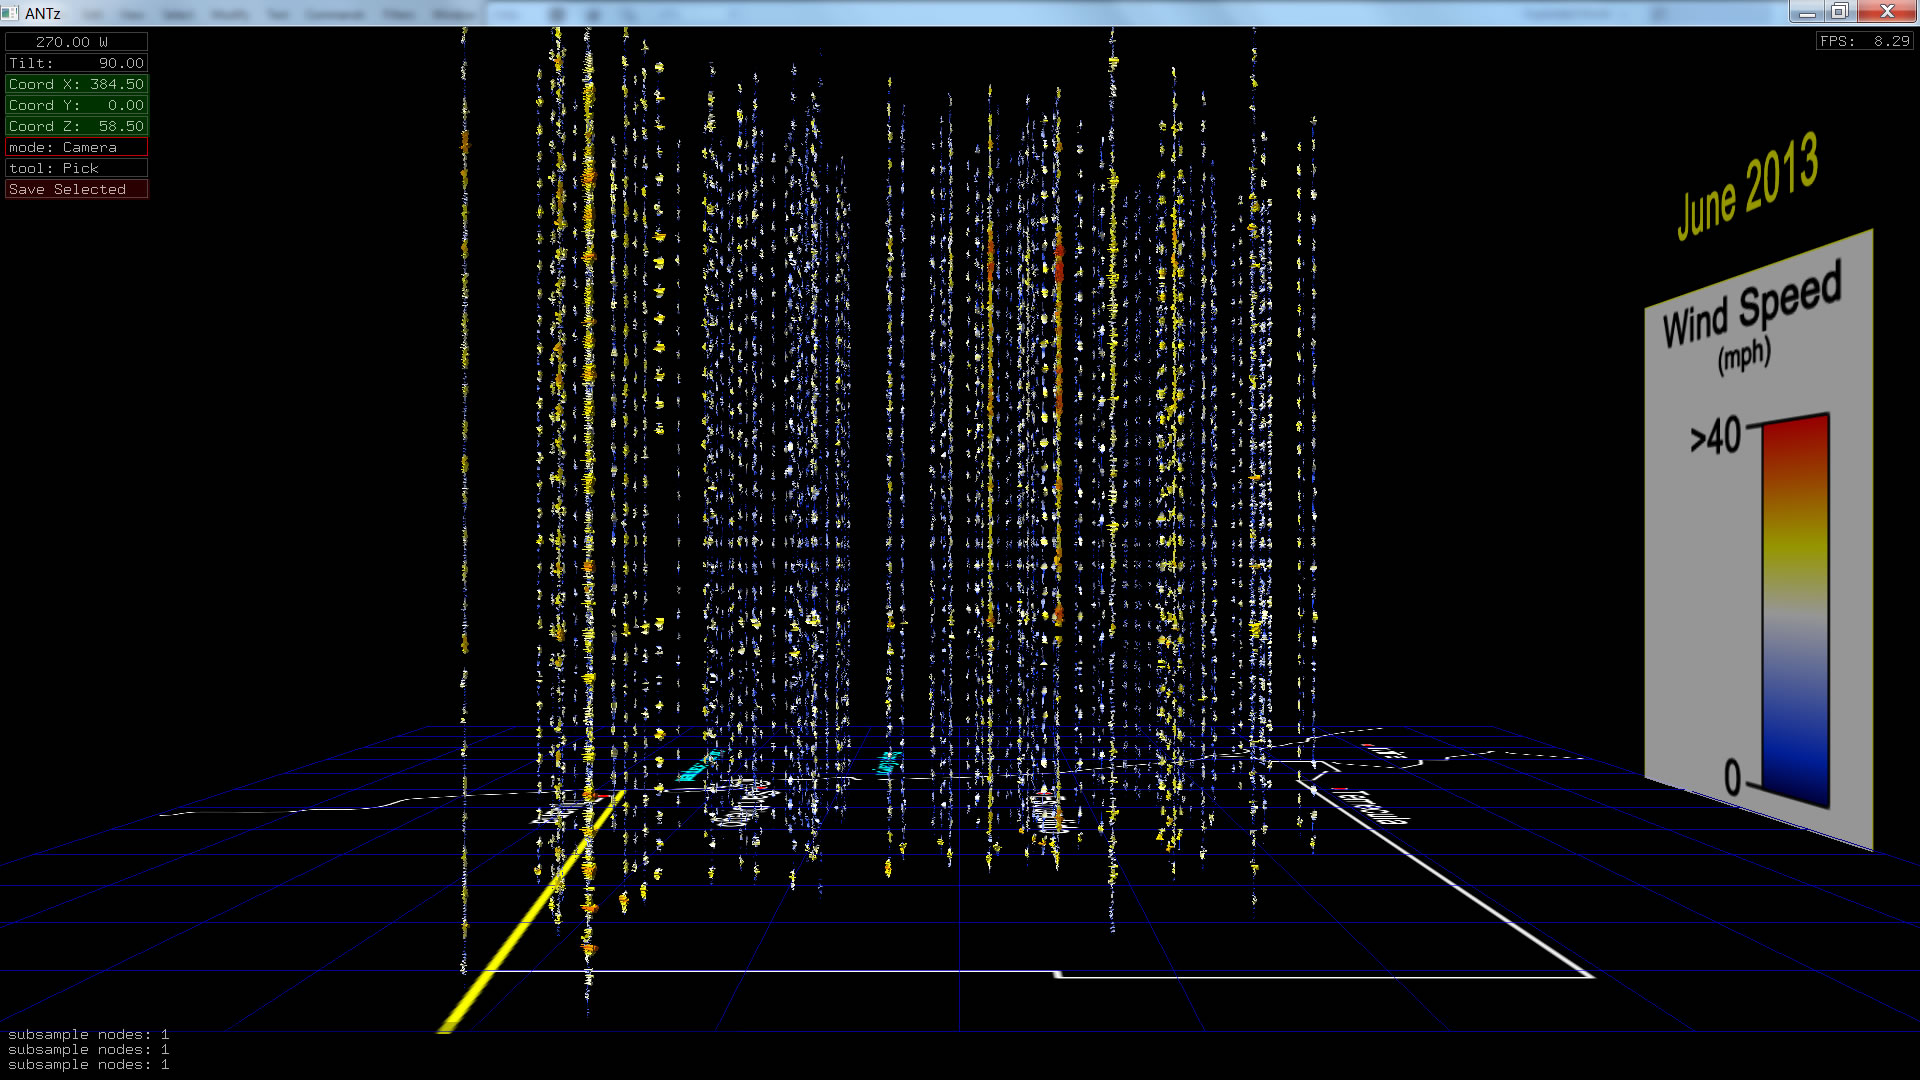
June 2013 |
 |
 |
 |
 |
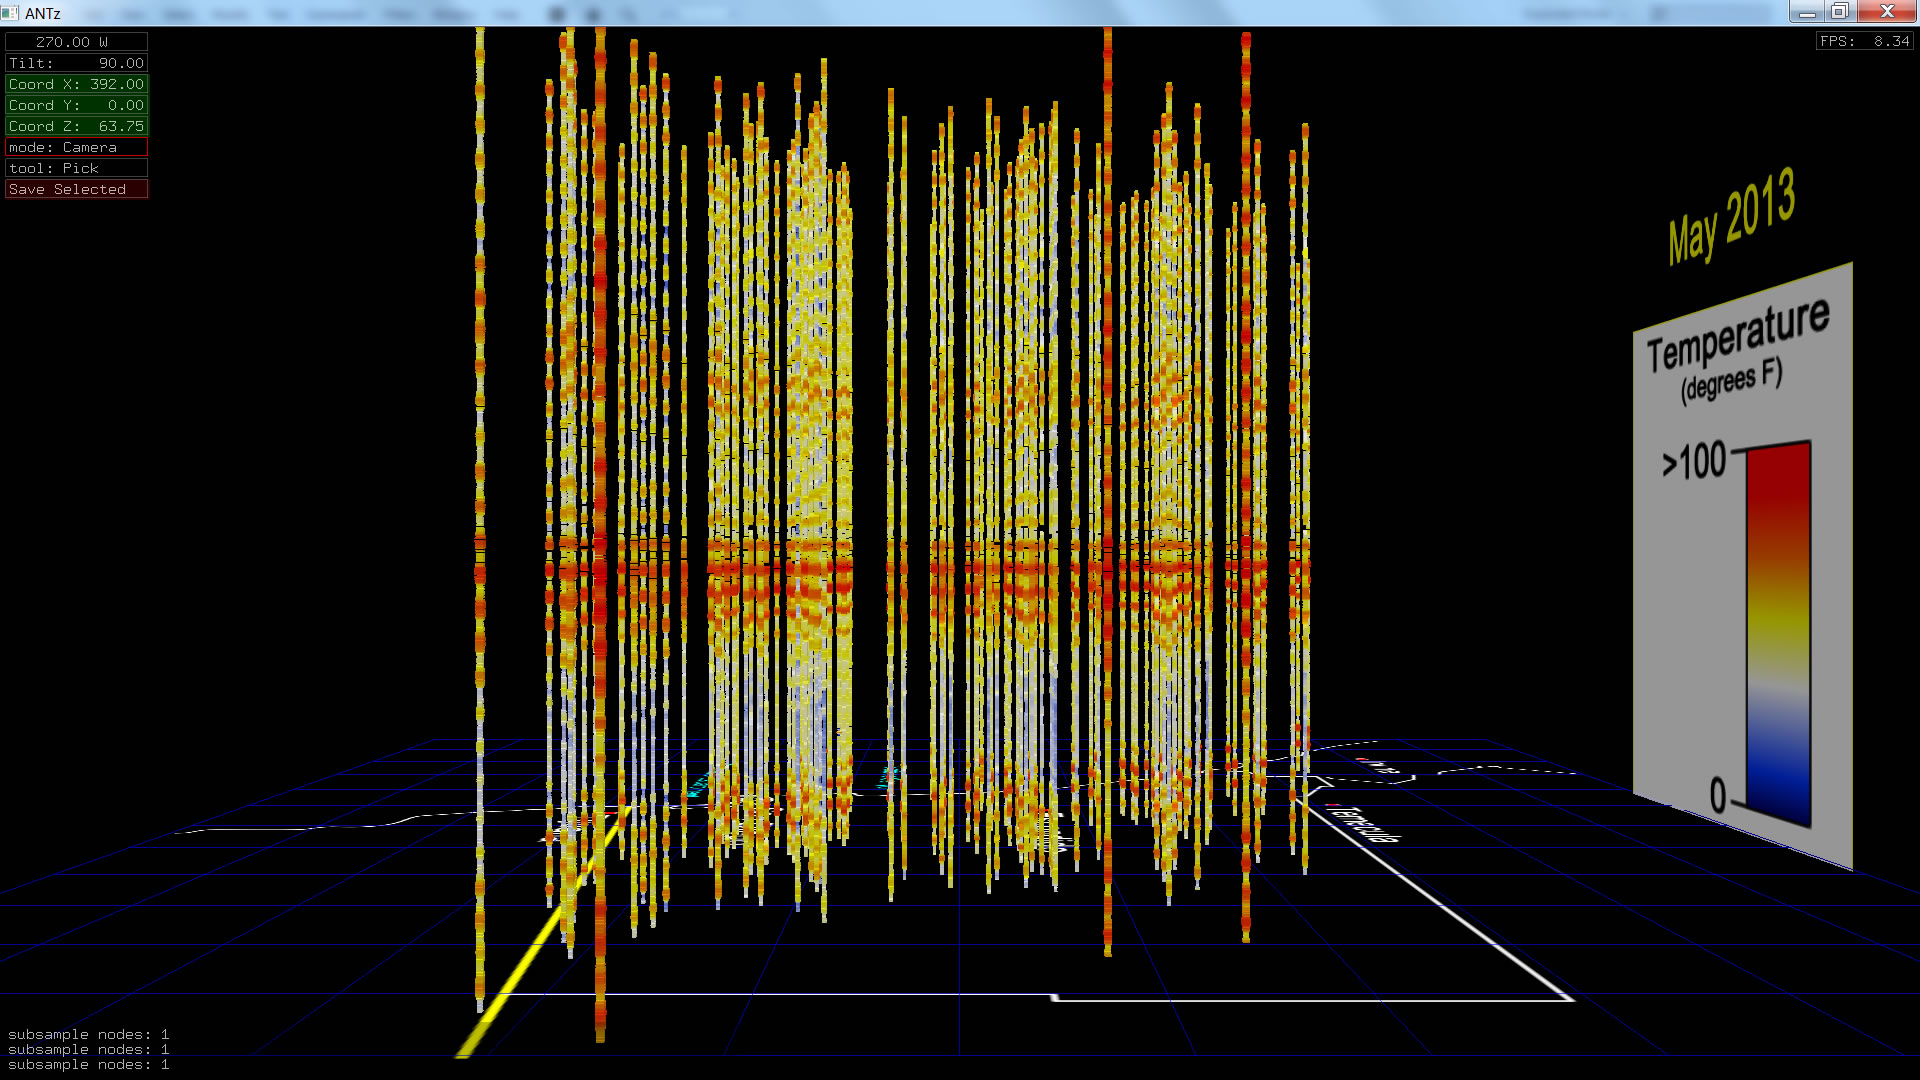
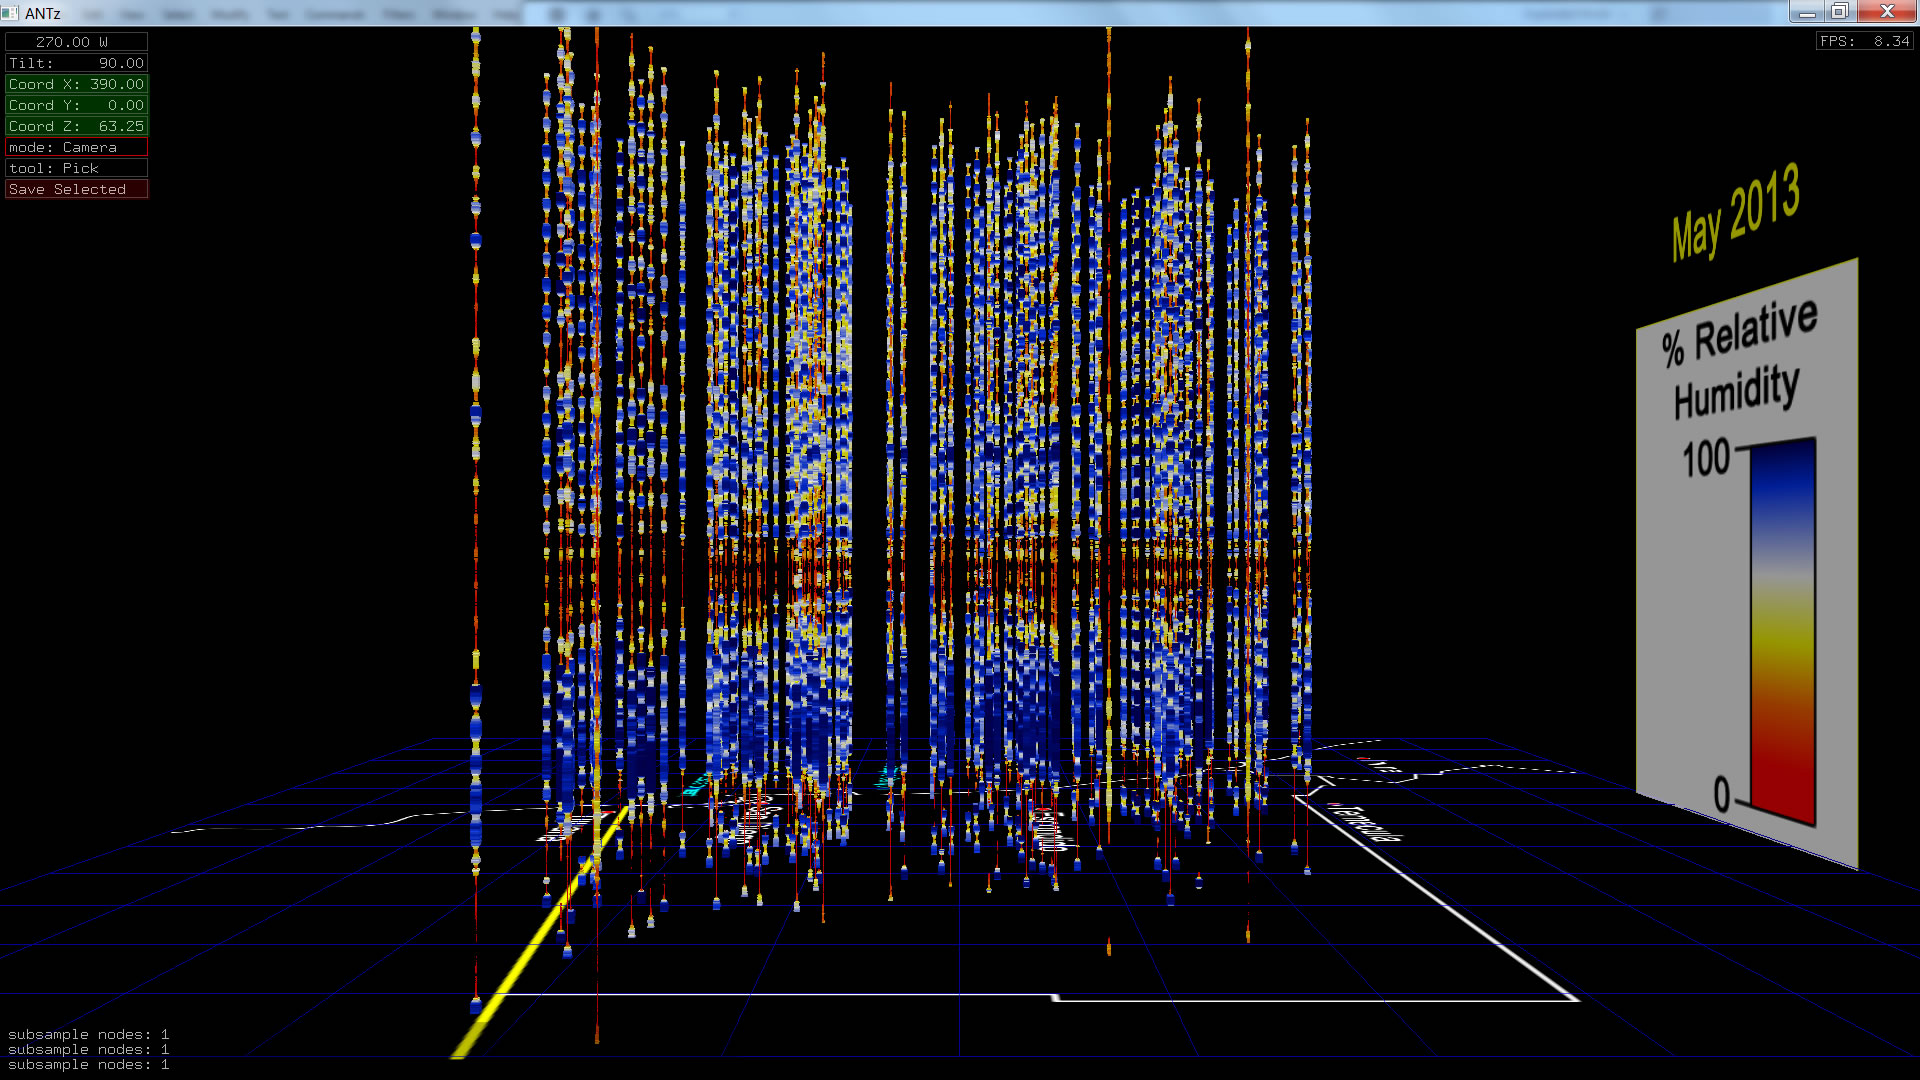
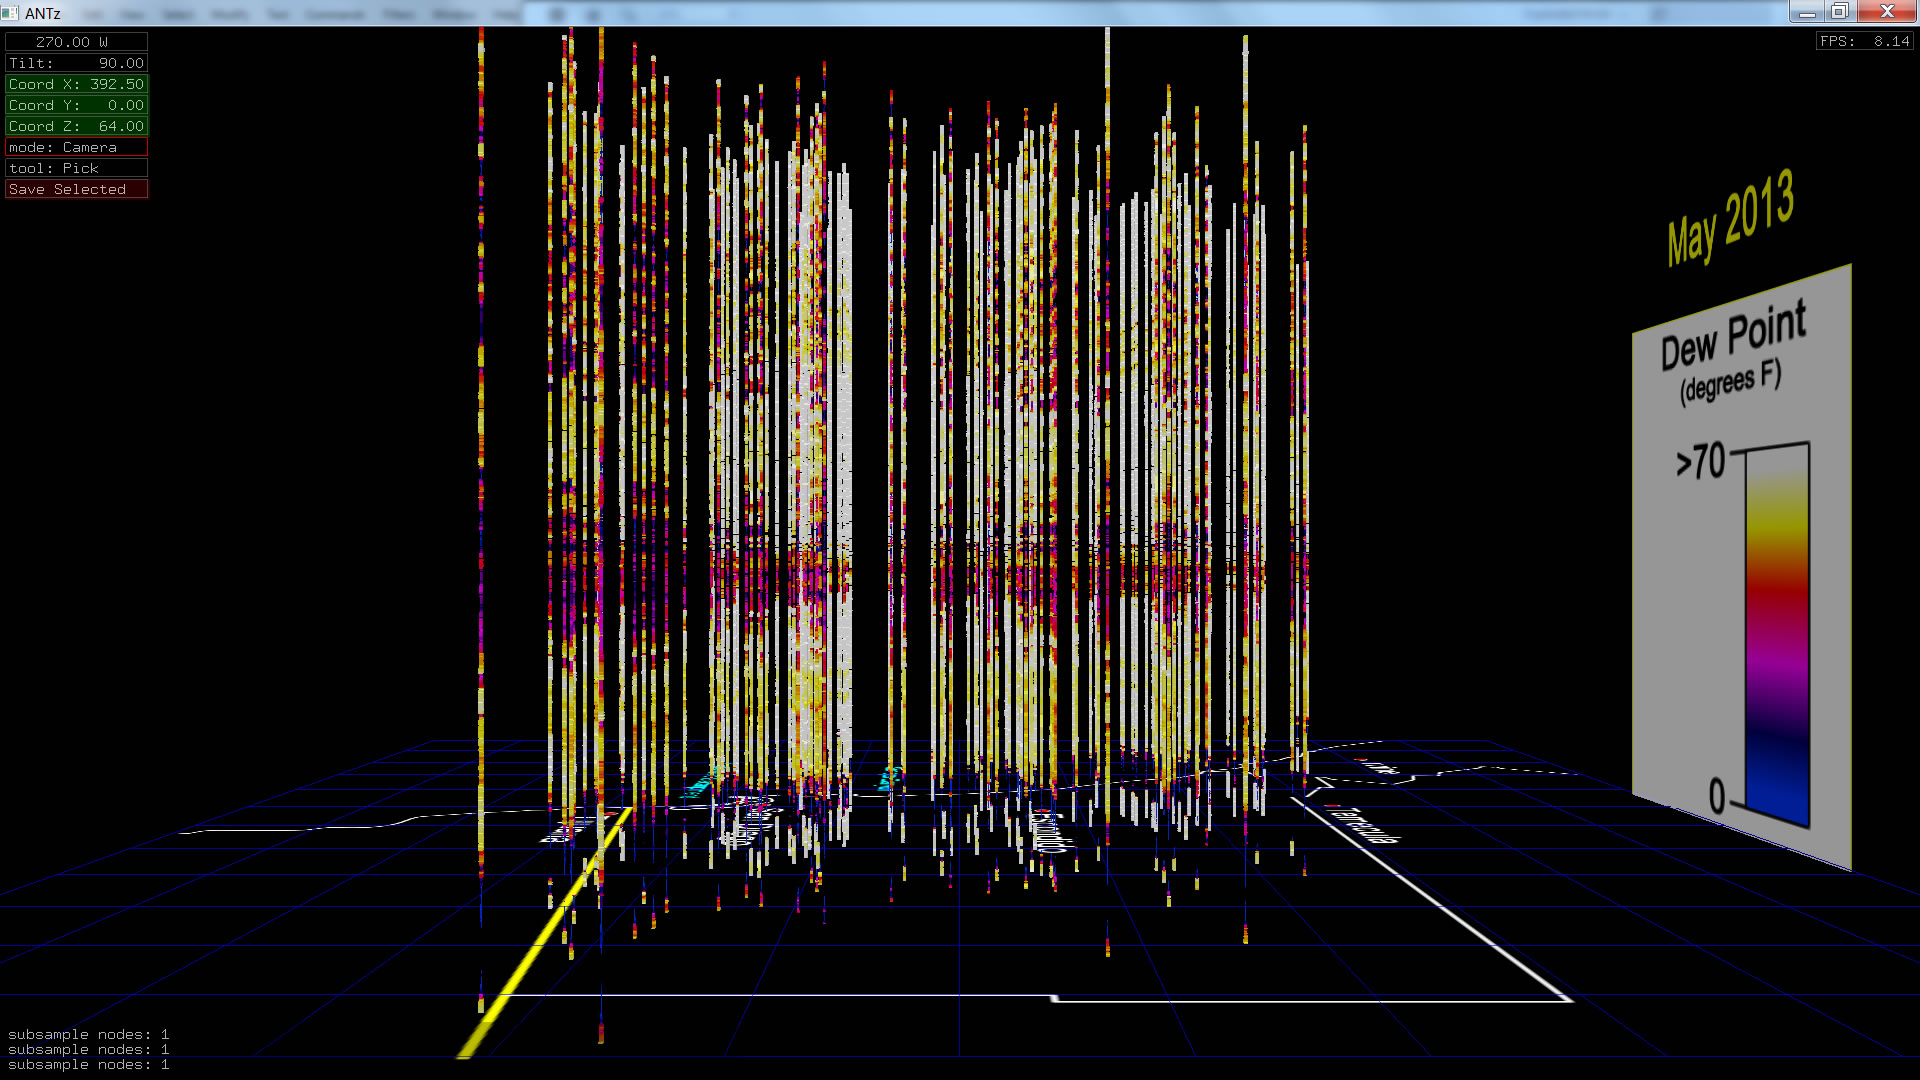
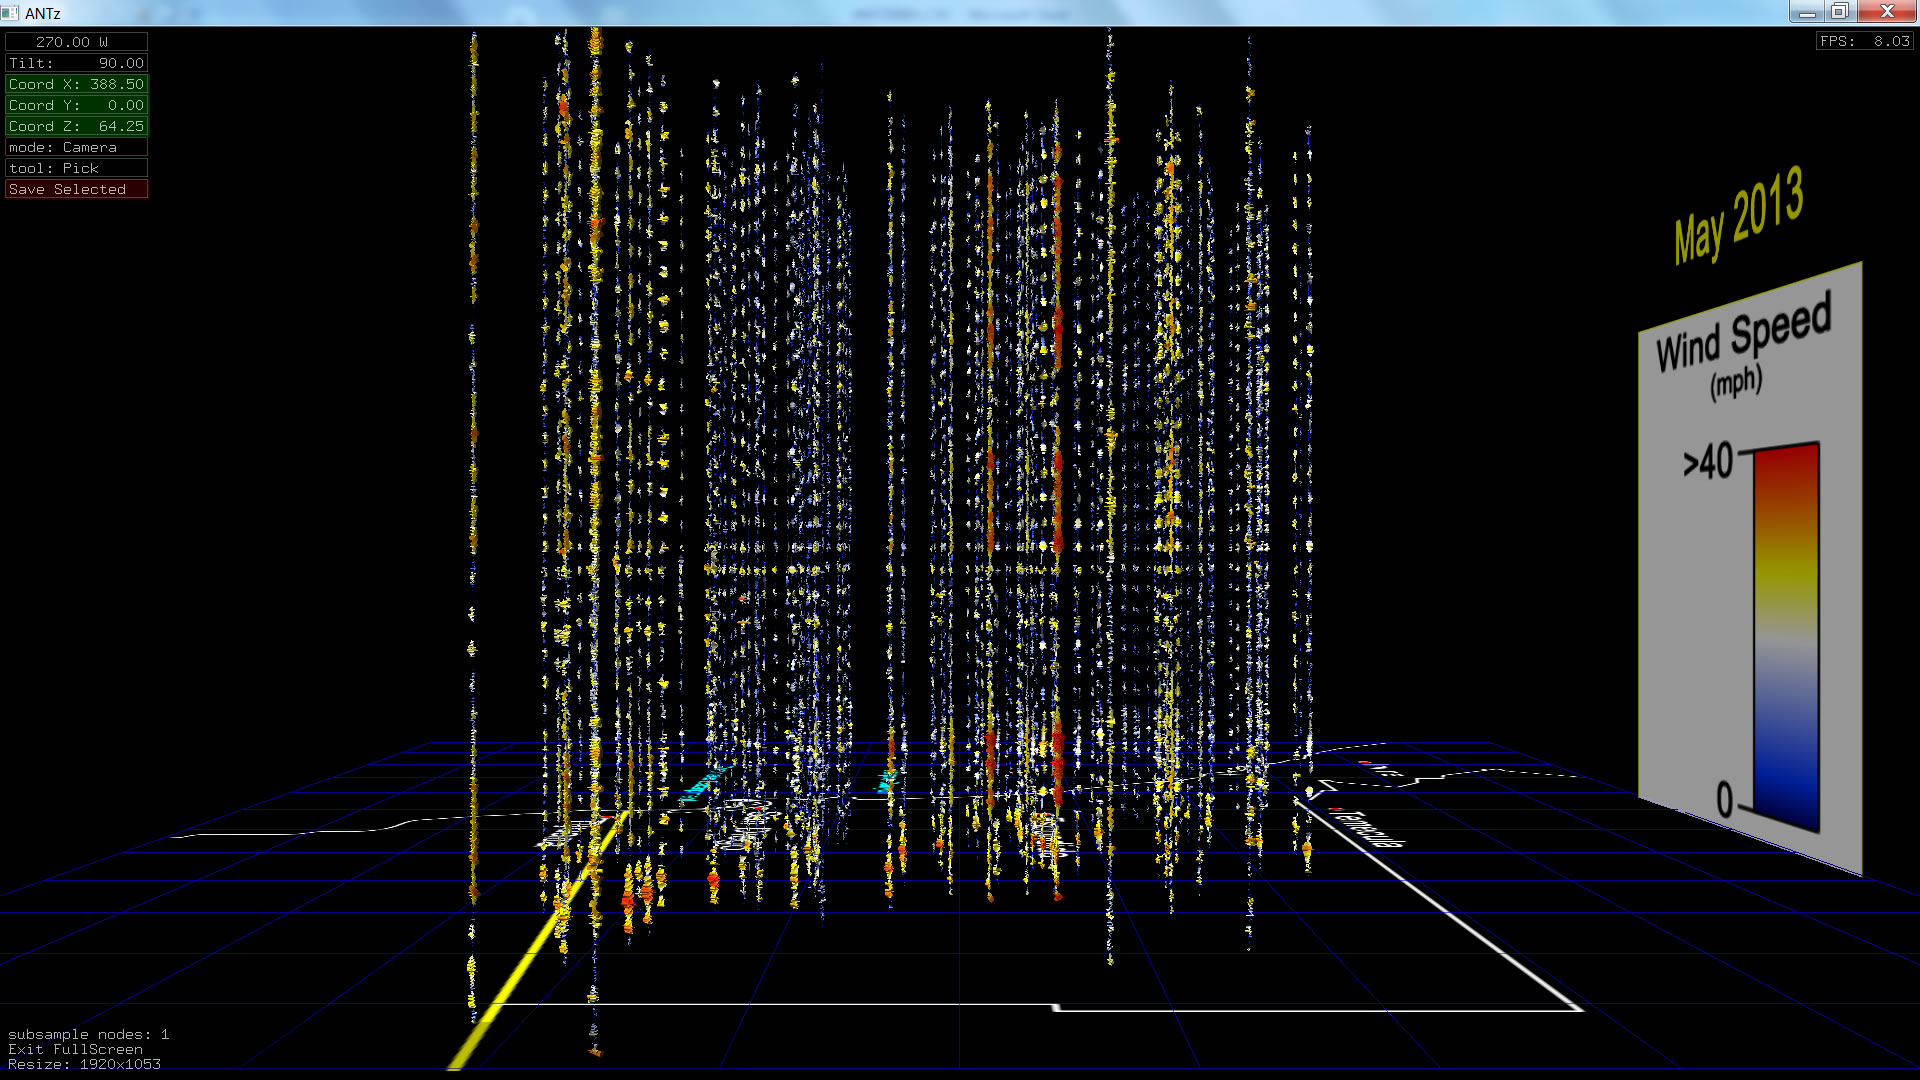
May 2013 |
 |
 |
 |
 |
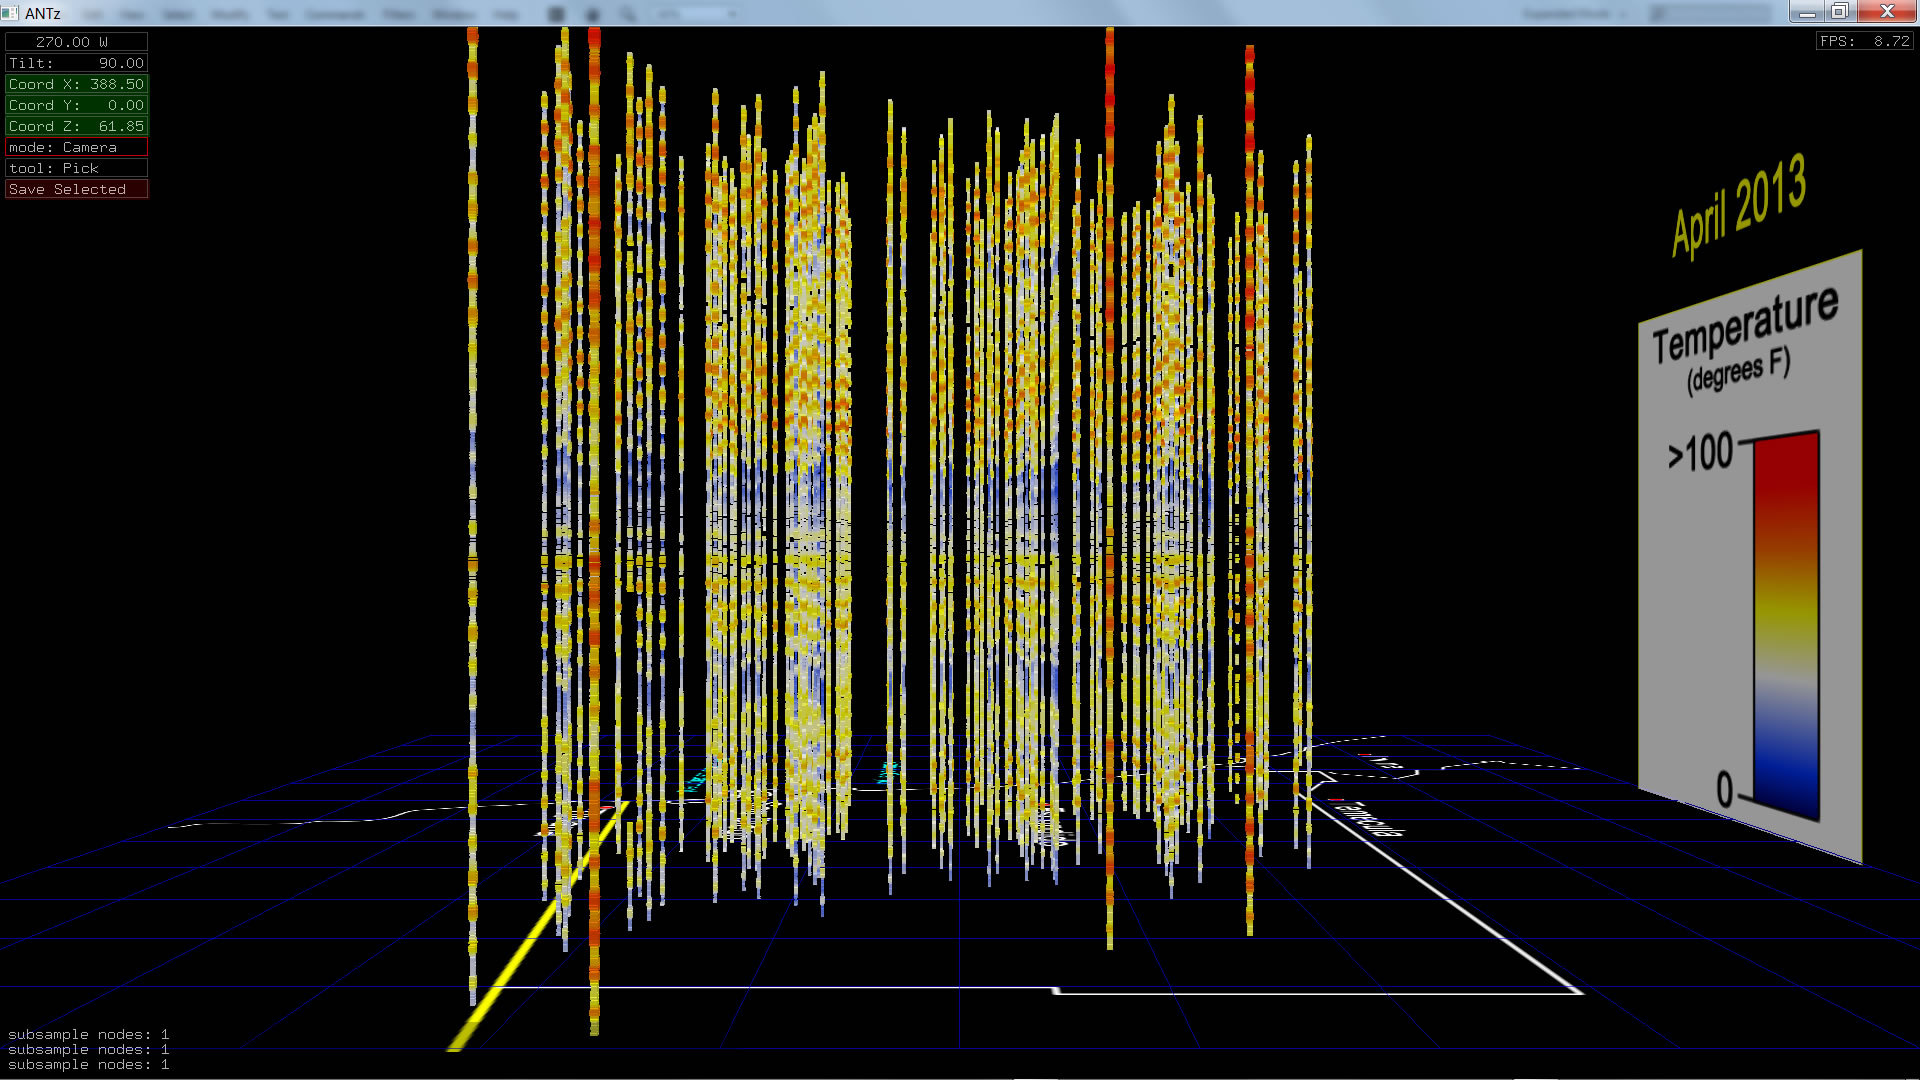
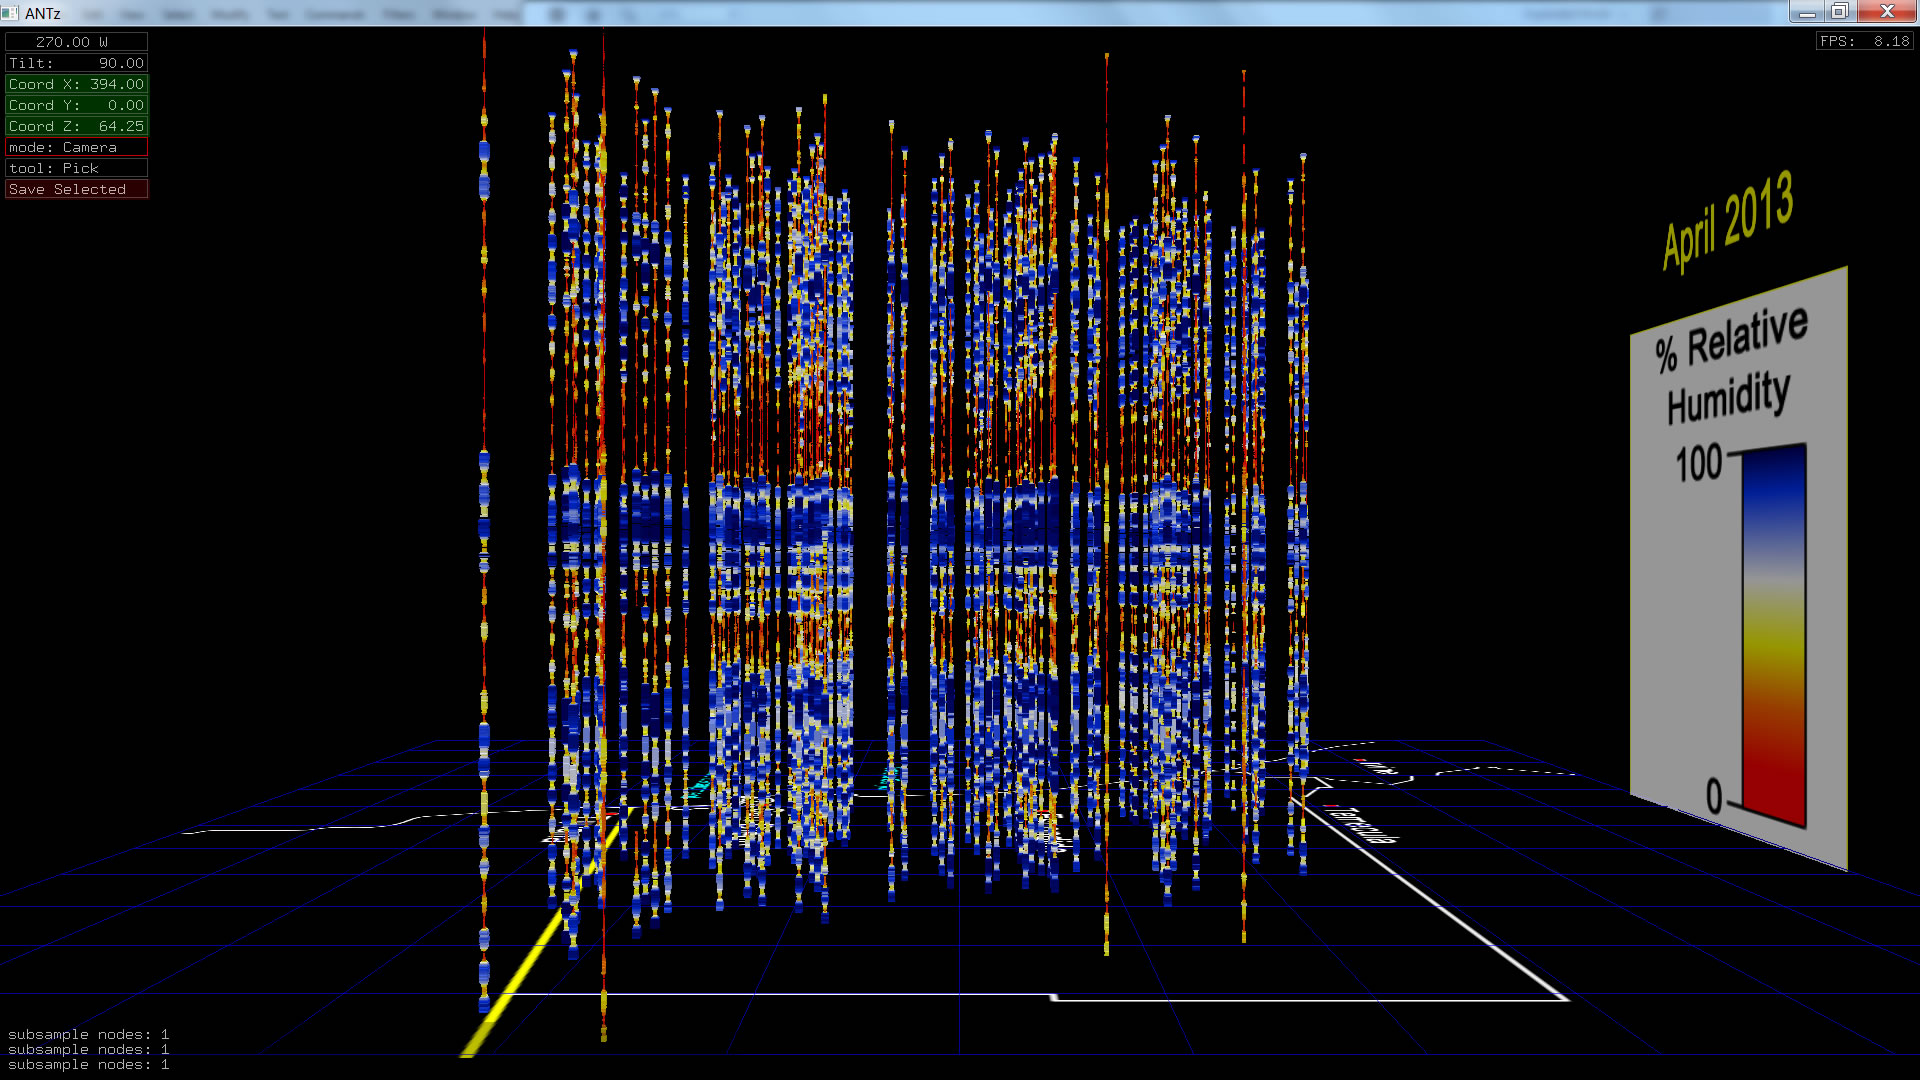
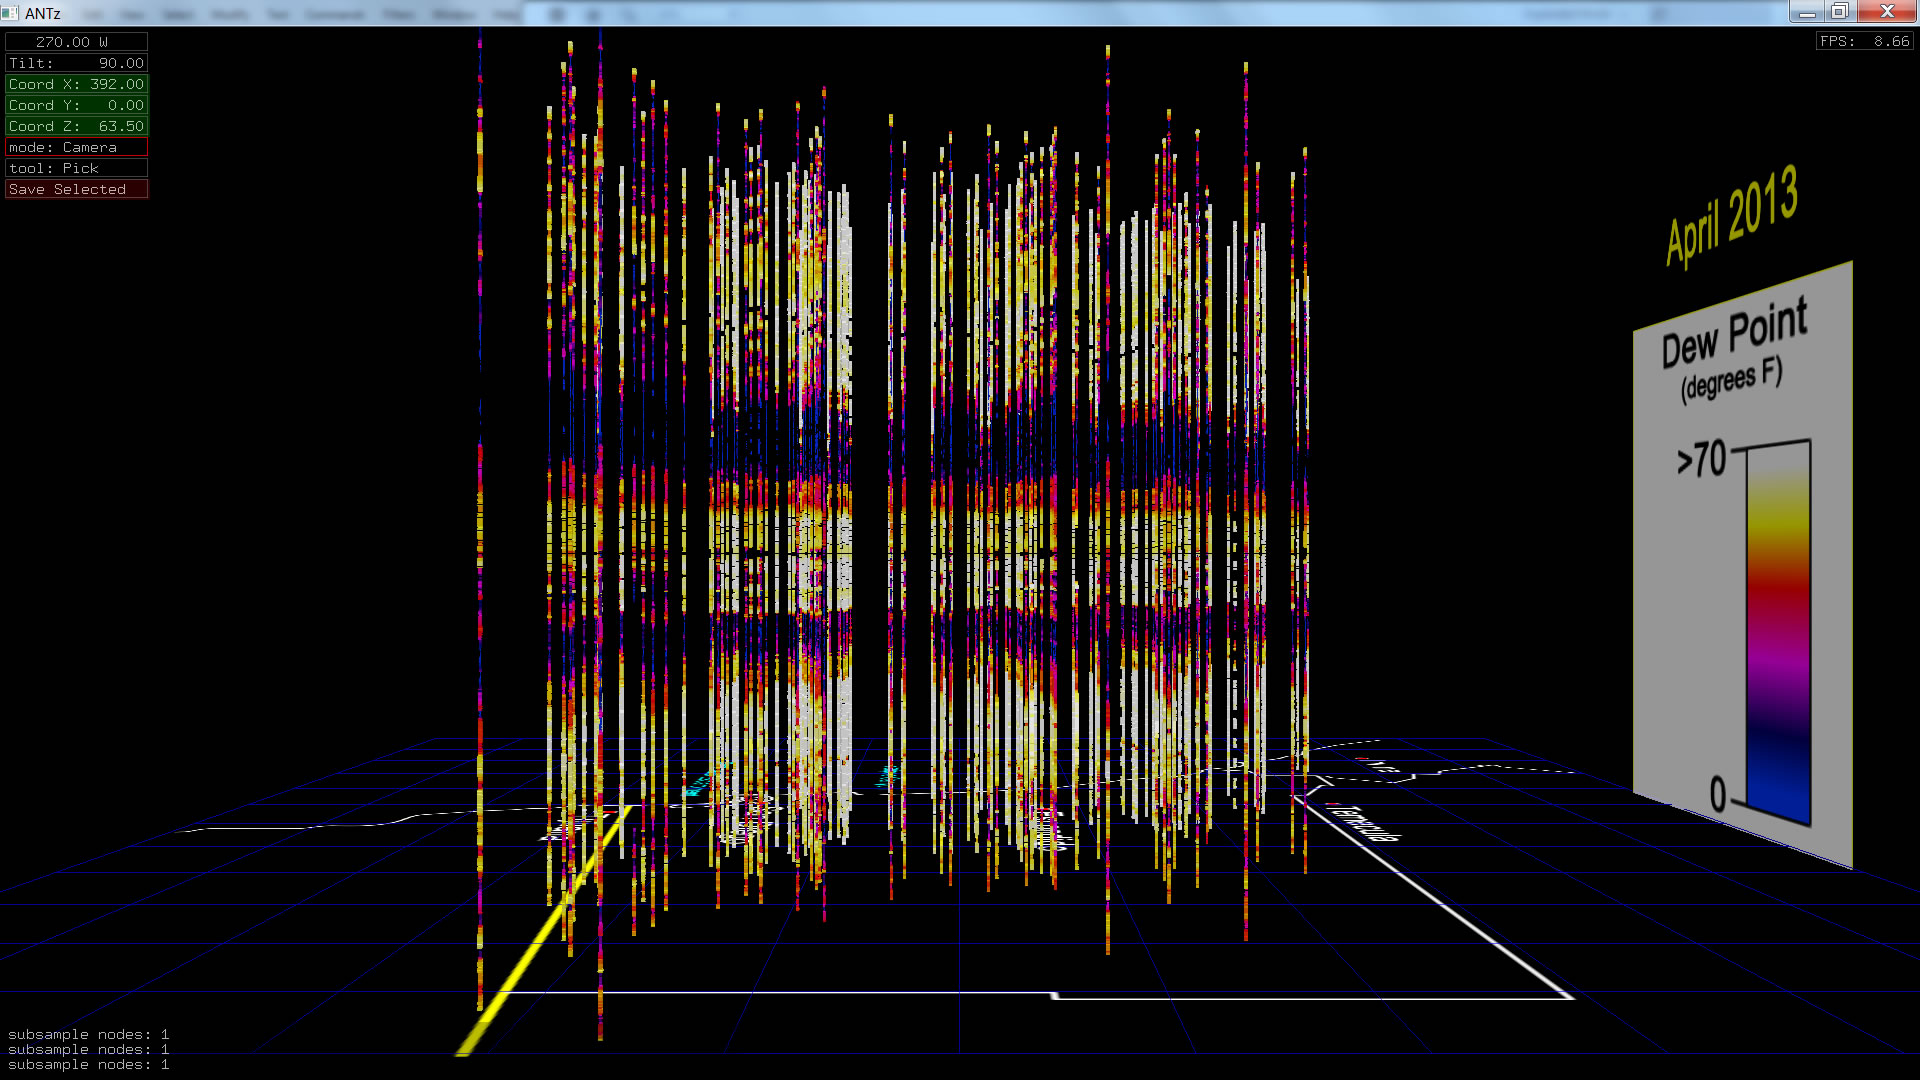
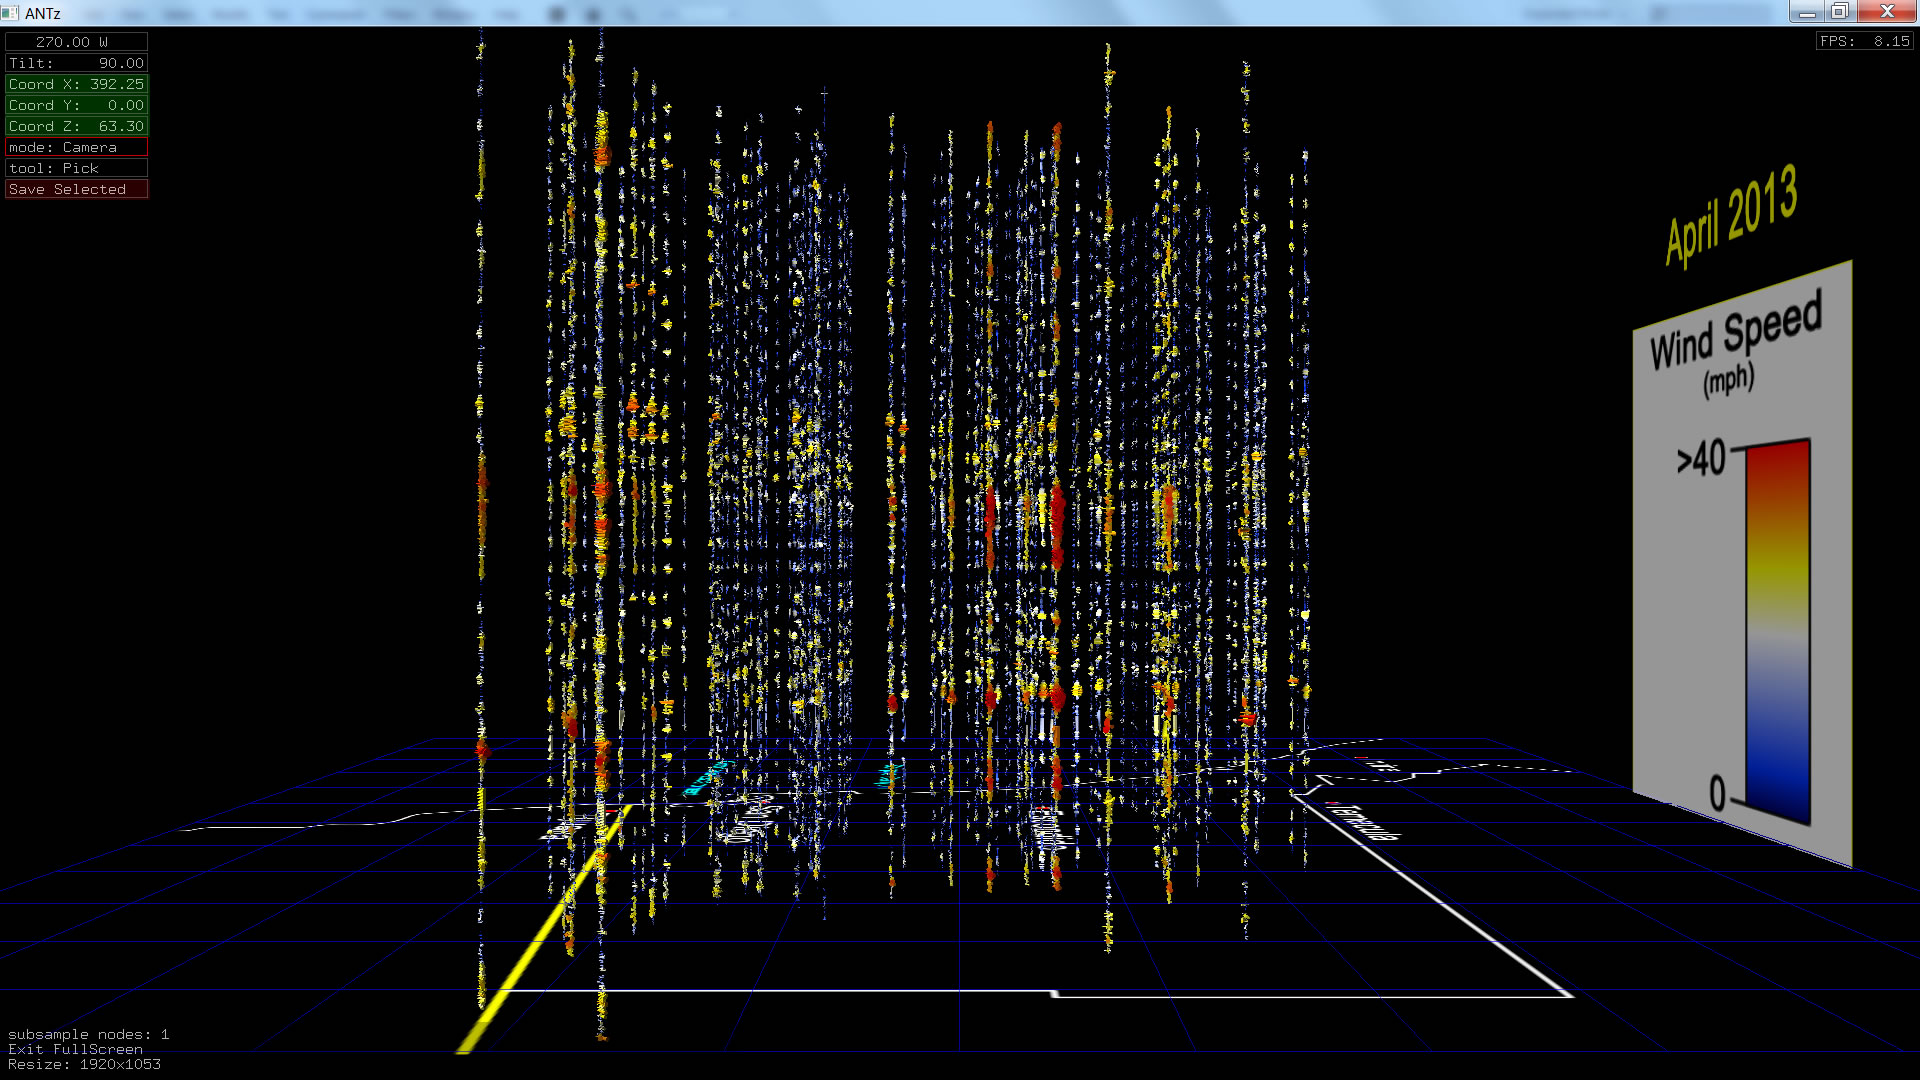
April 2013 |
 |
 |
 |
 |
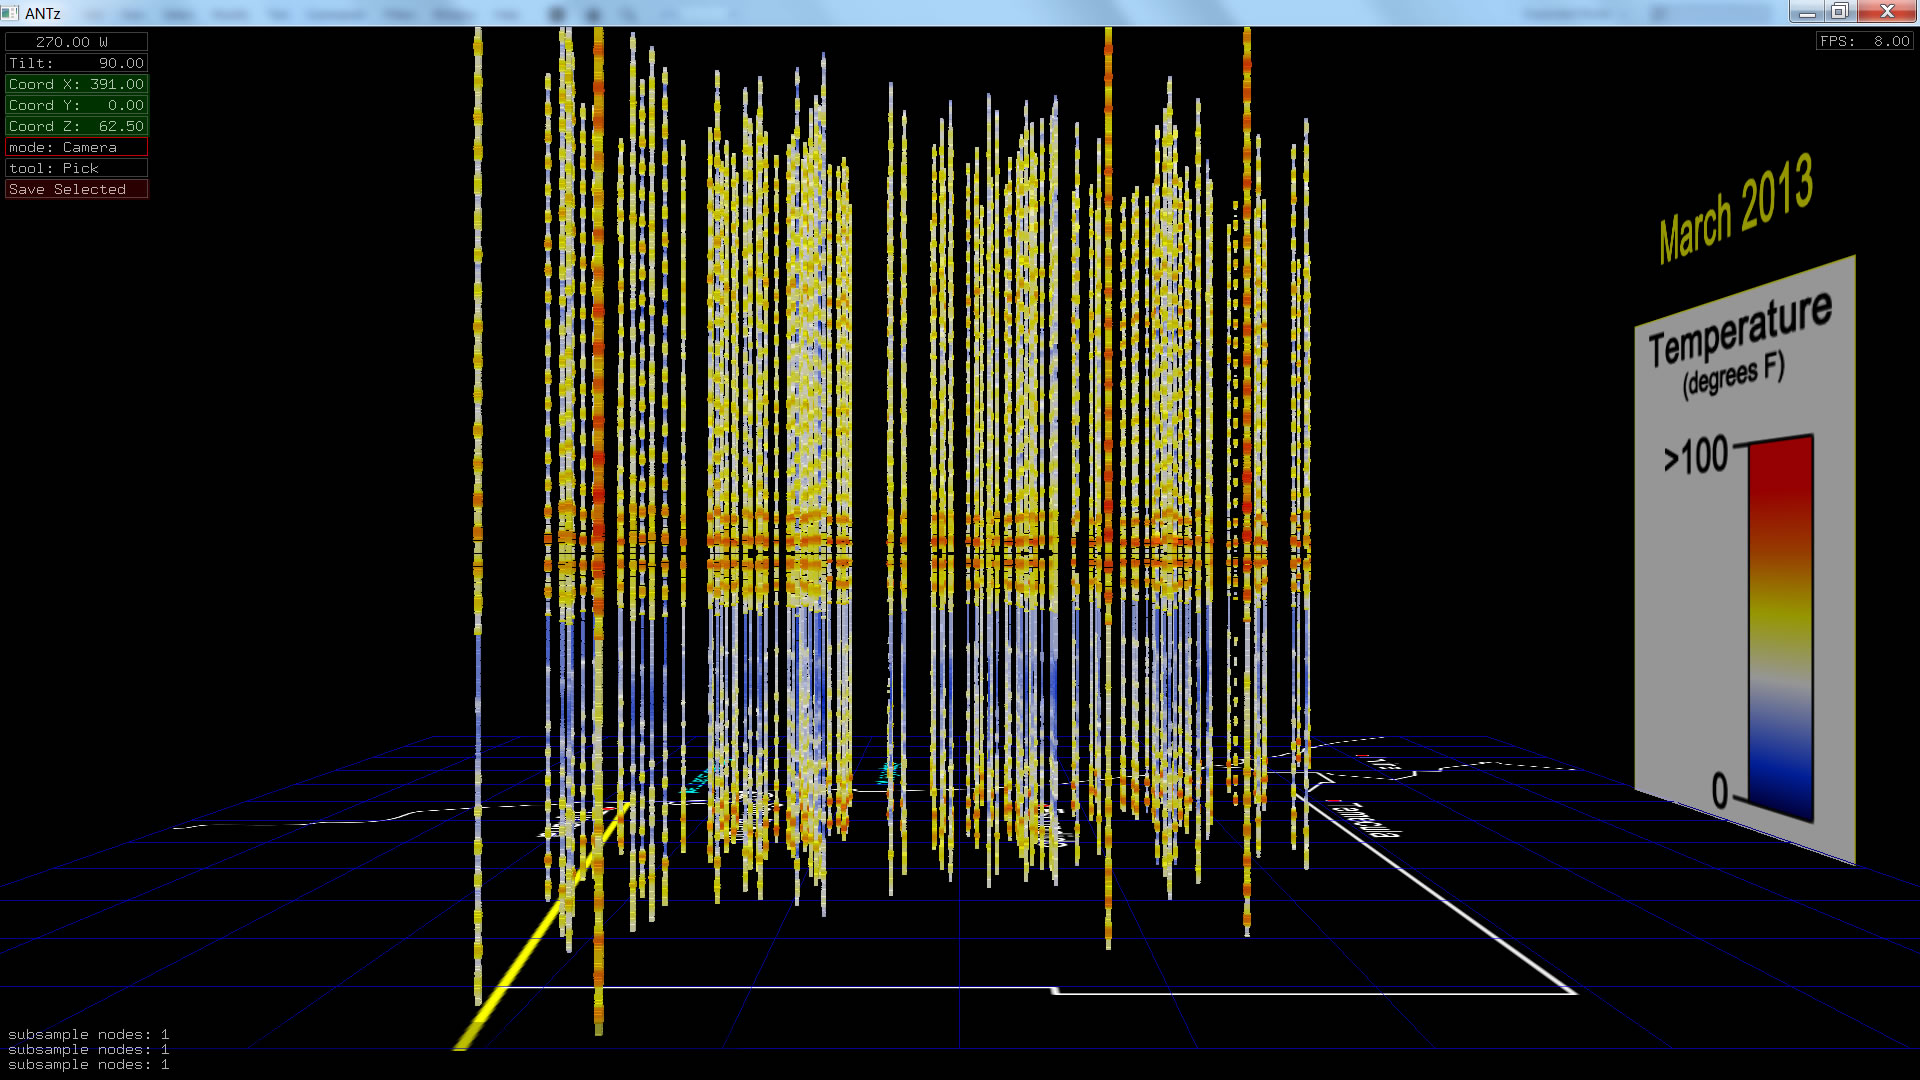
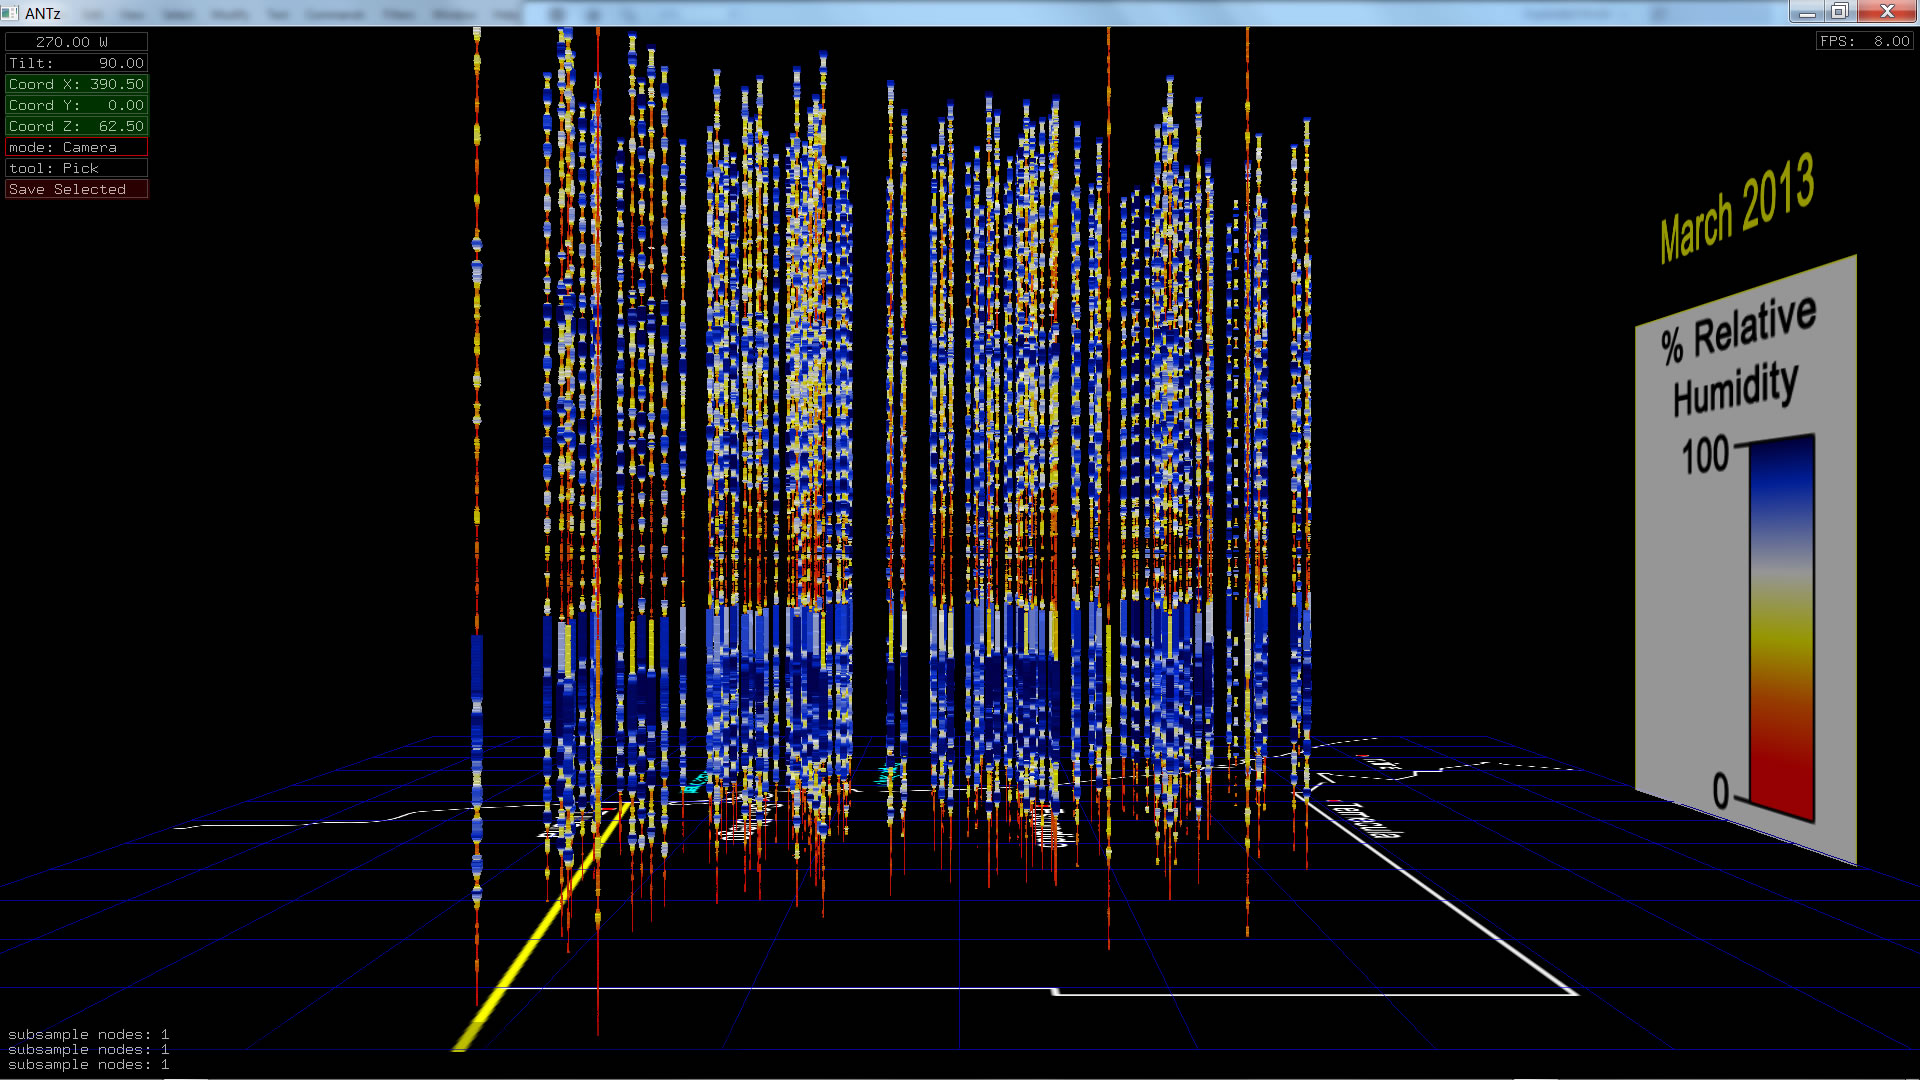
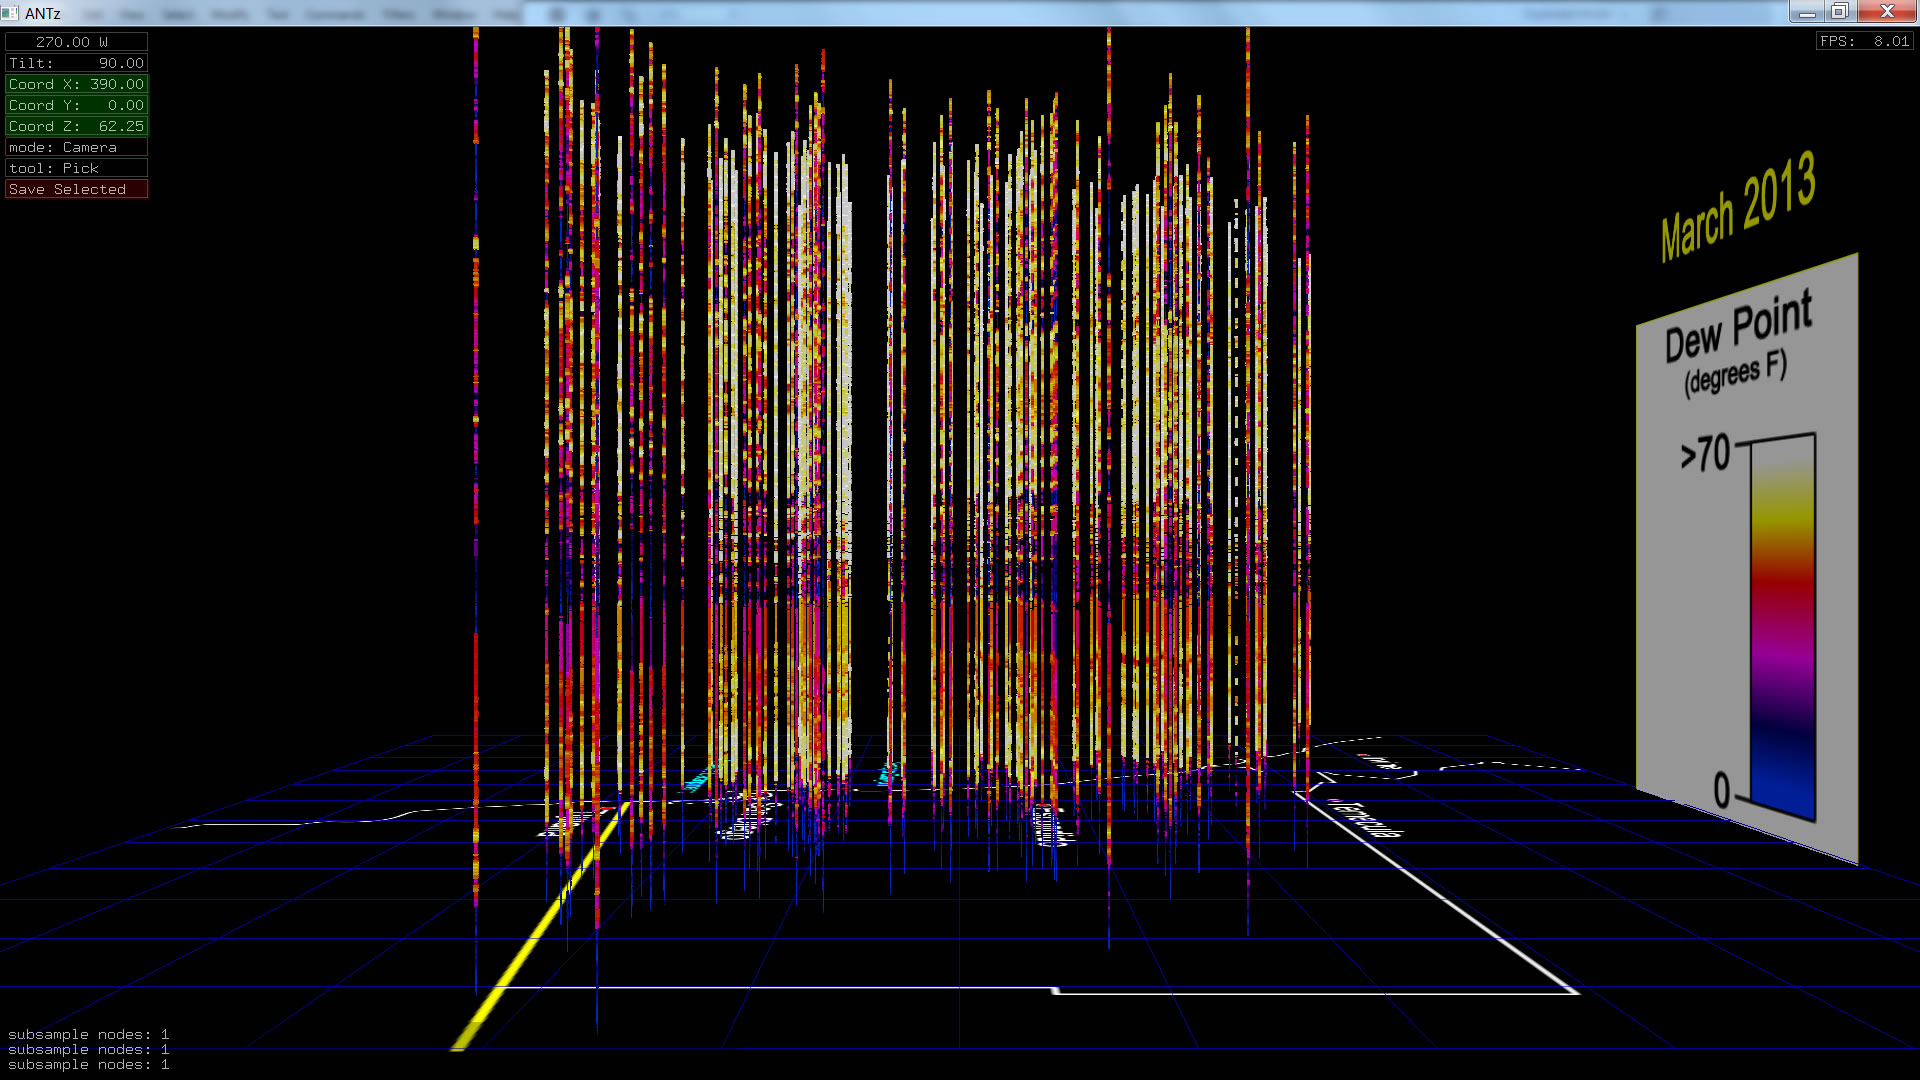
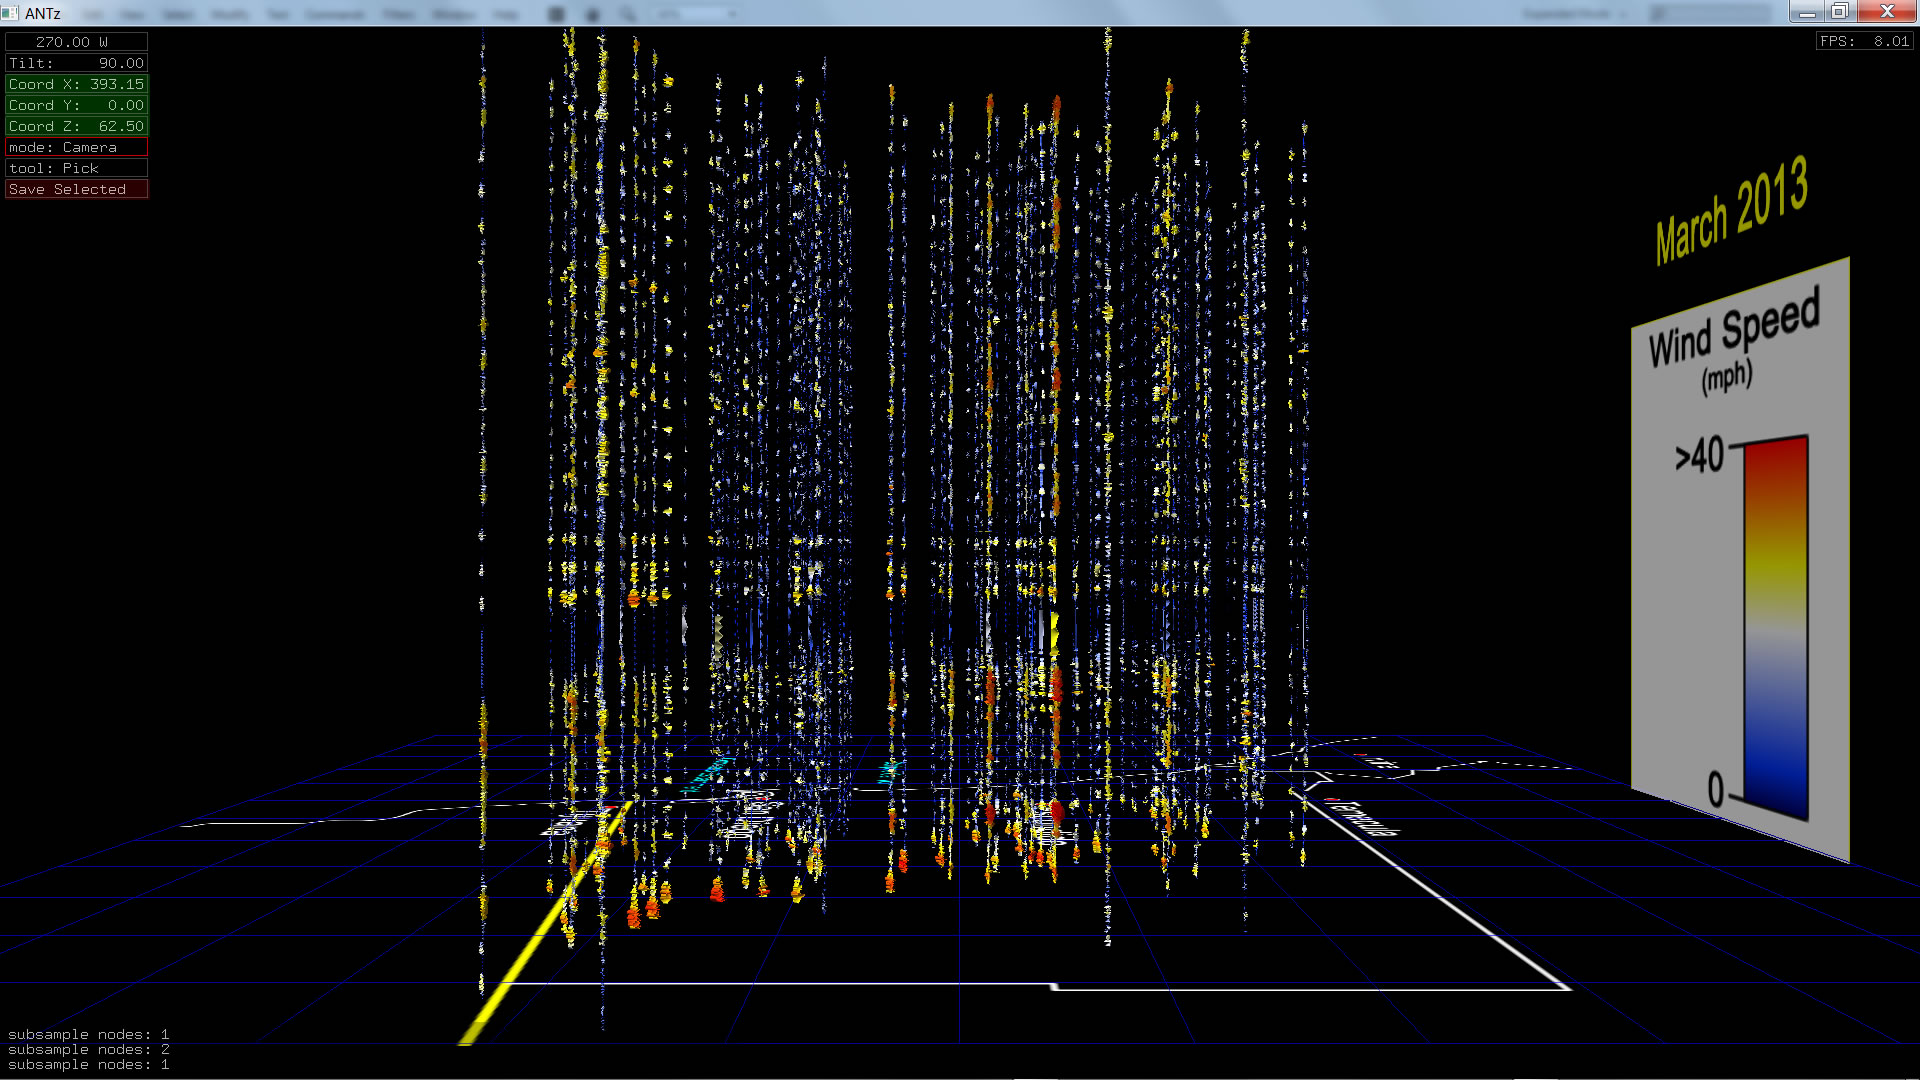
March 2013 |
 |
 |
 |
 |
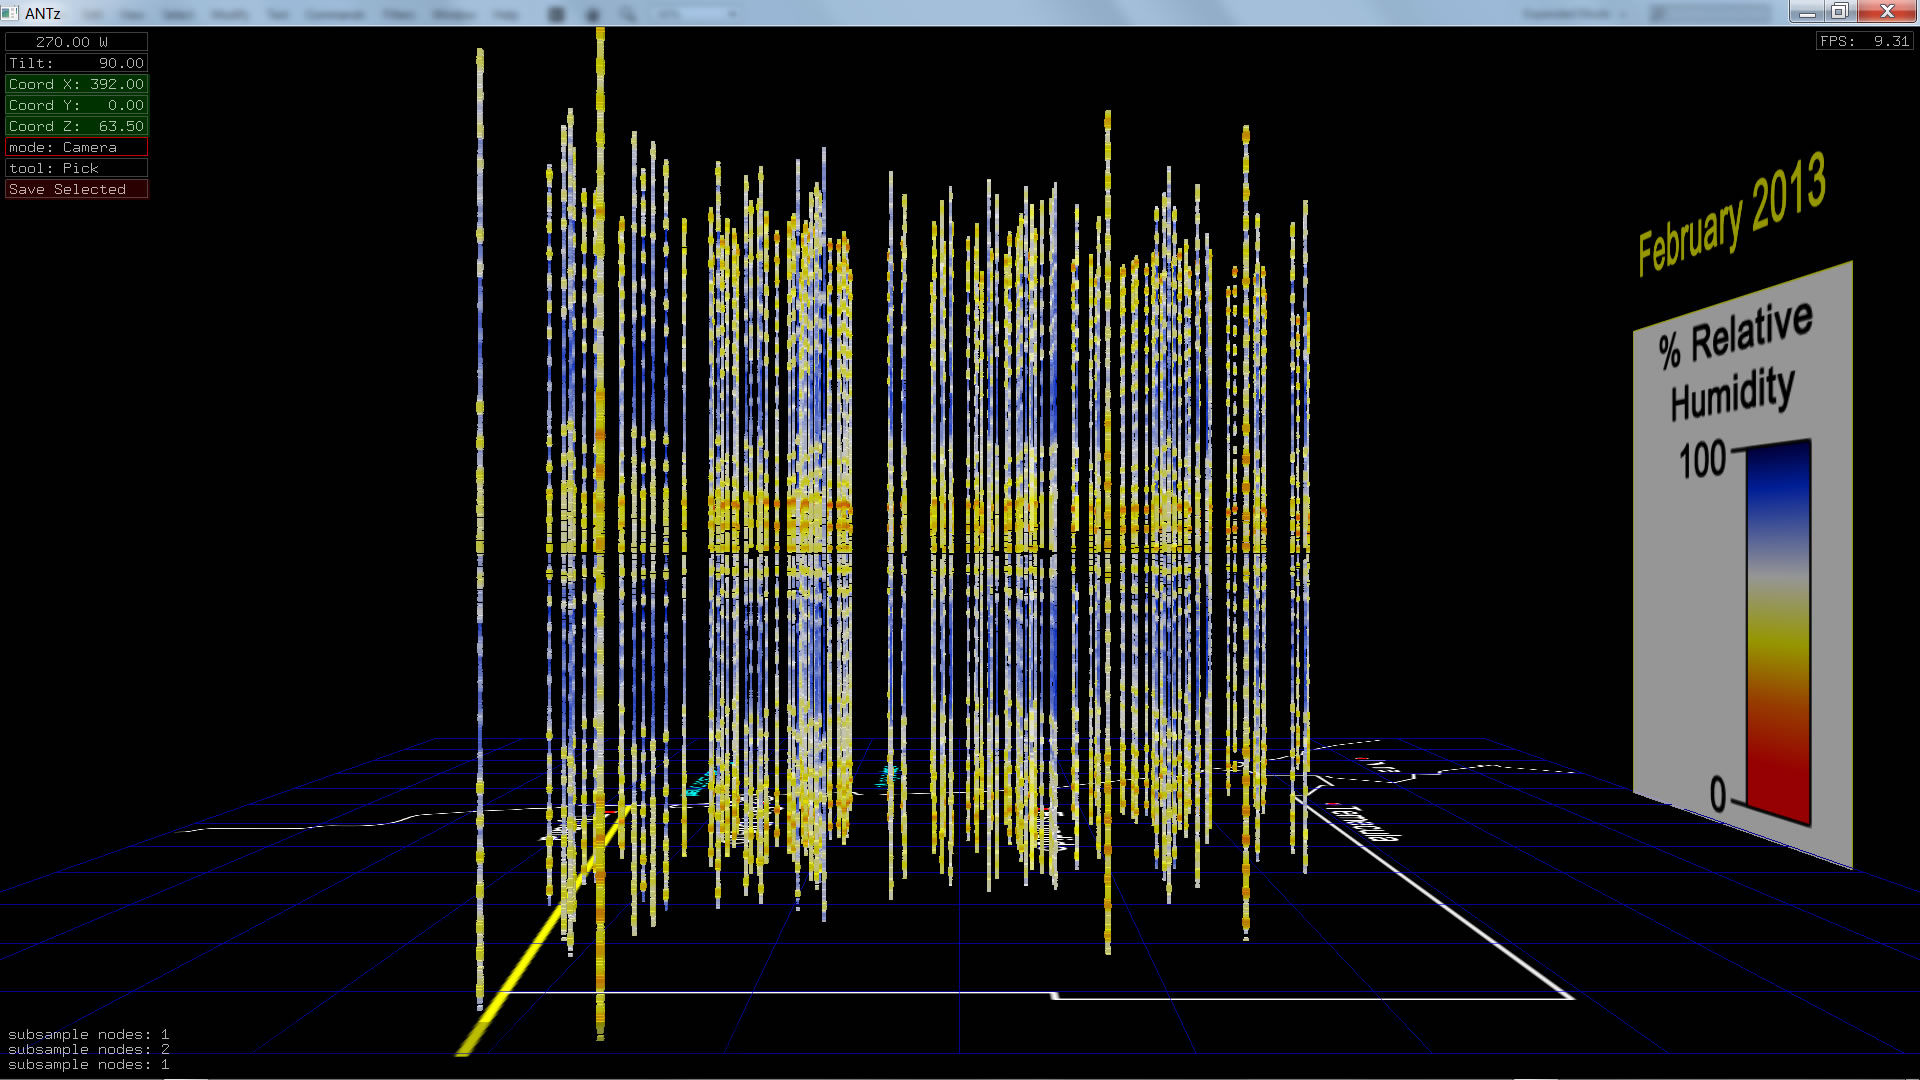
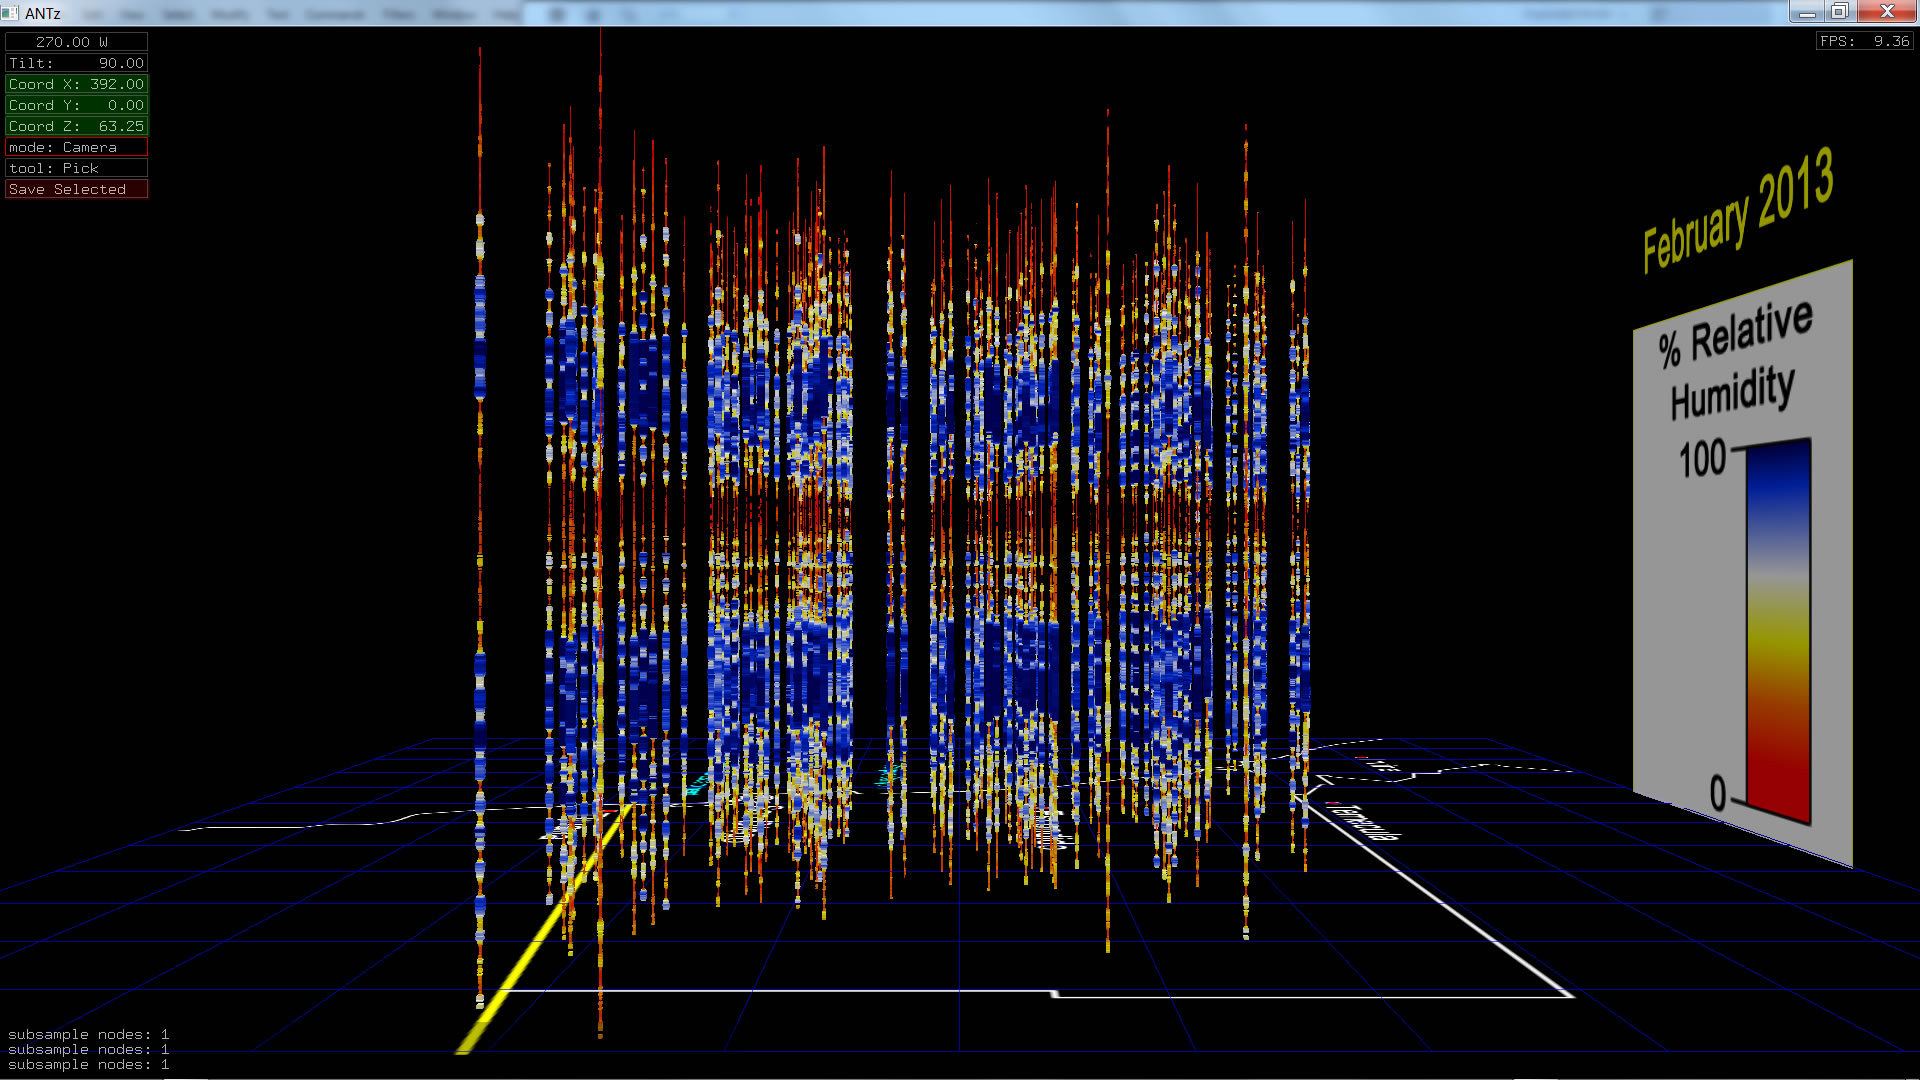
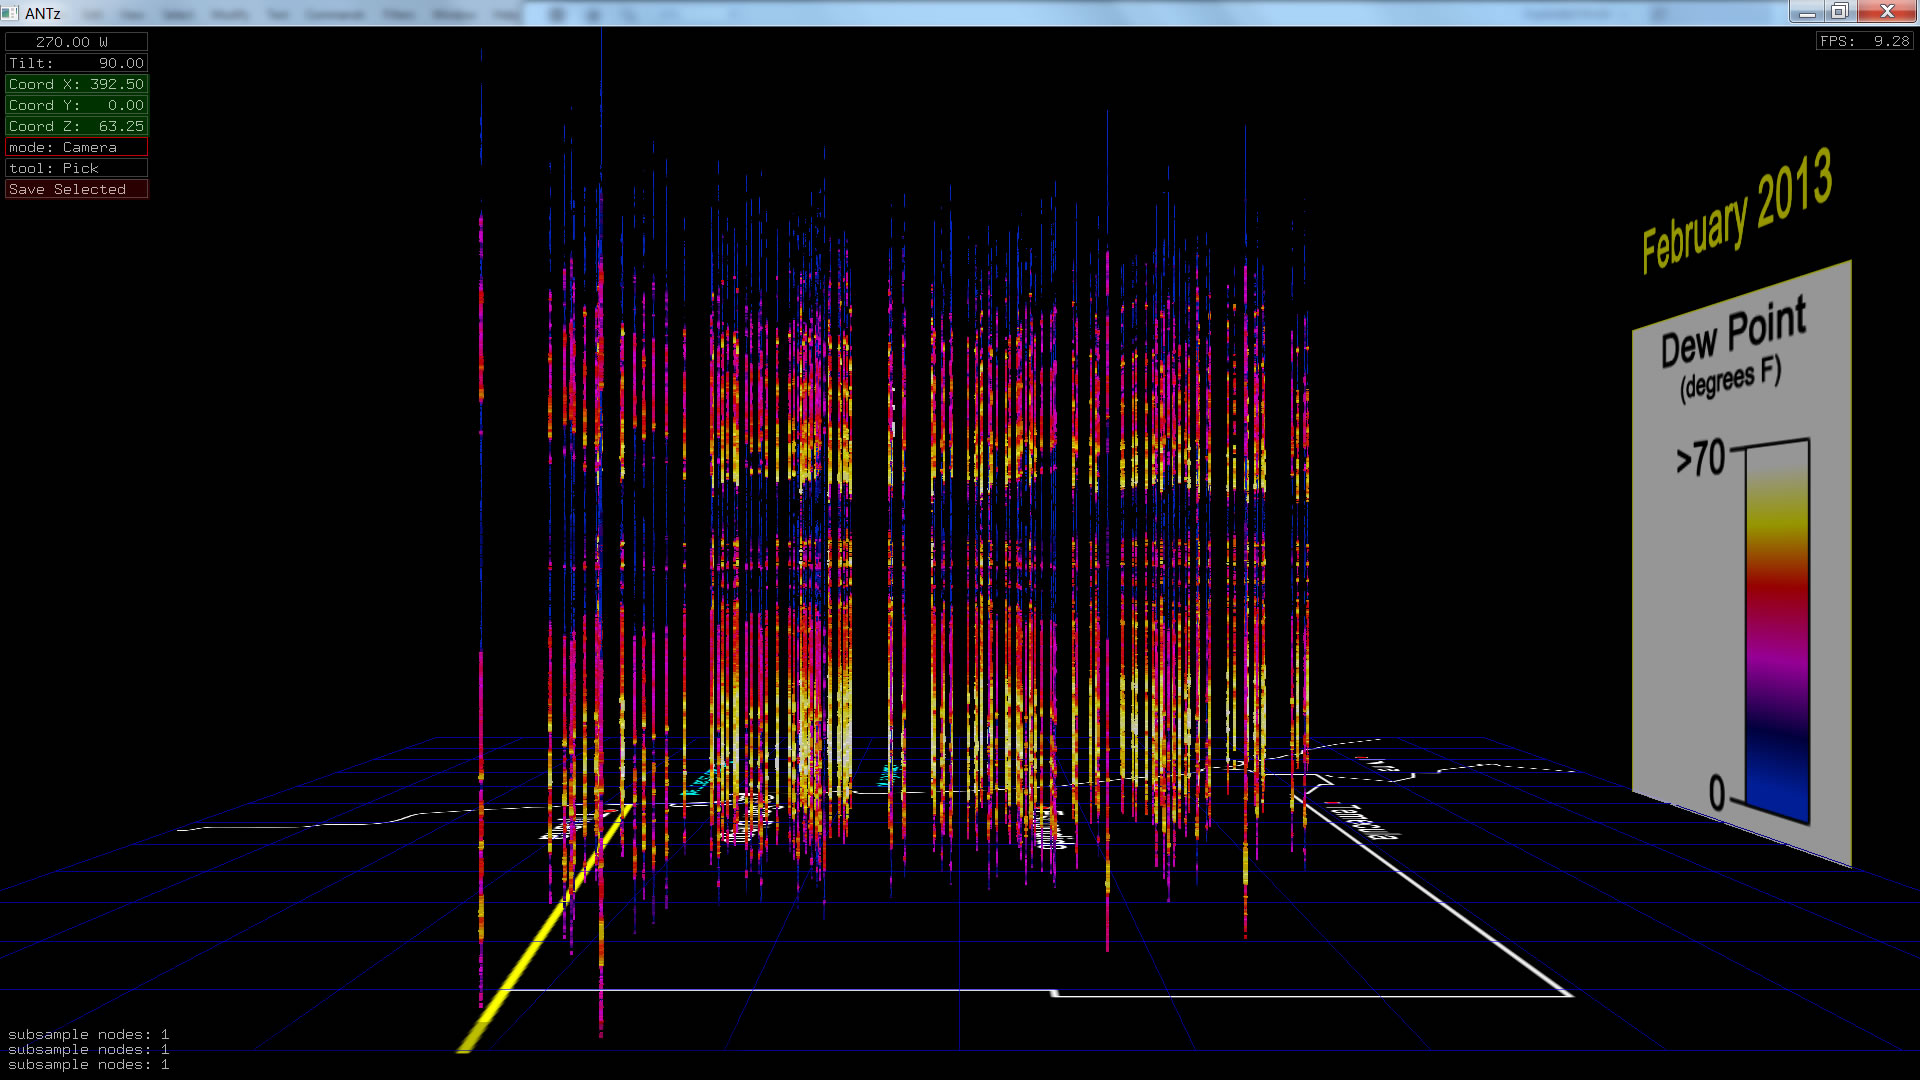
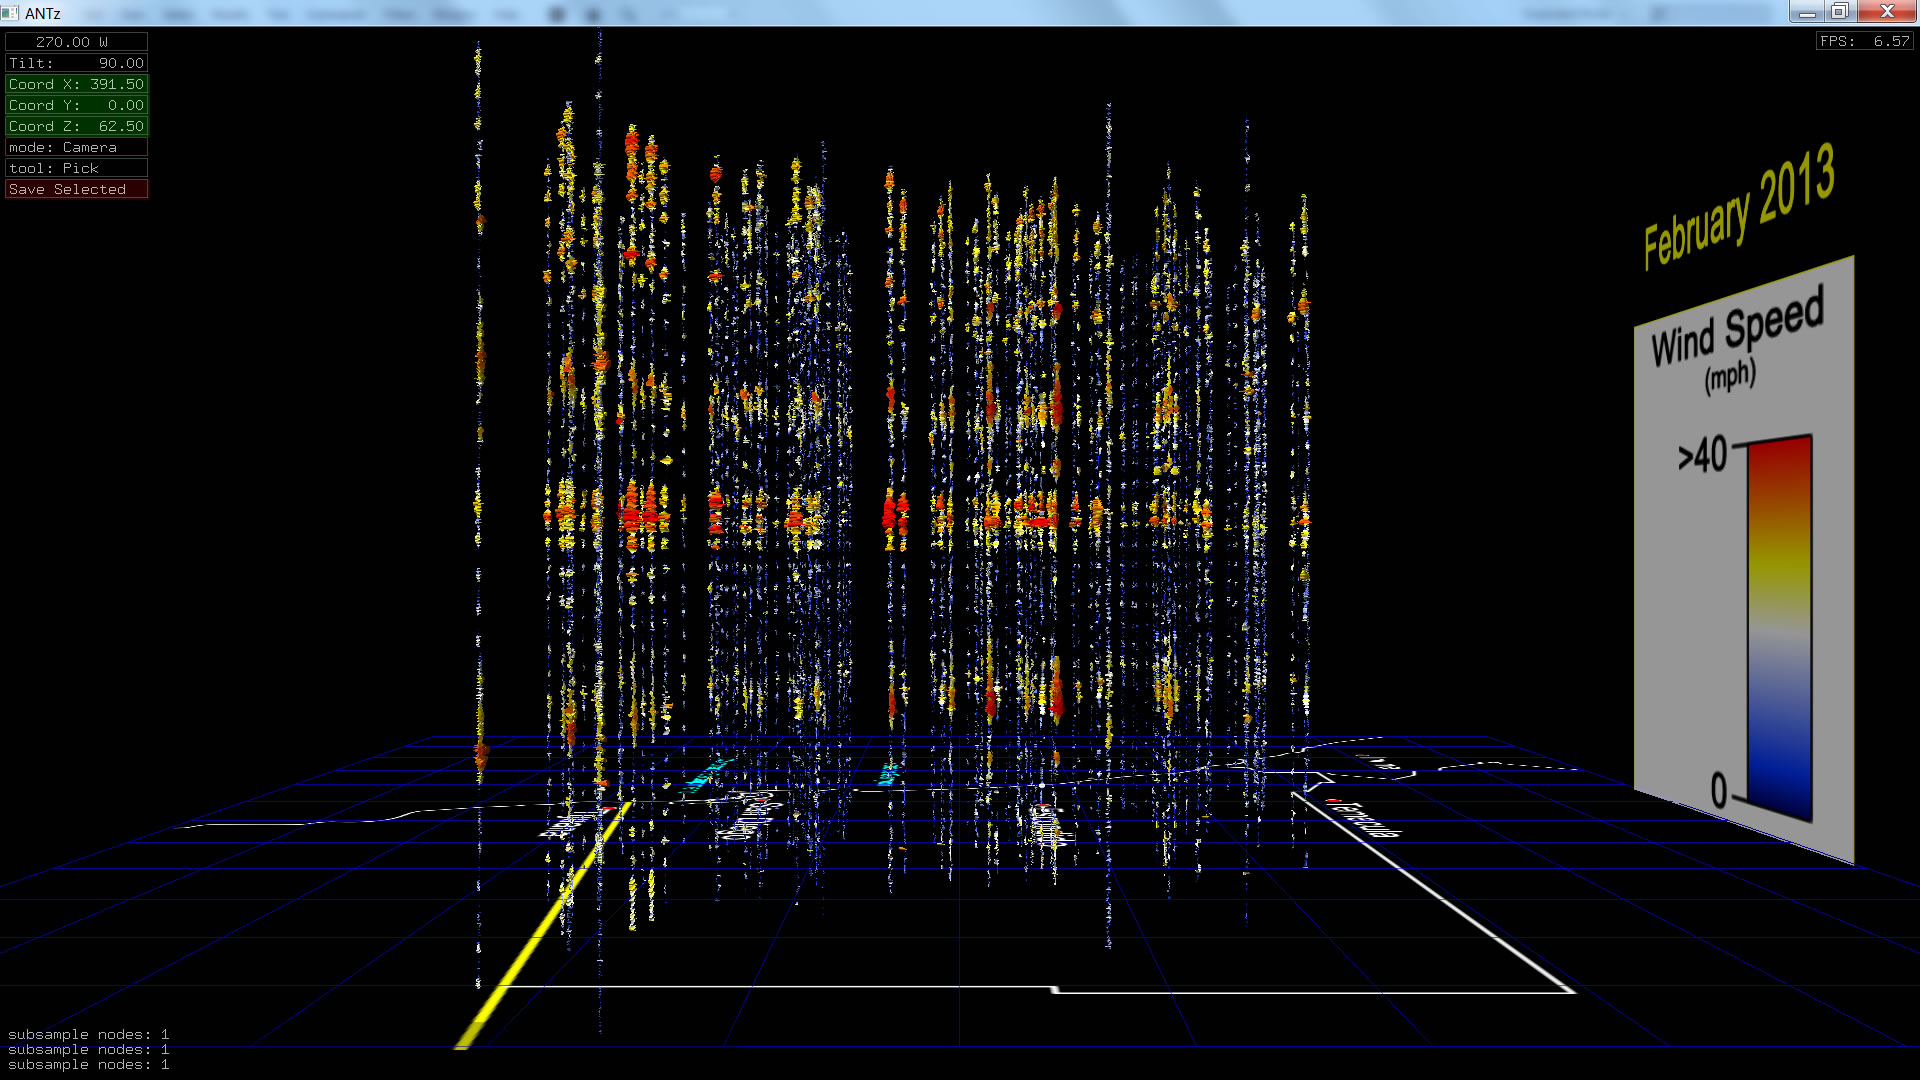
February 2013 |
 |
 |
 |
 |
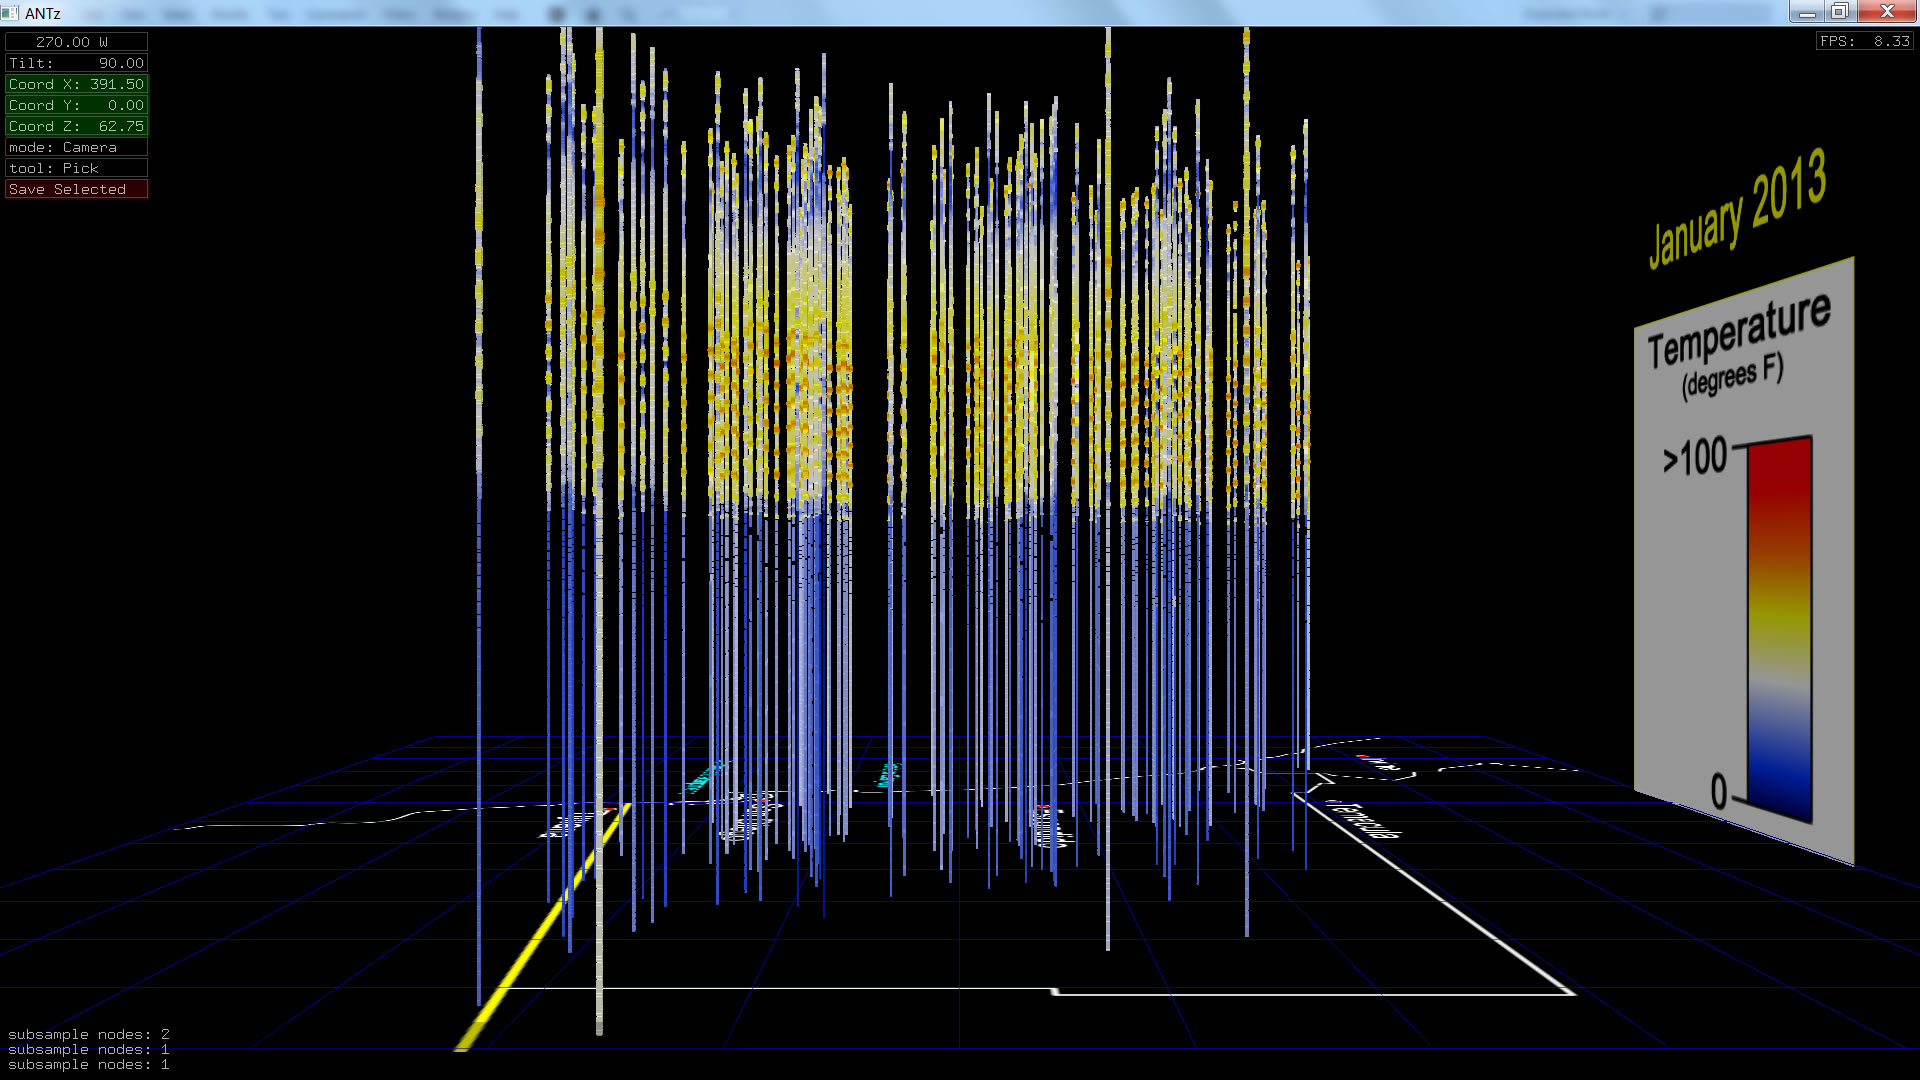
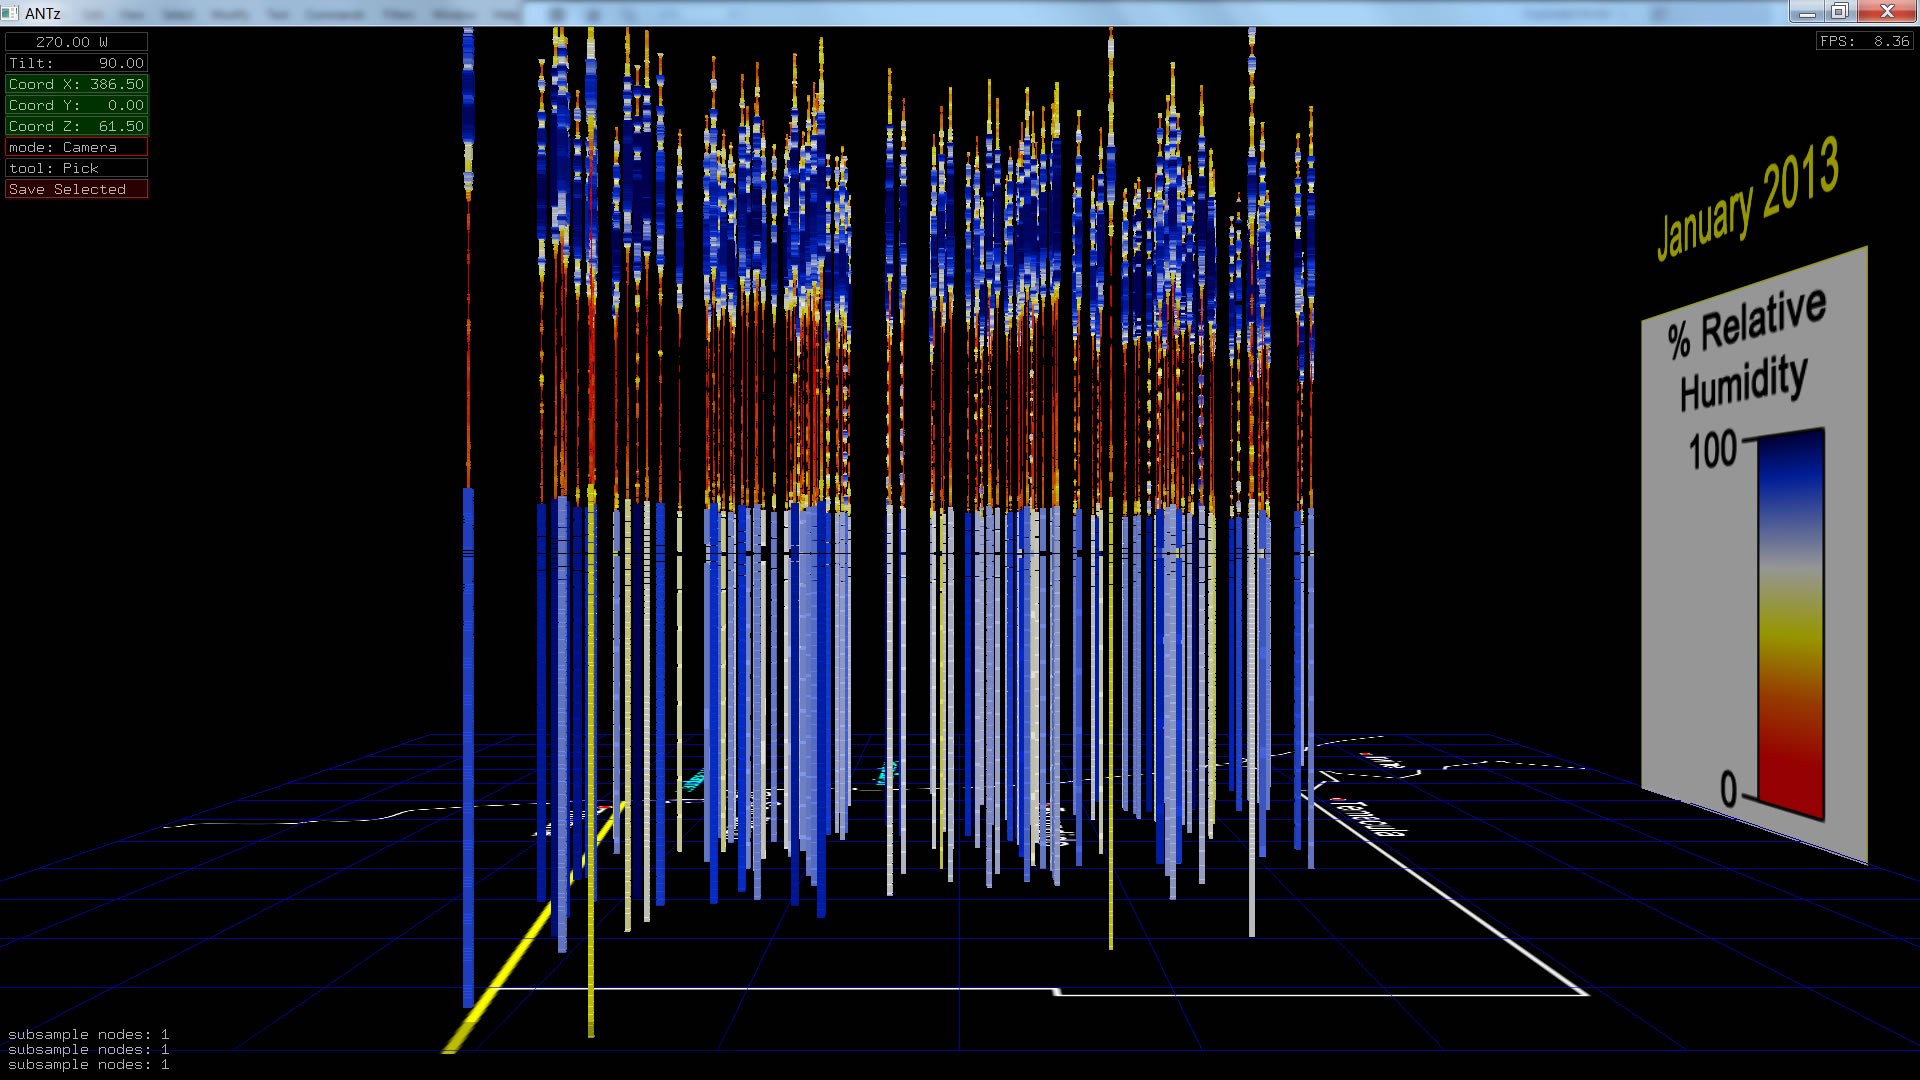
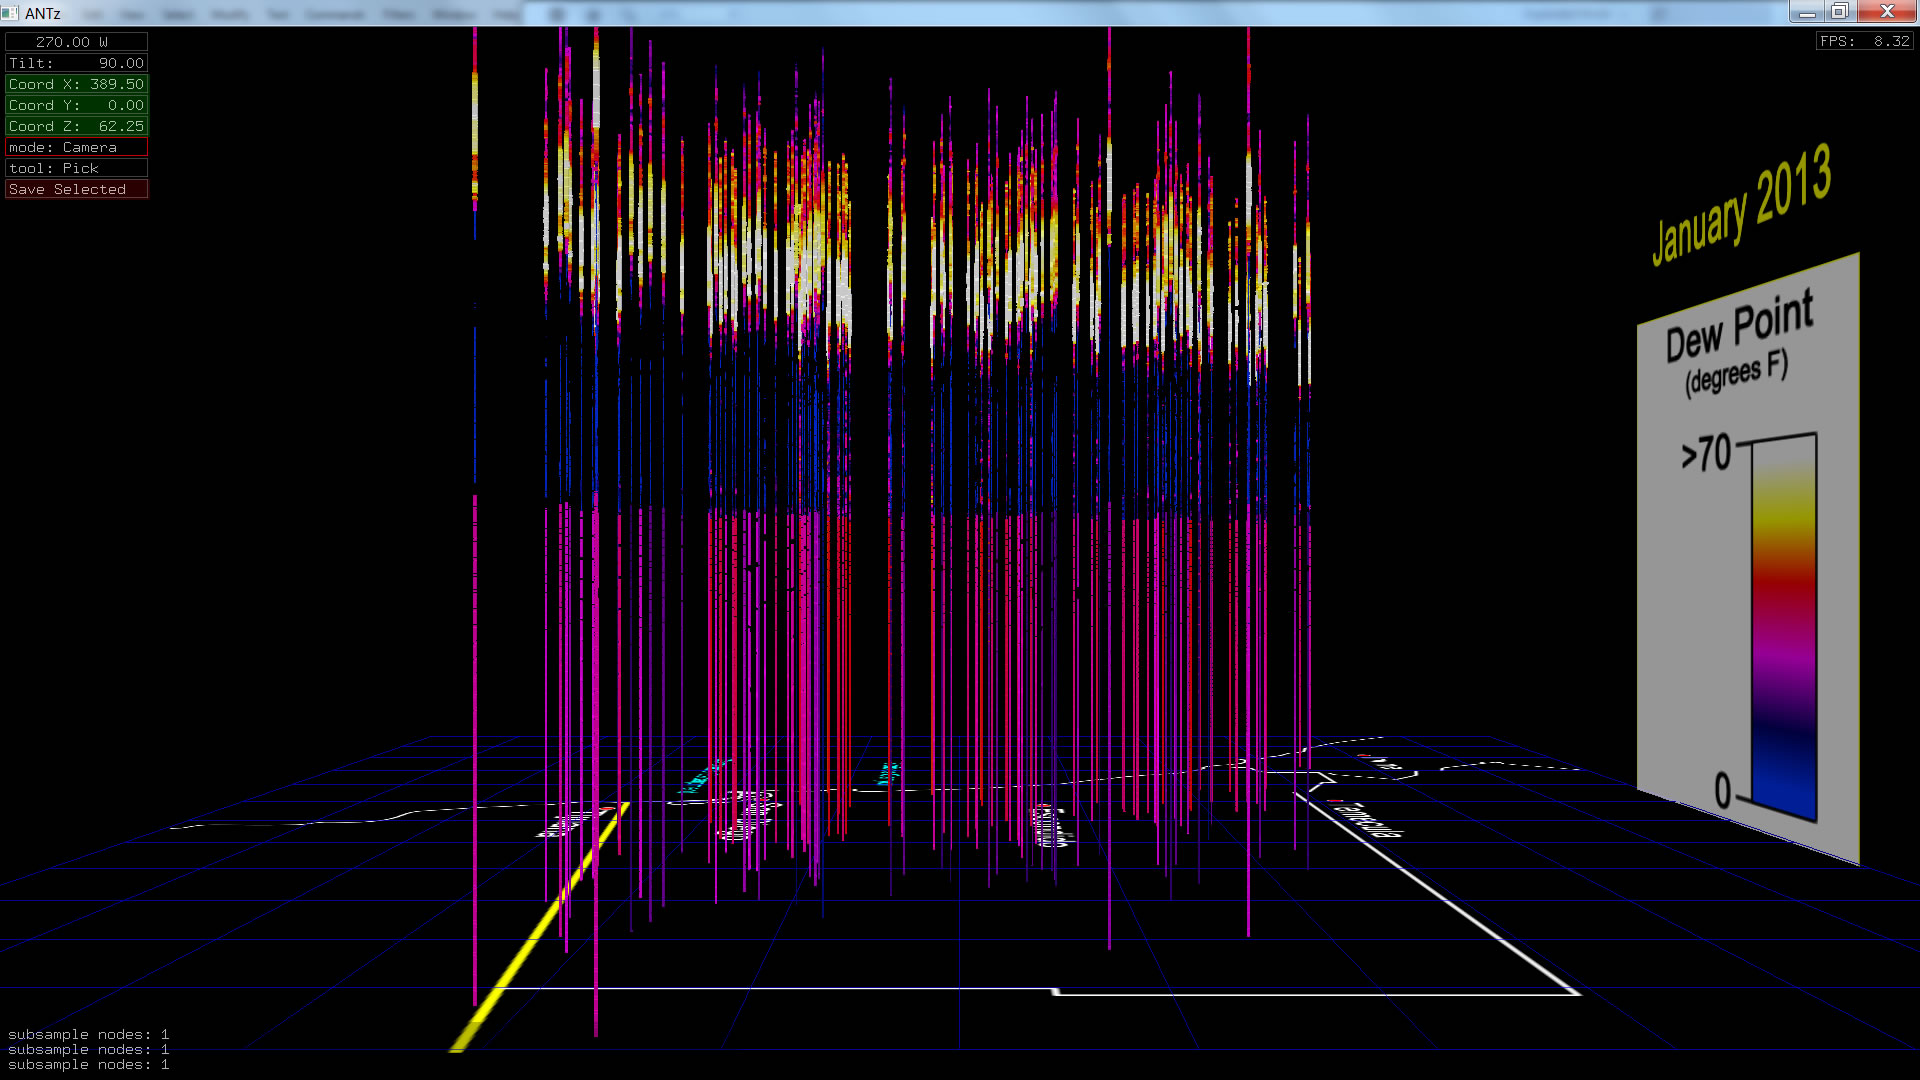
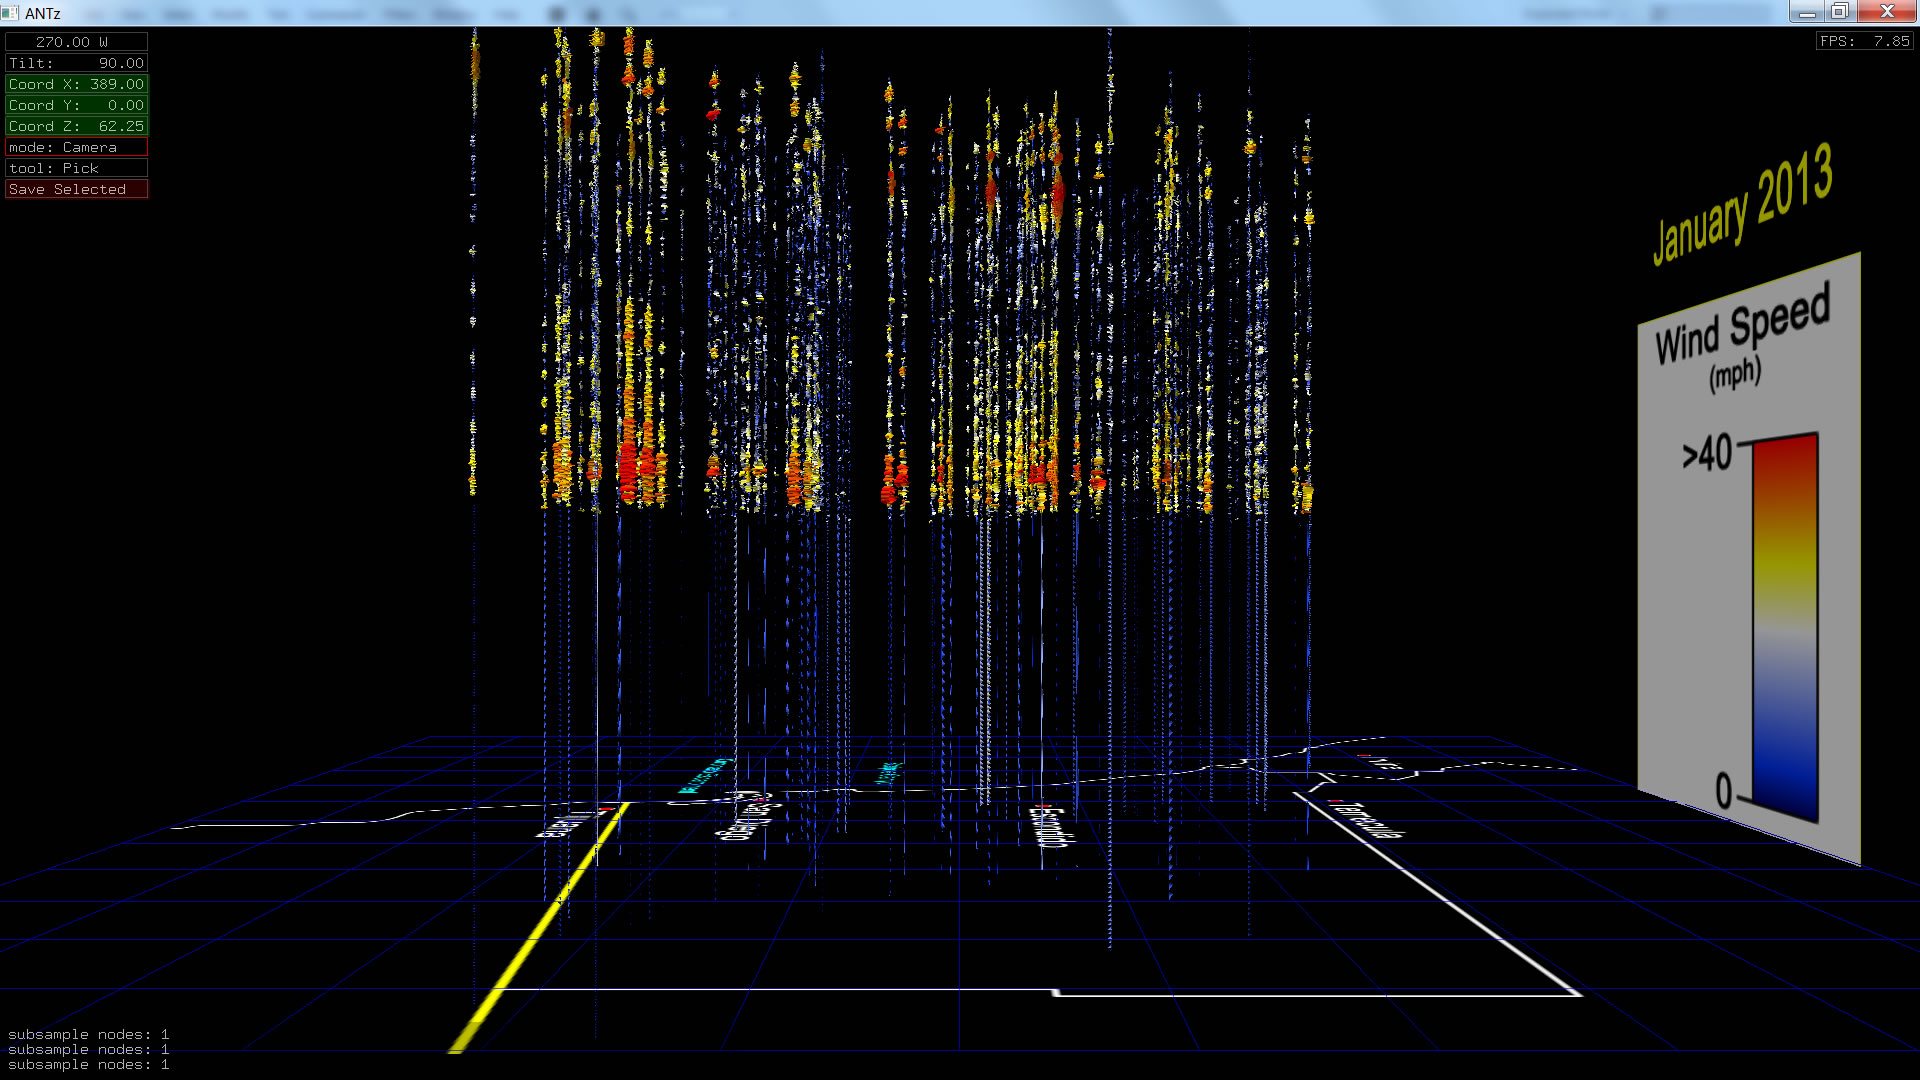
January 2013 |
 |
 |
 |
 |
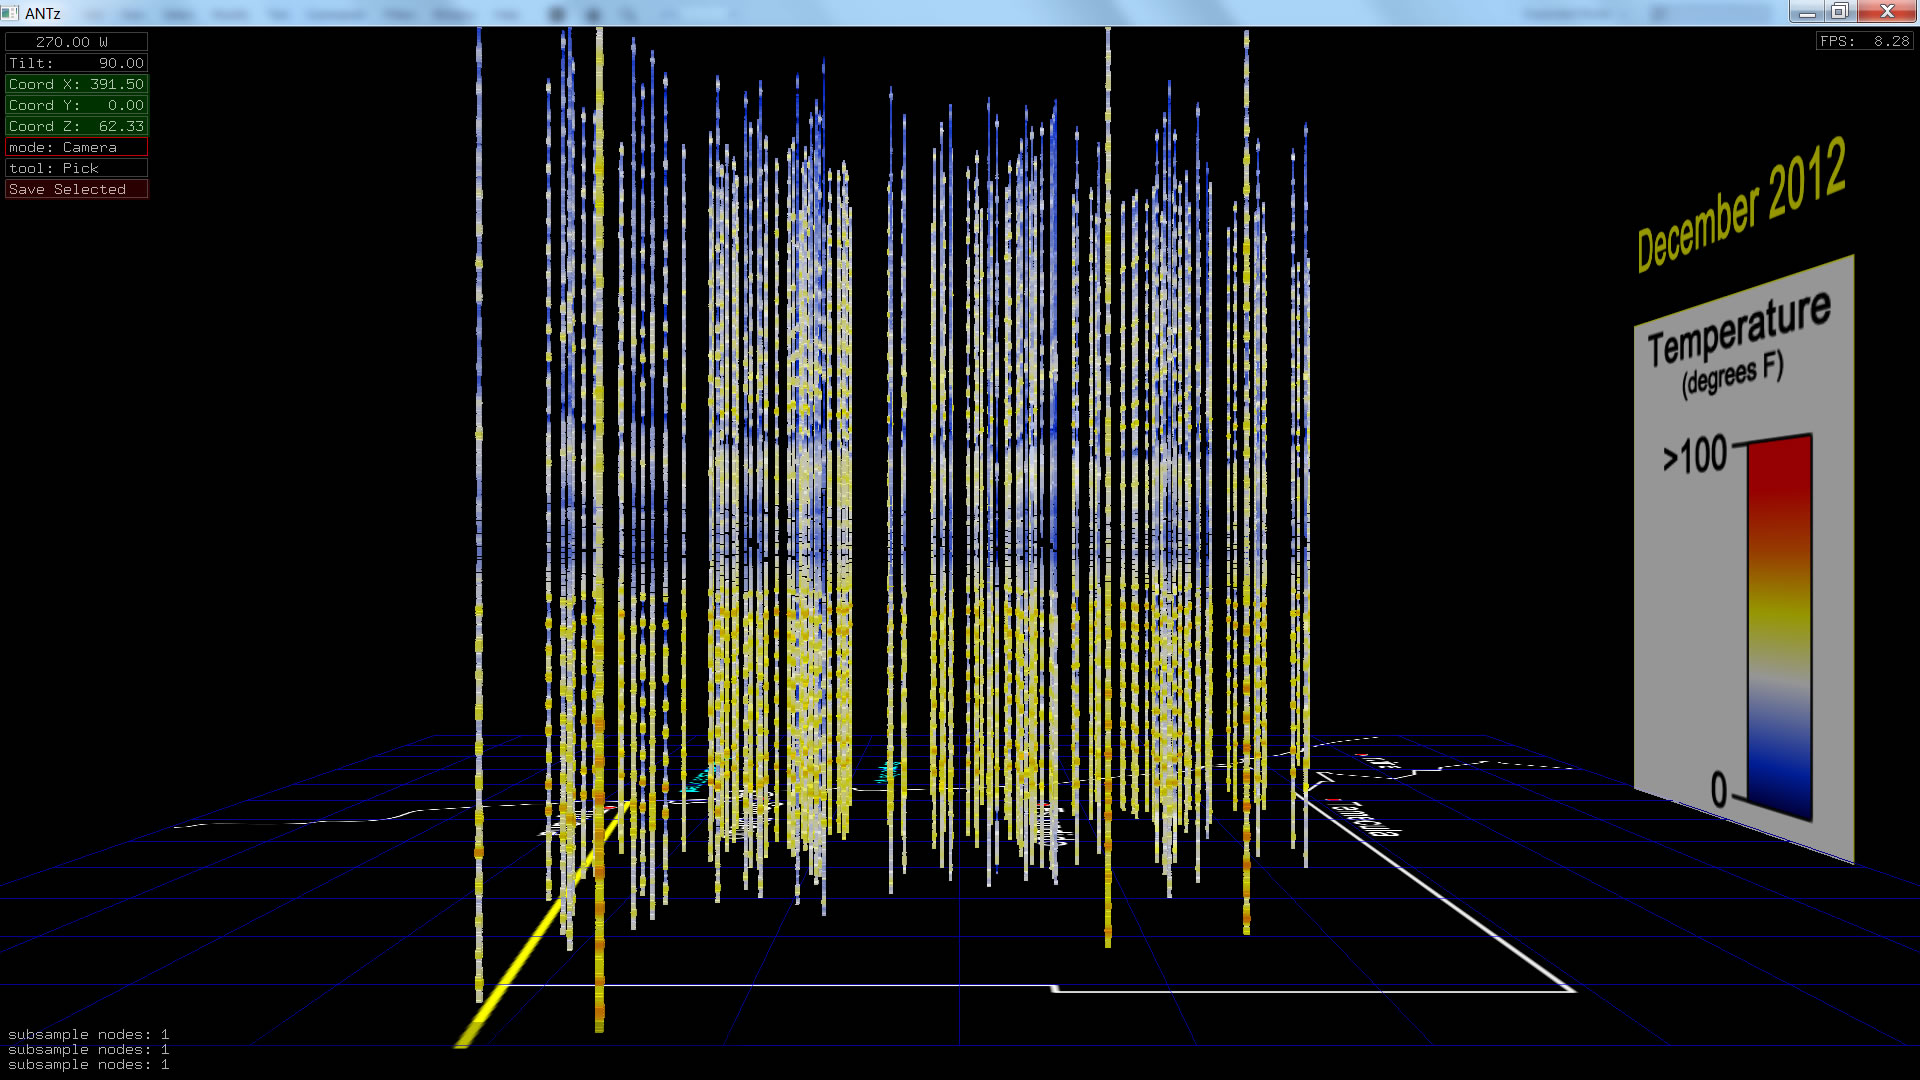
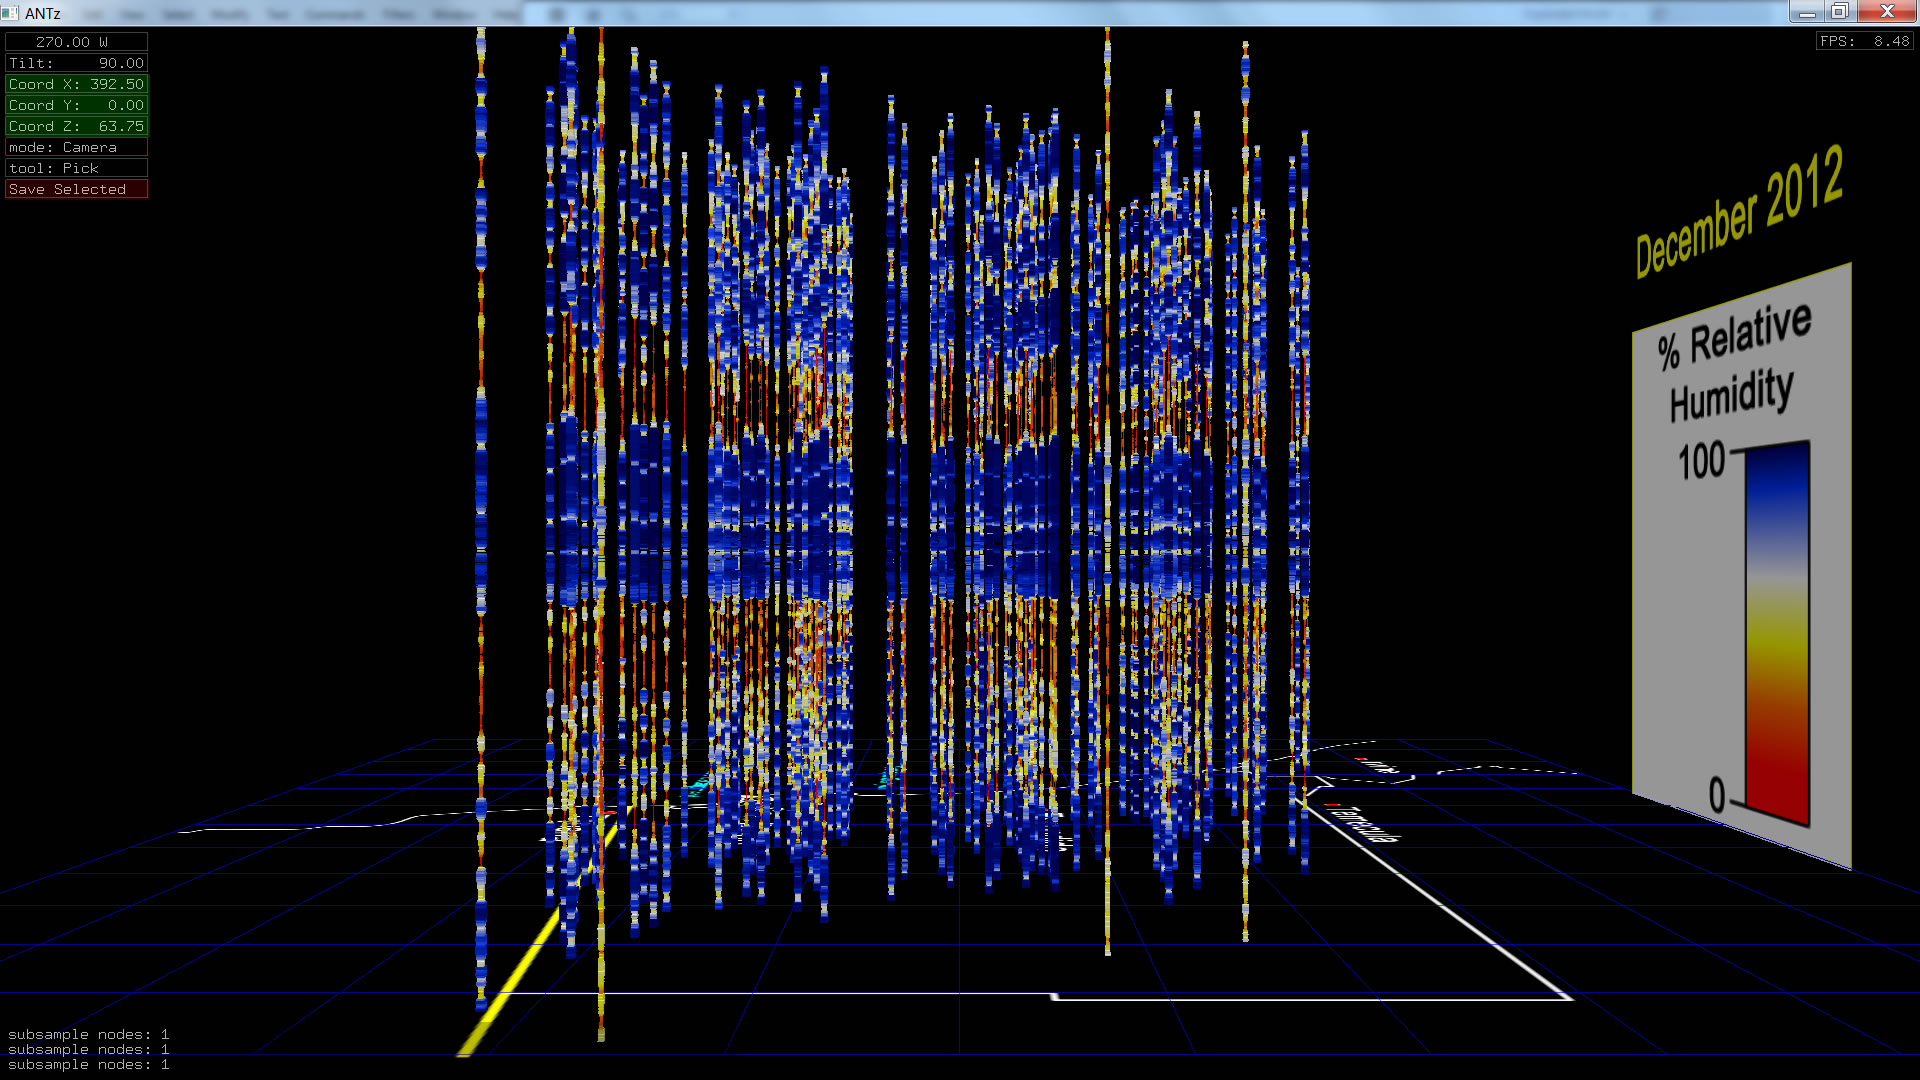
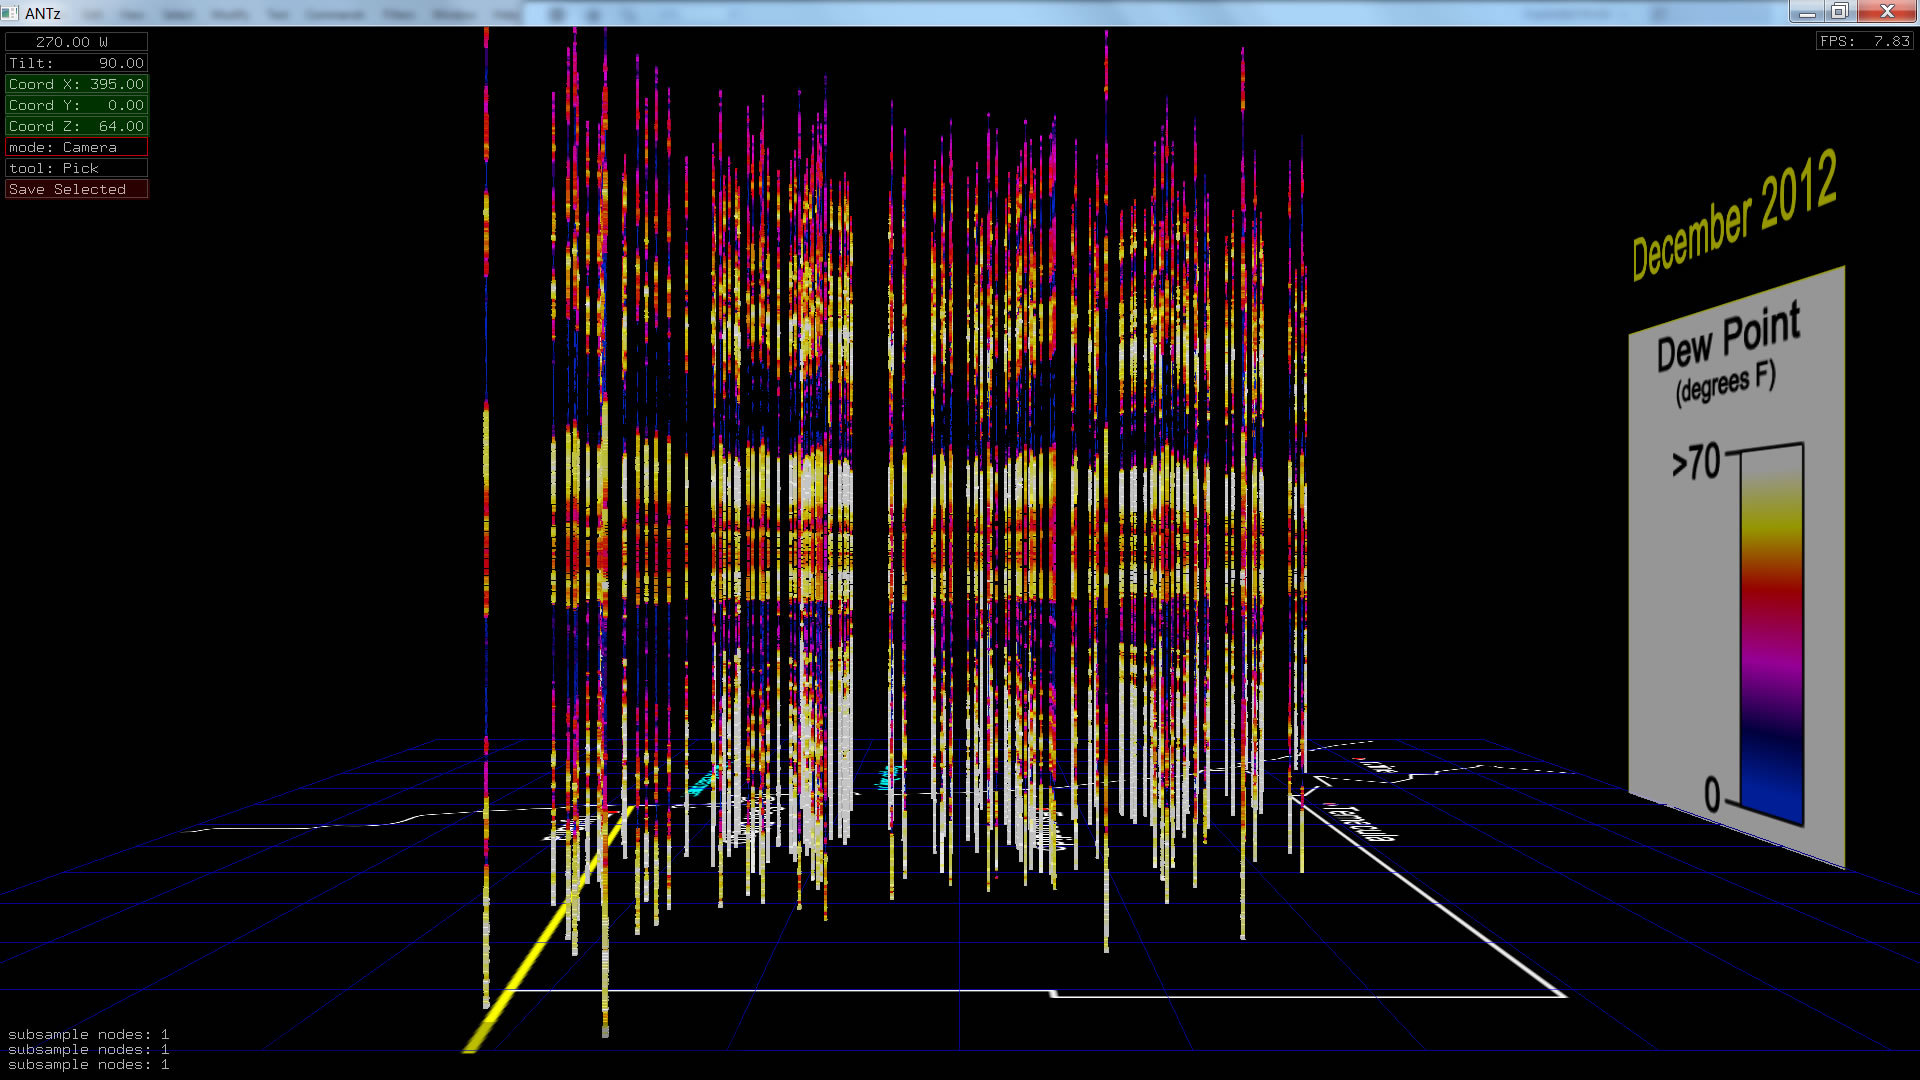
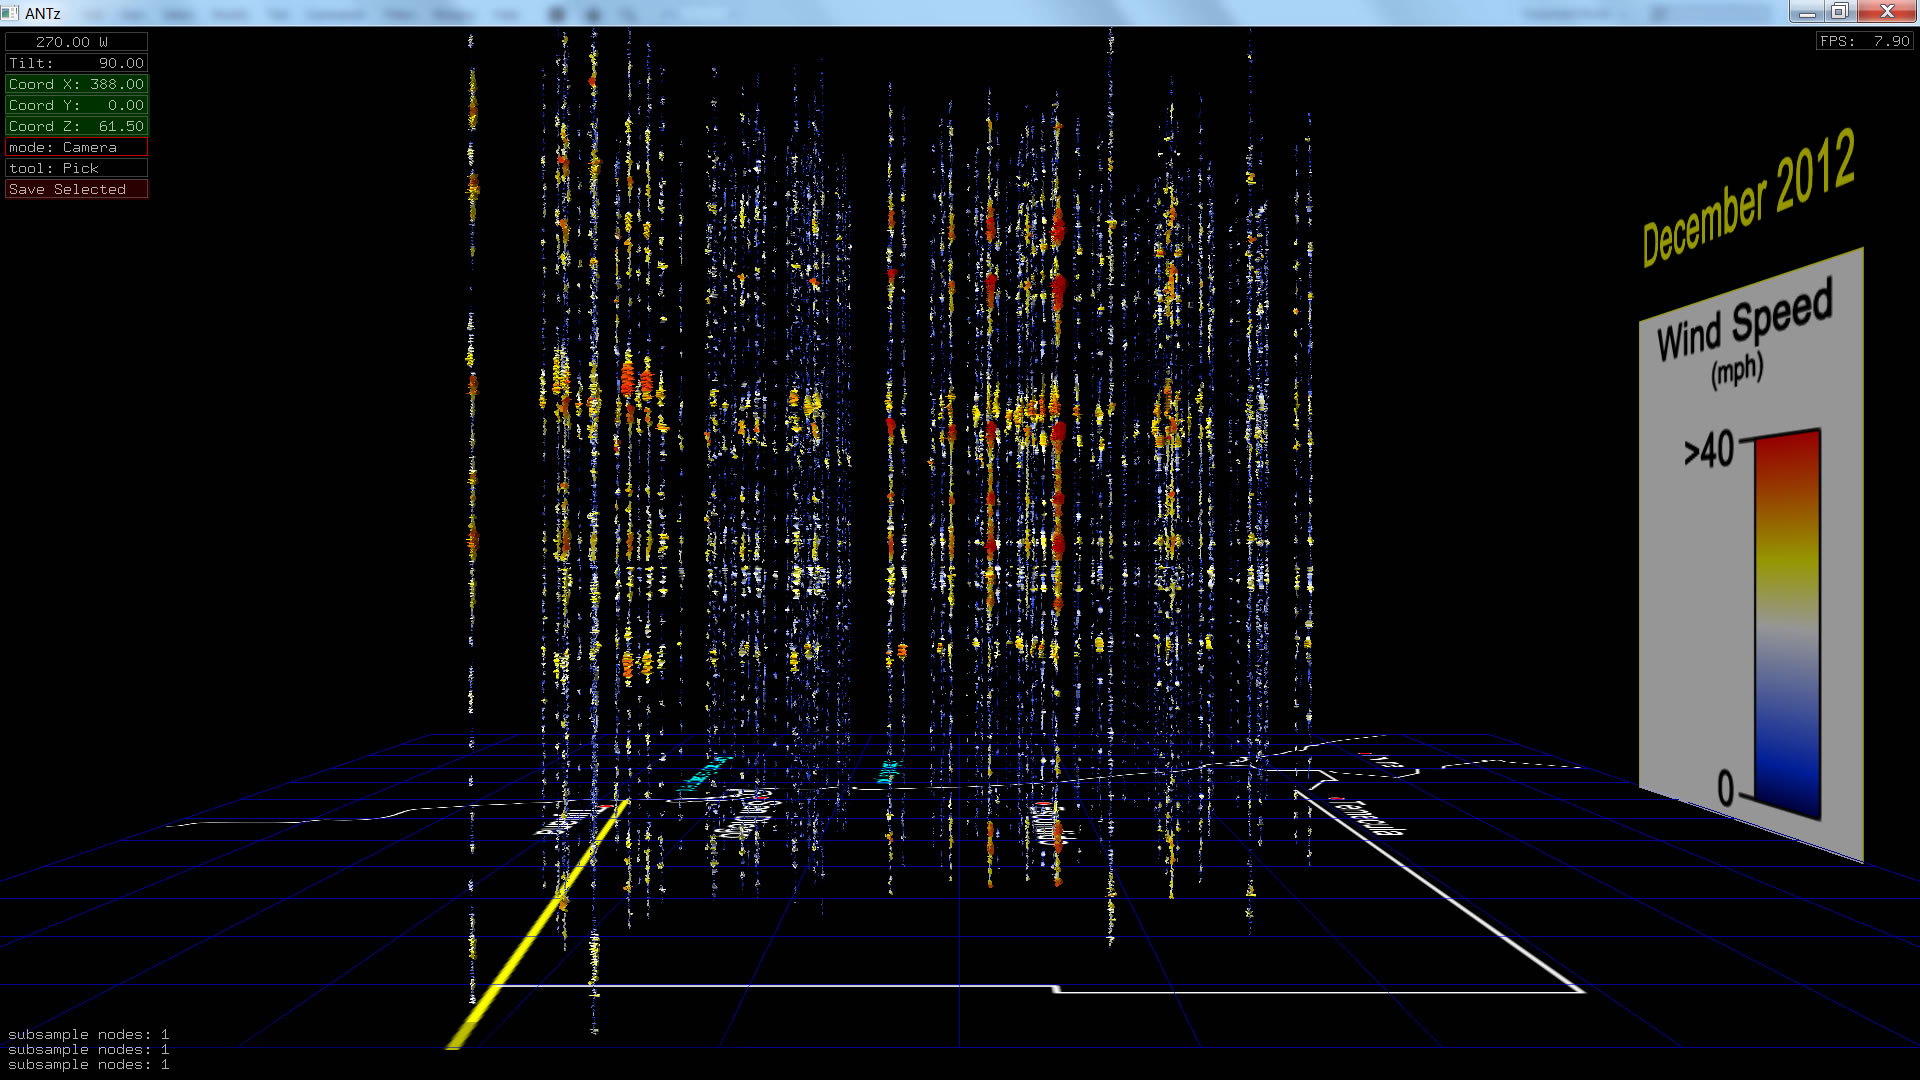
December 2012 |
 |
 |
 |
 |
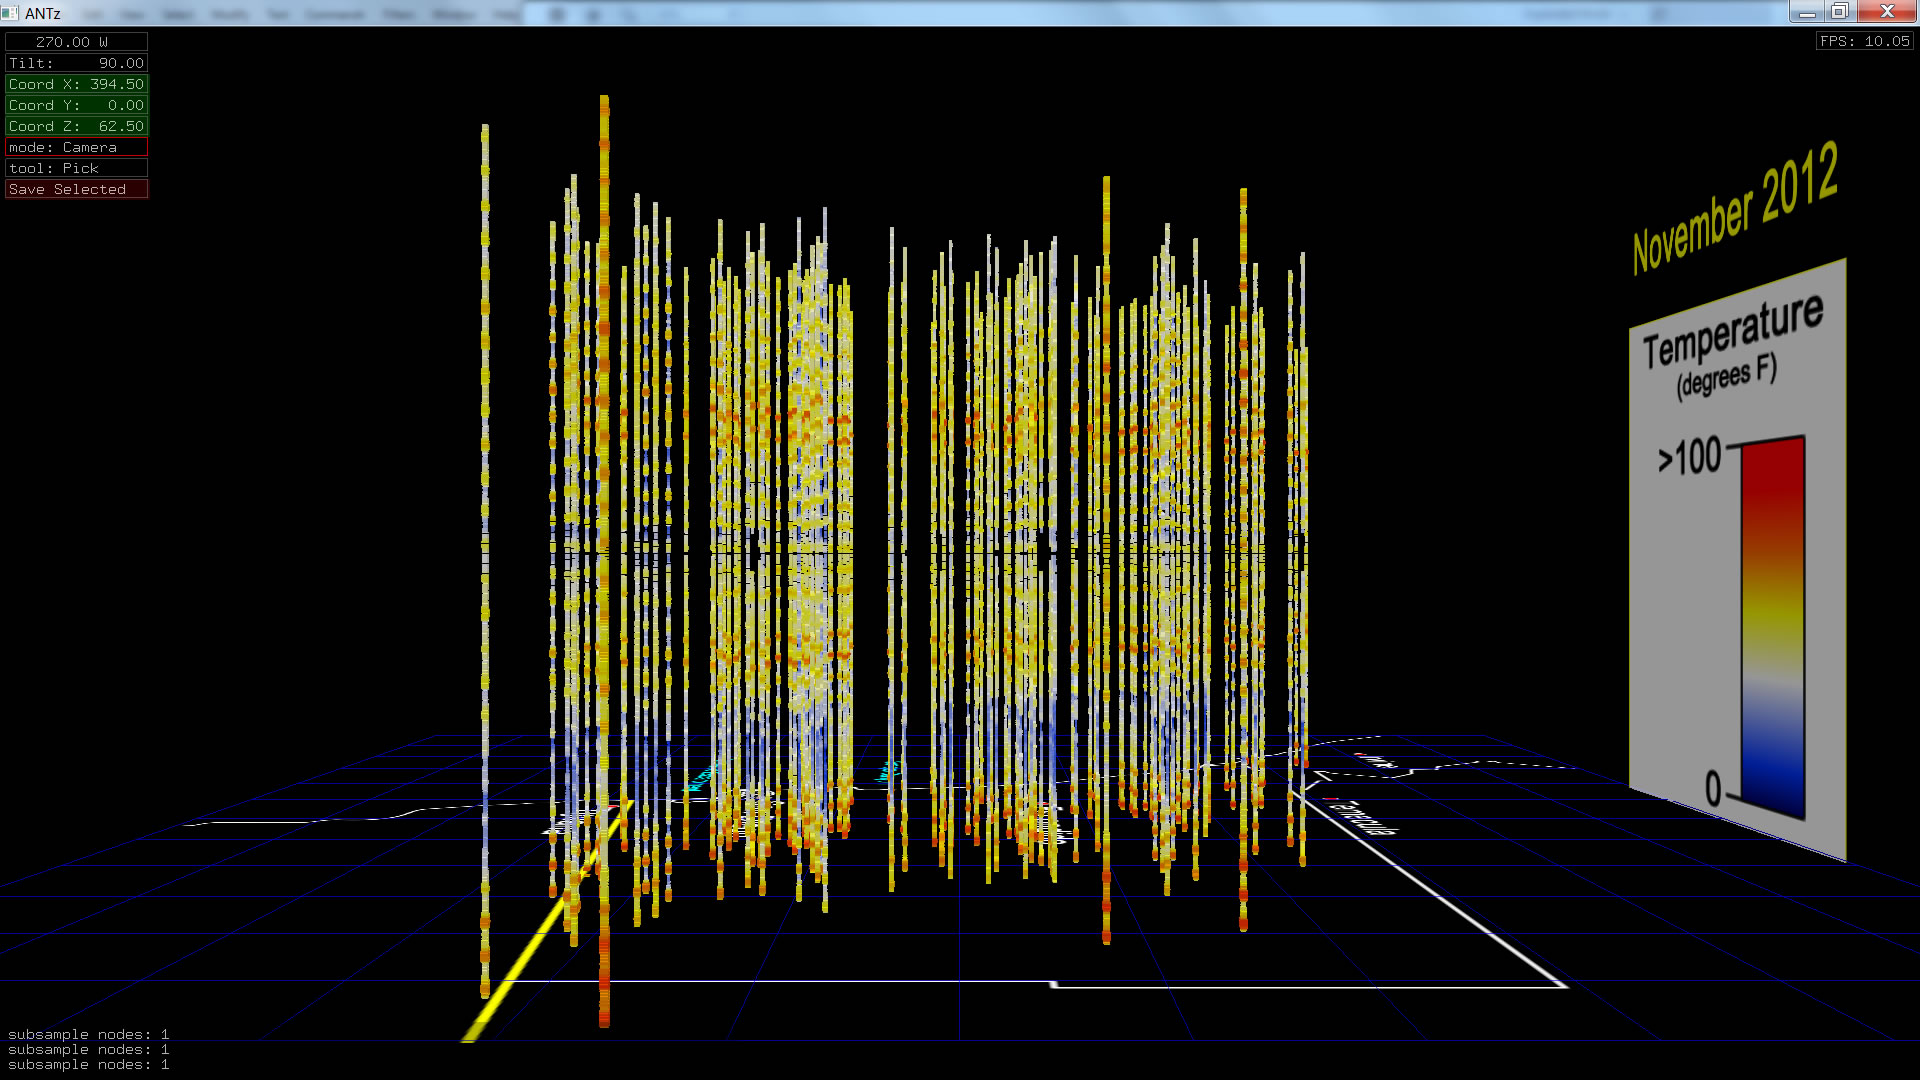
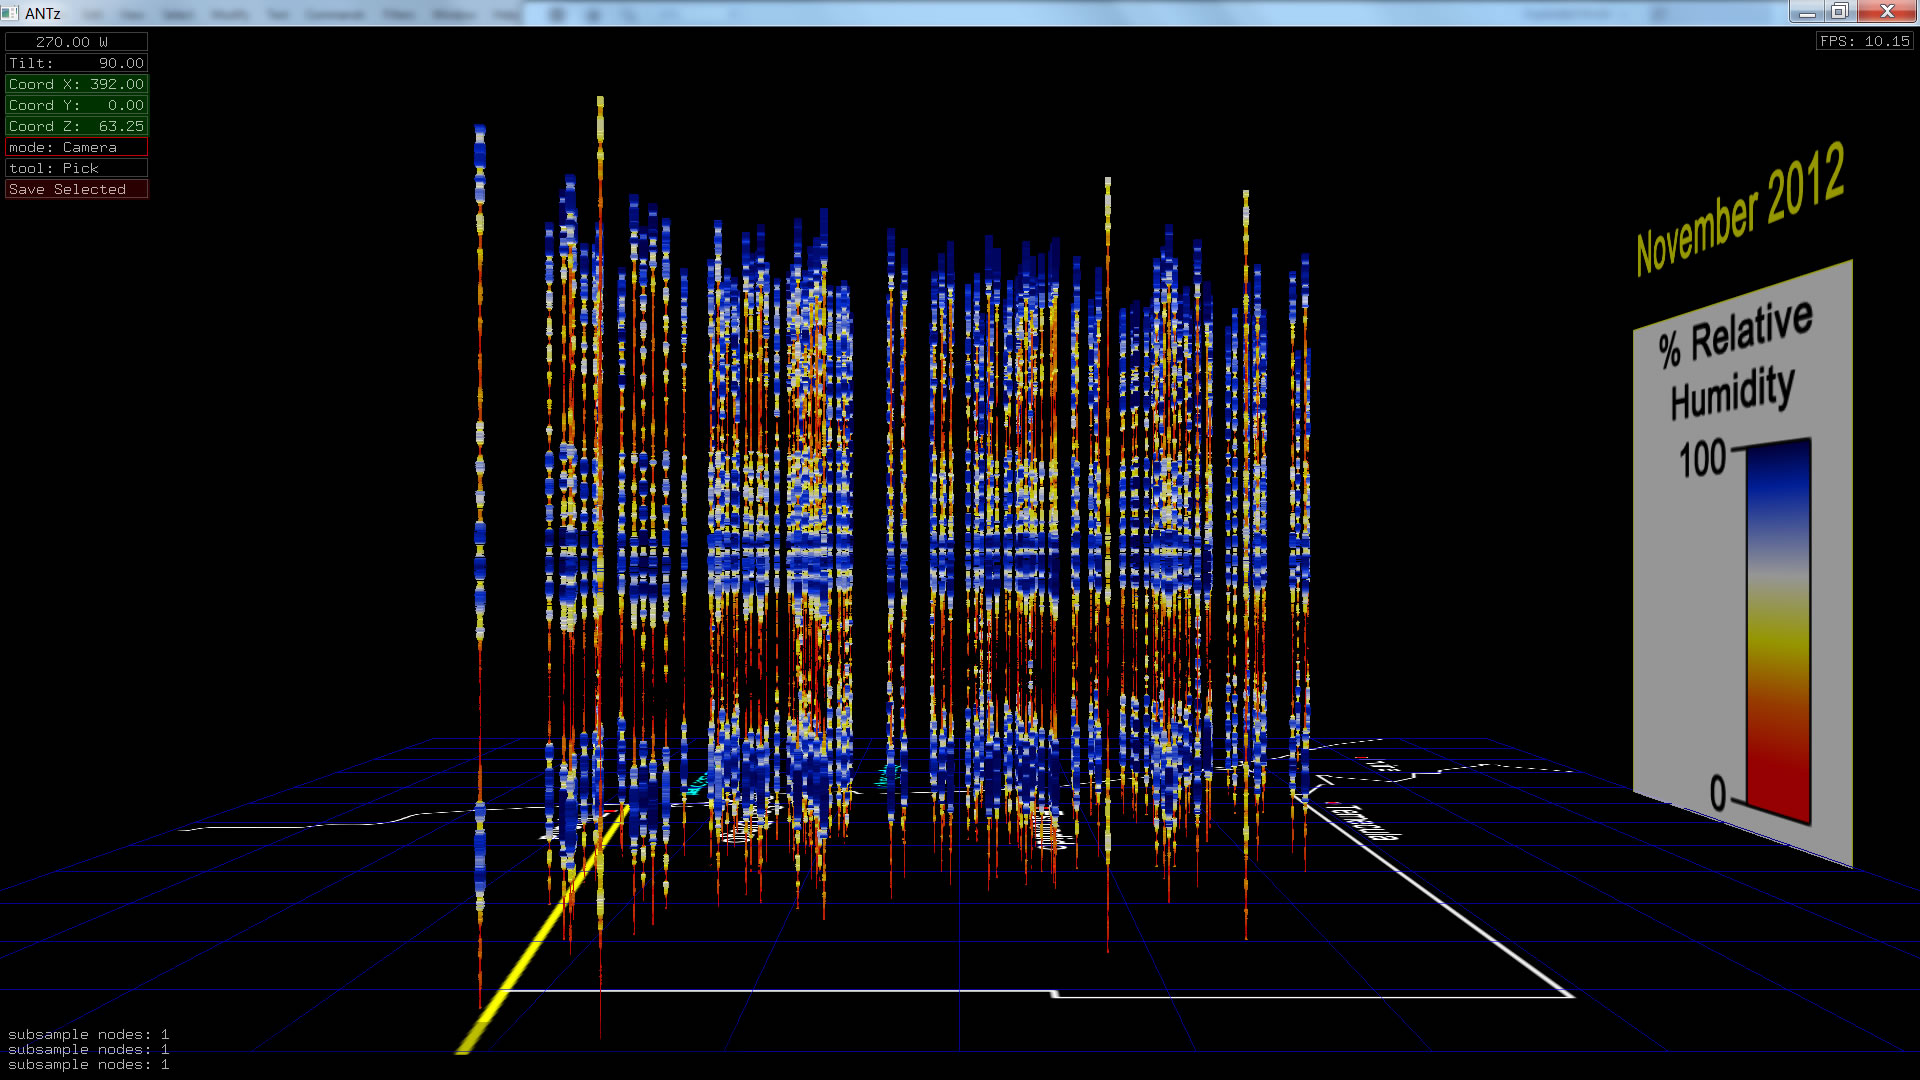
November 2012 |
 |
 |
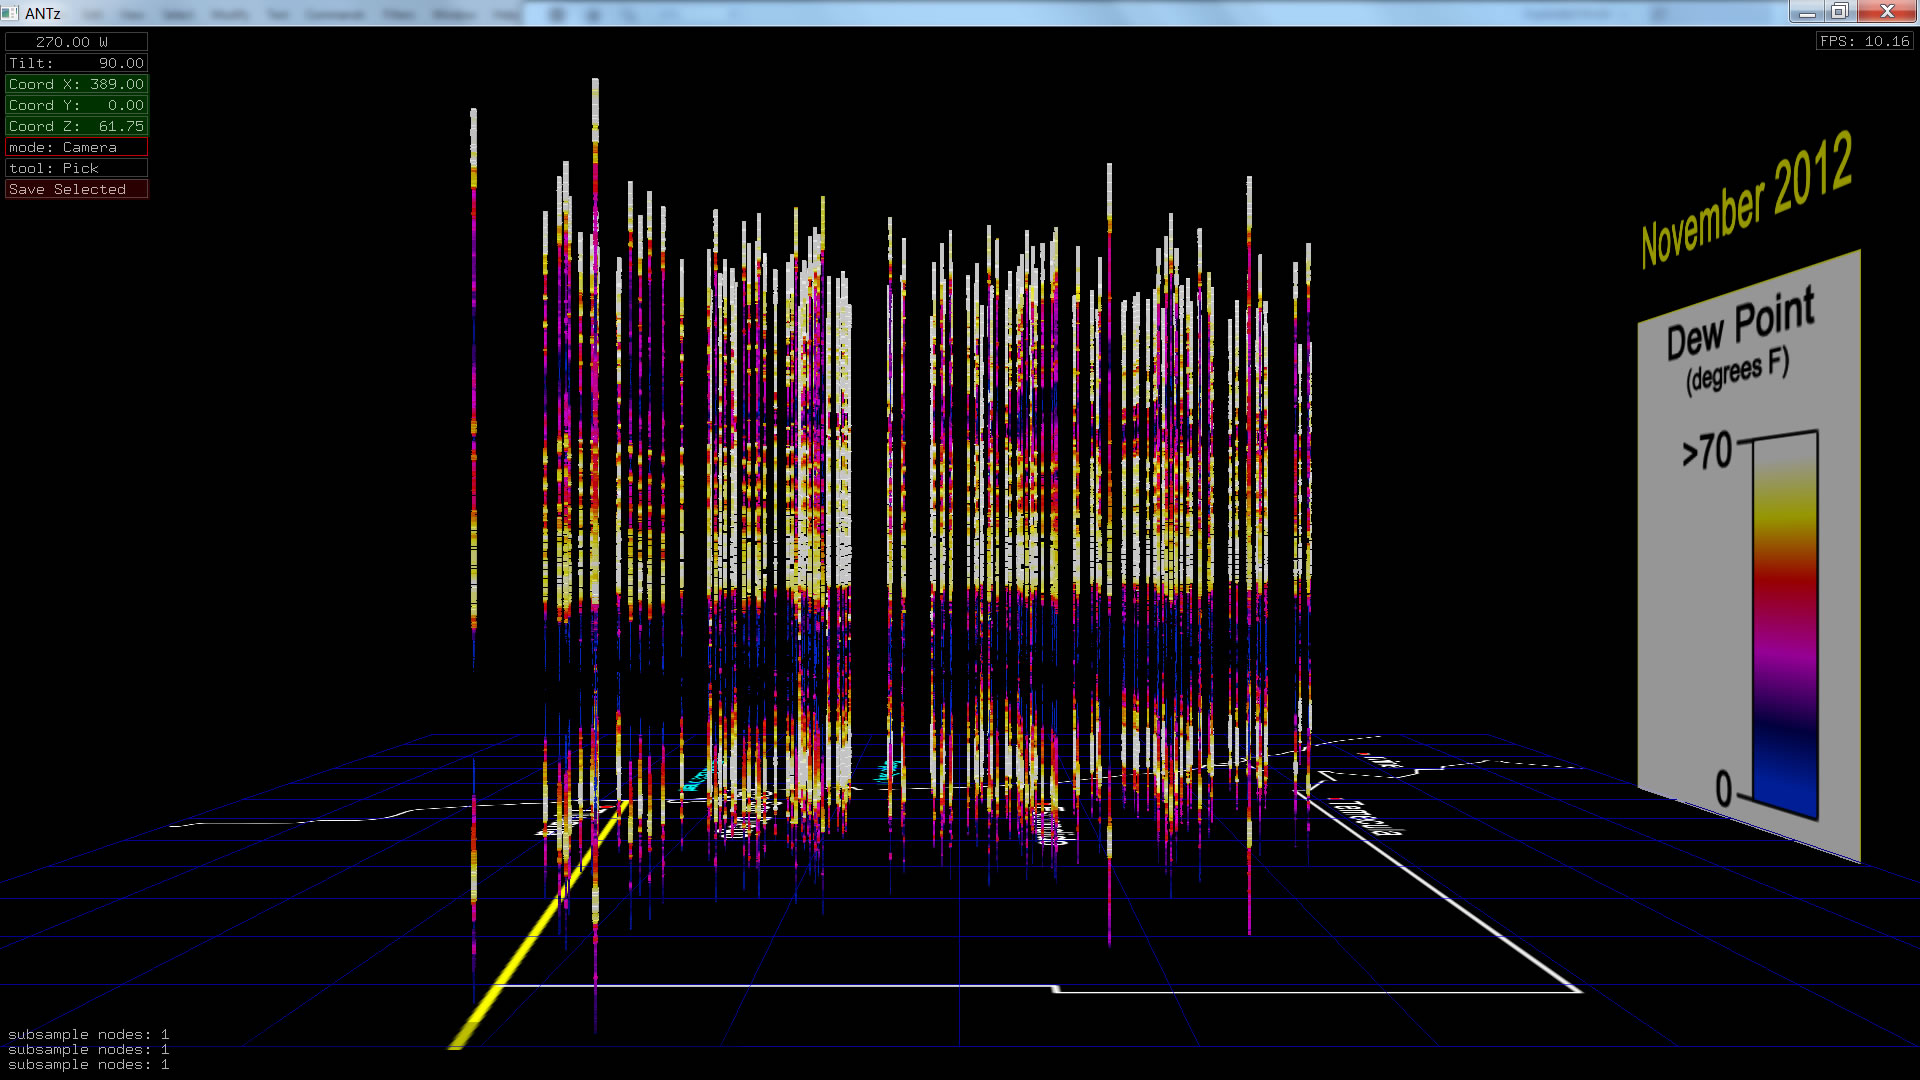 |
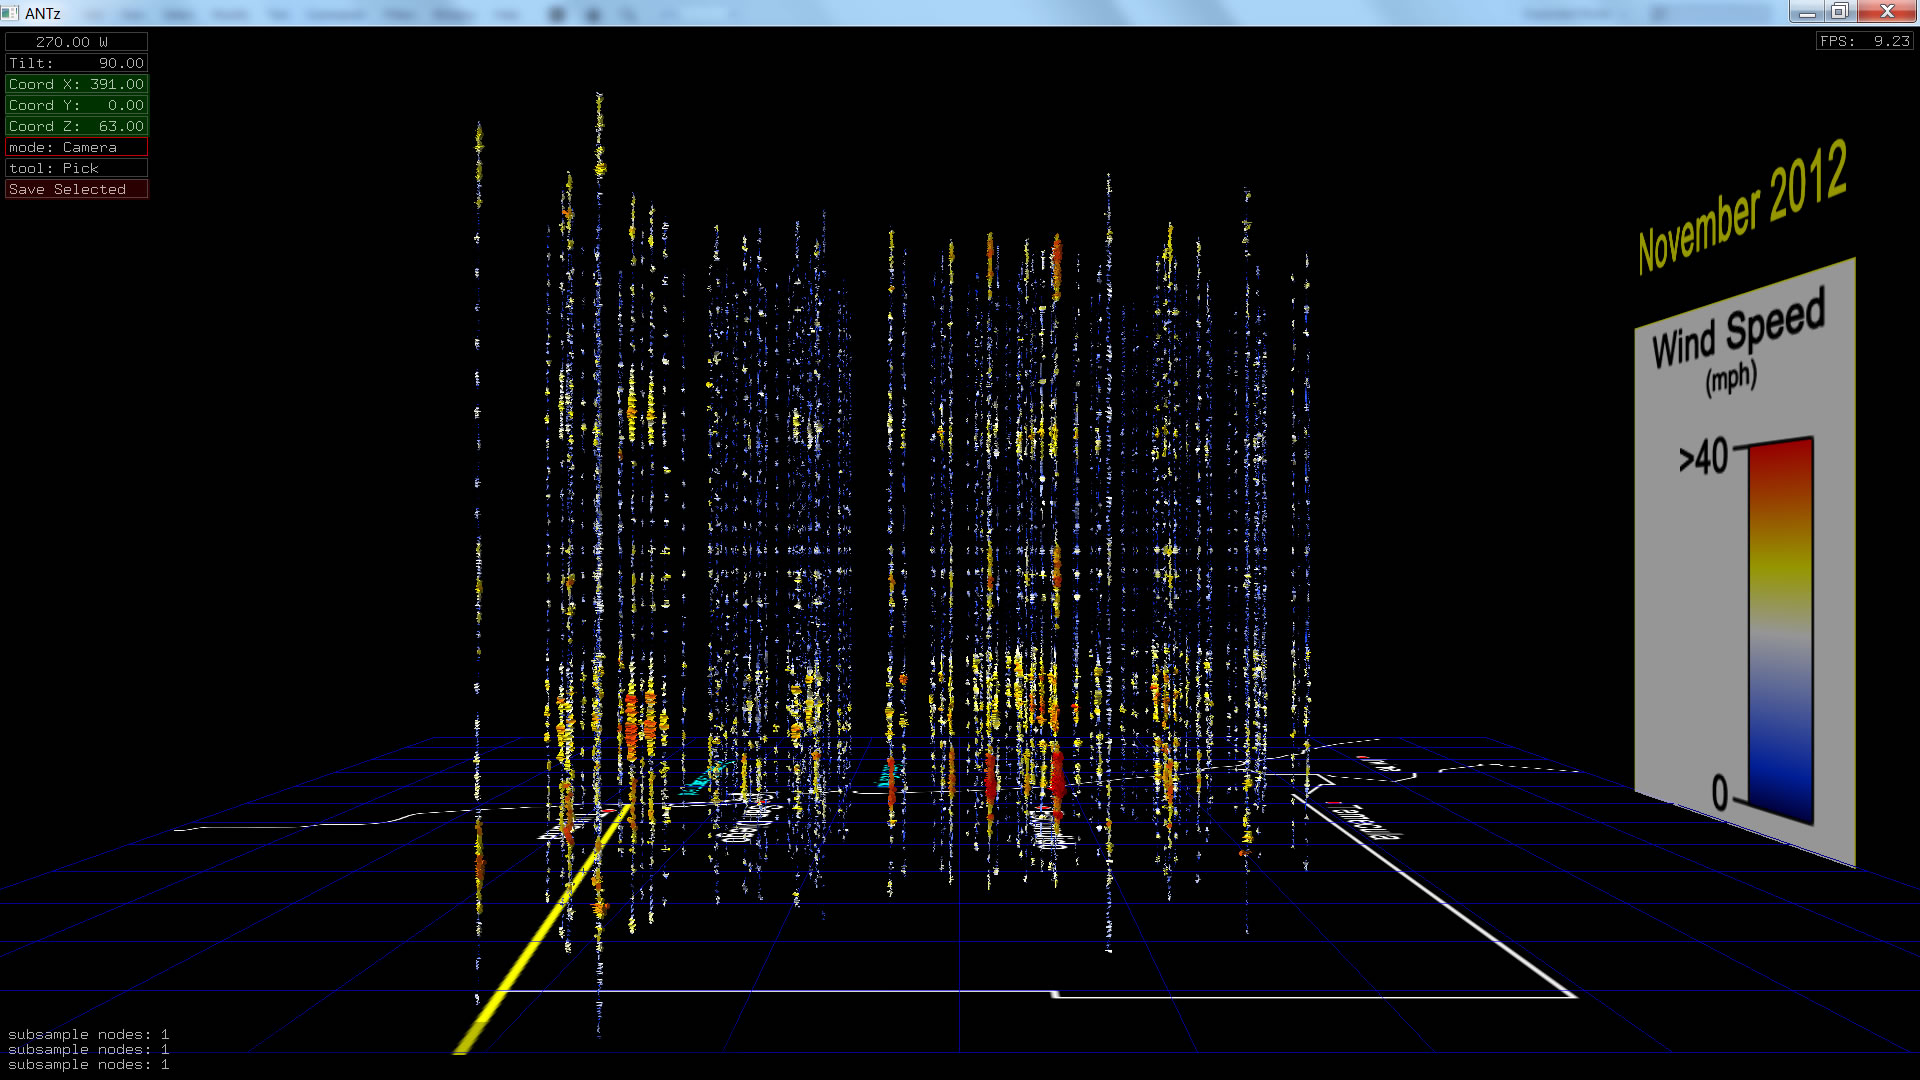 |
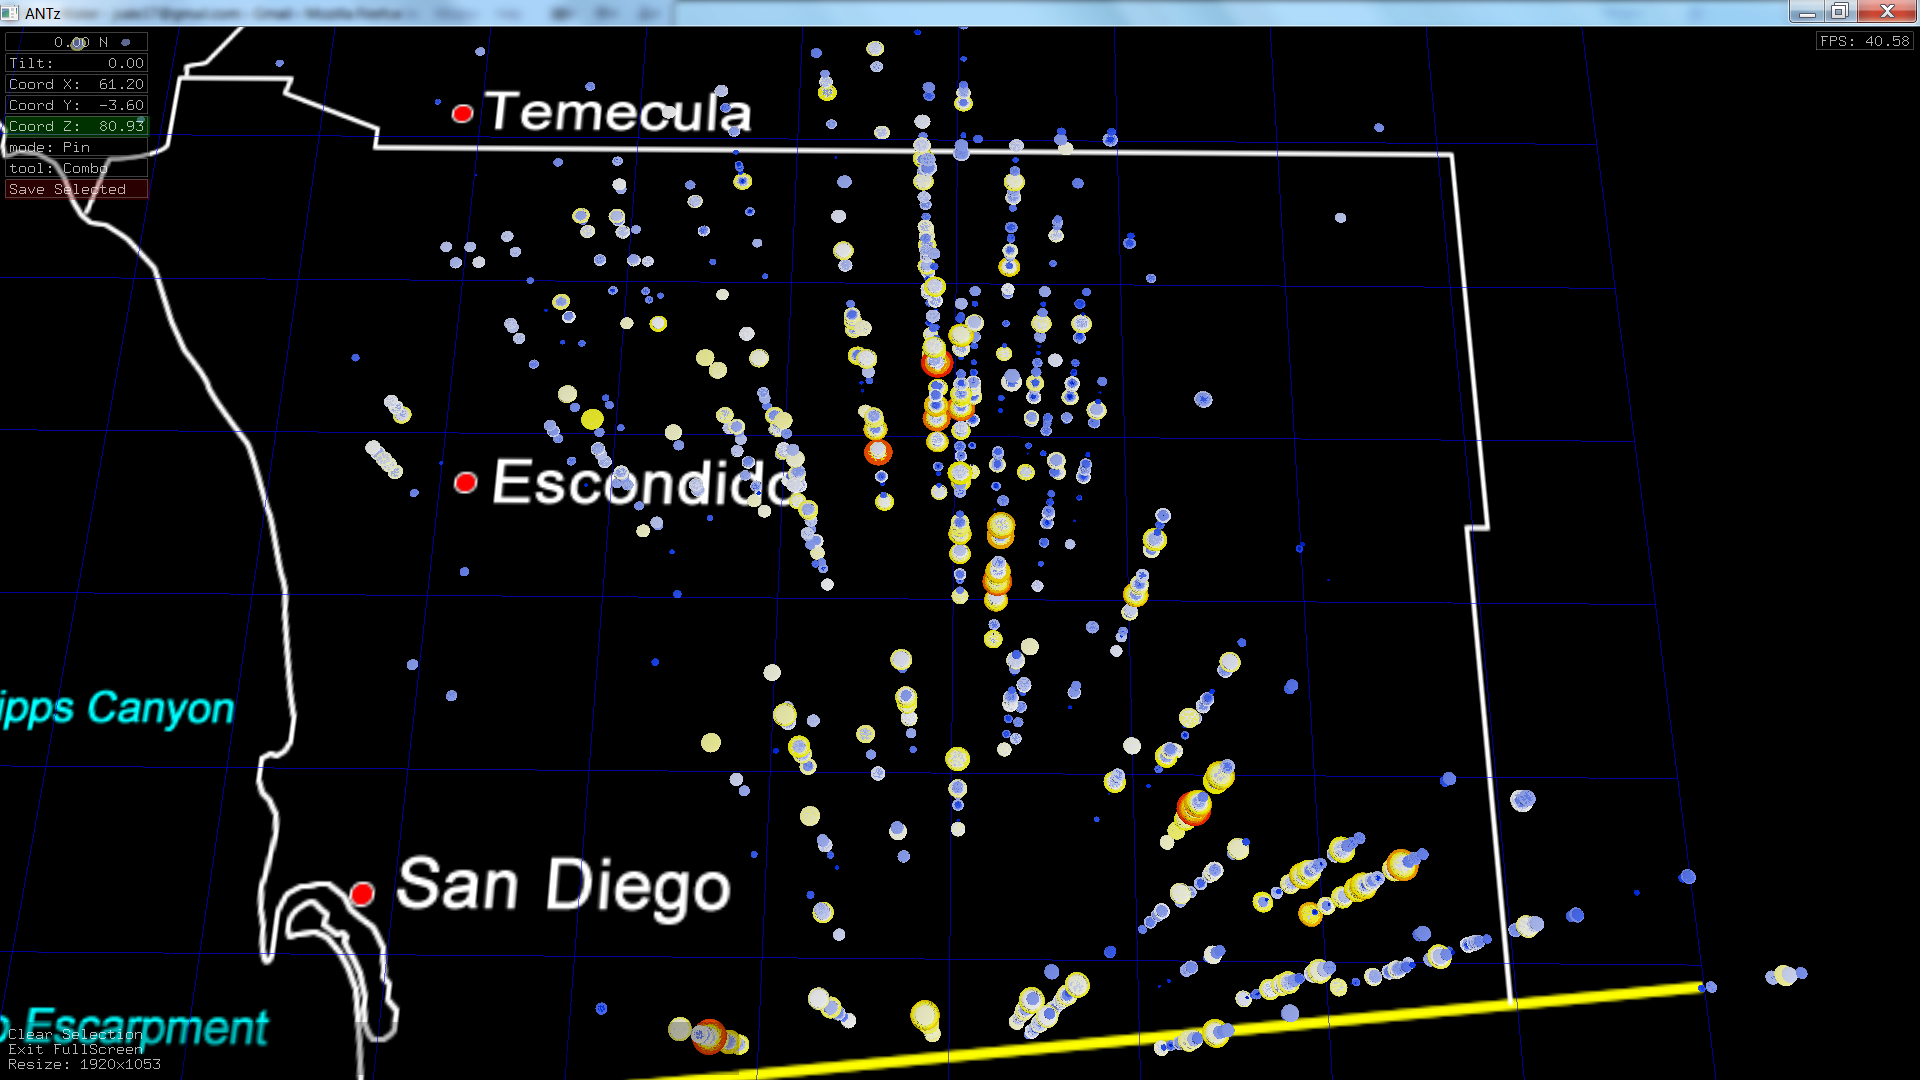
December Wind speed and direction using ANTz Channels:
(View a higher quality version)
Demo Video (includes HPWREN/SDGE Weather data)
Download fire alert data ANTz viz
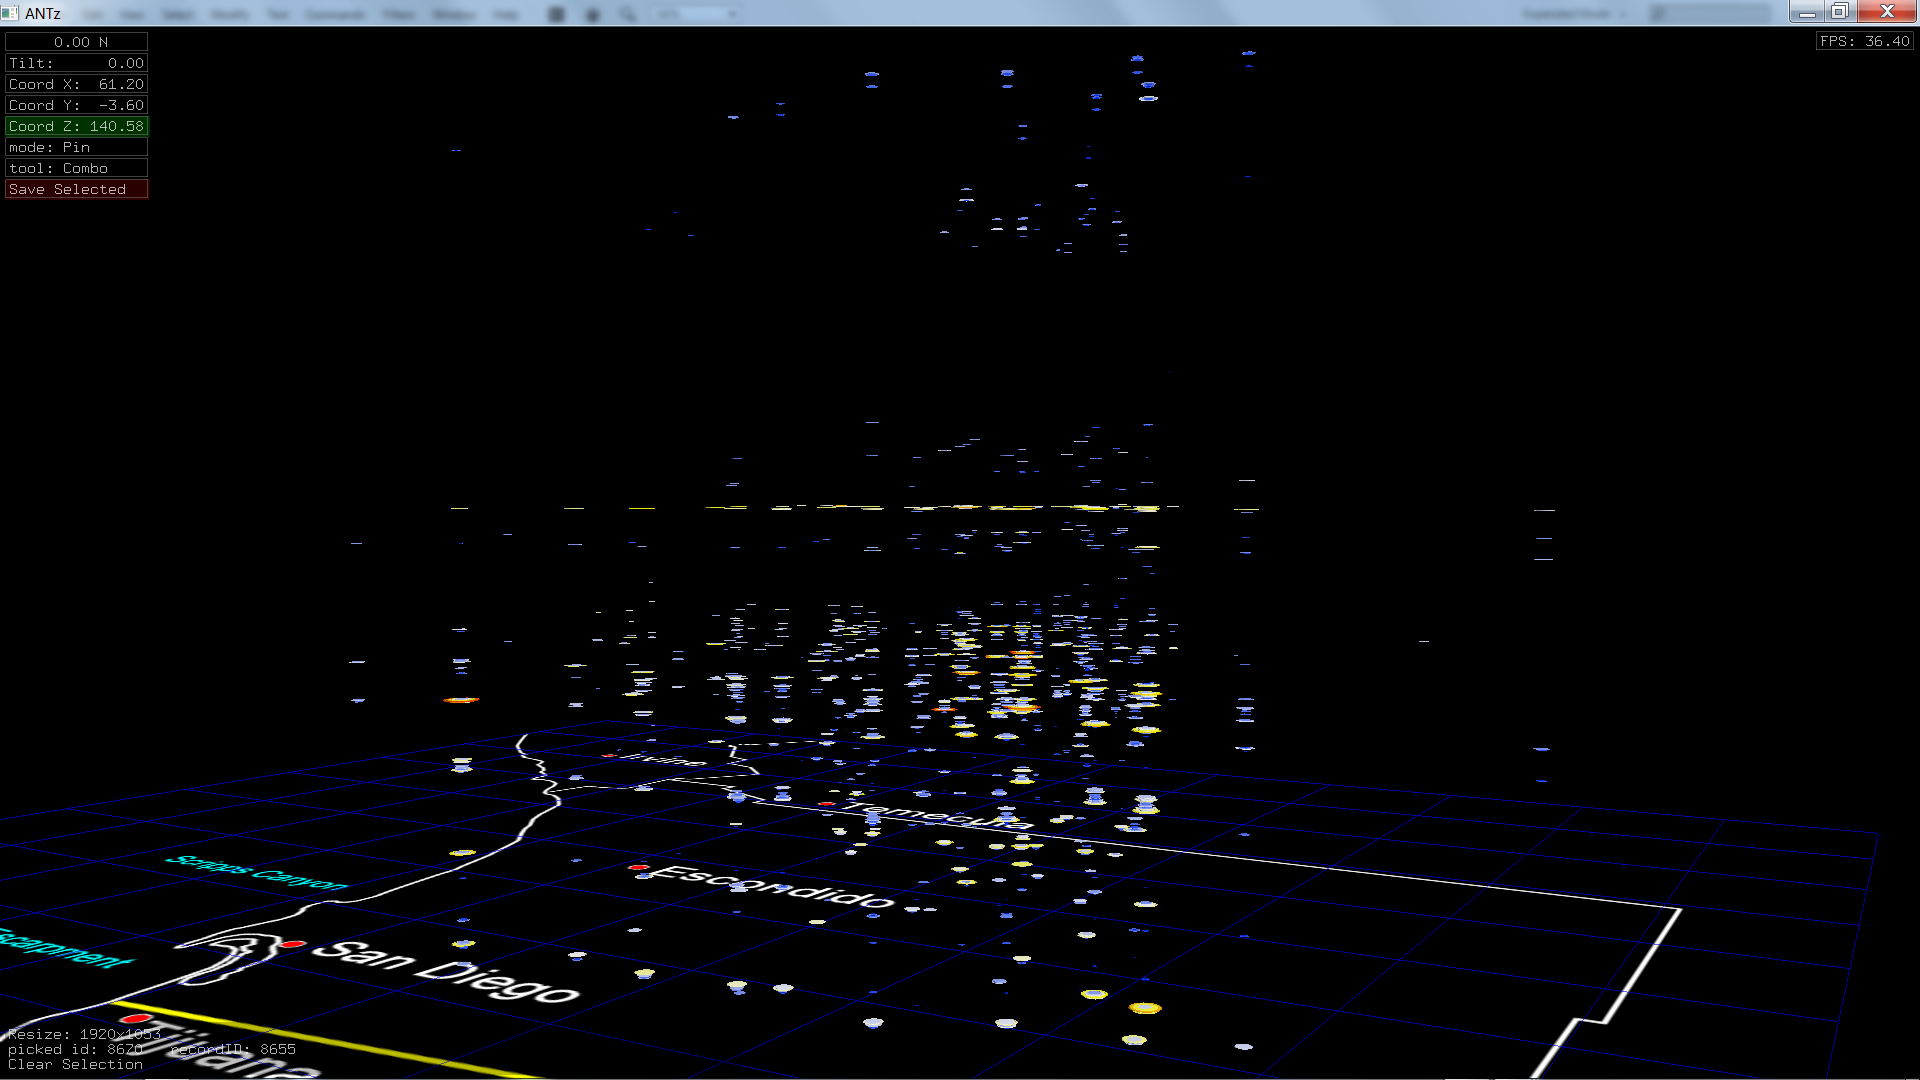
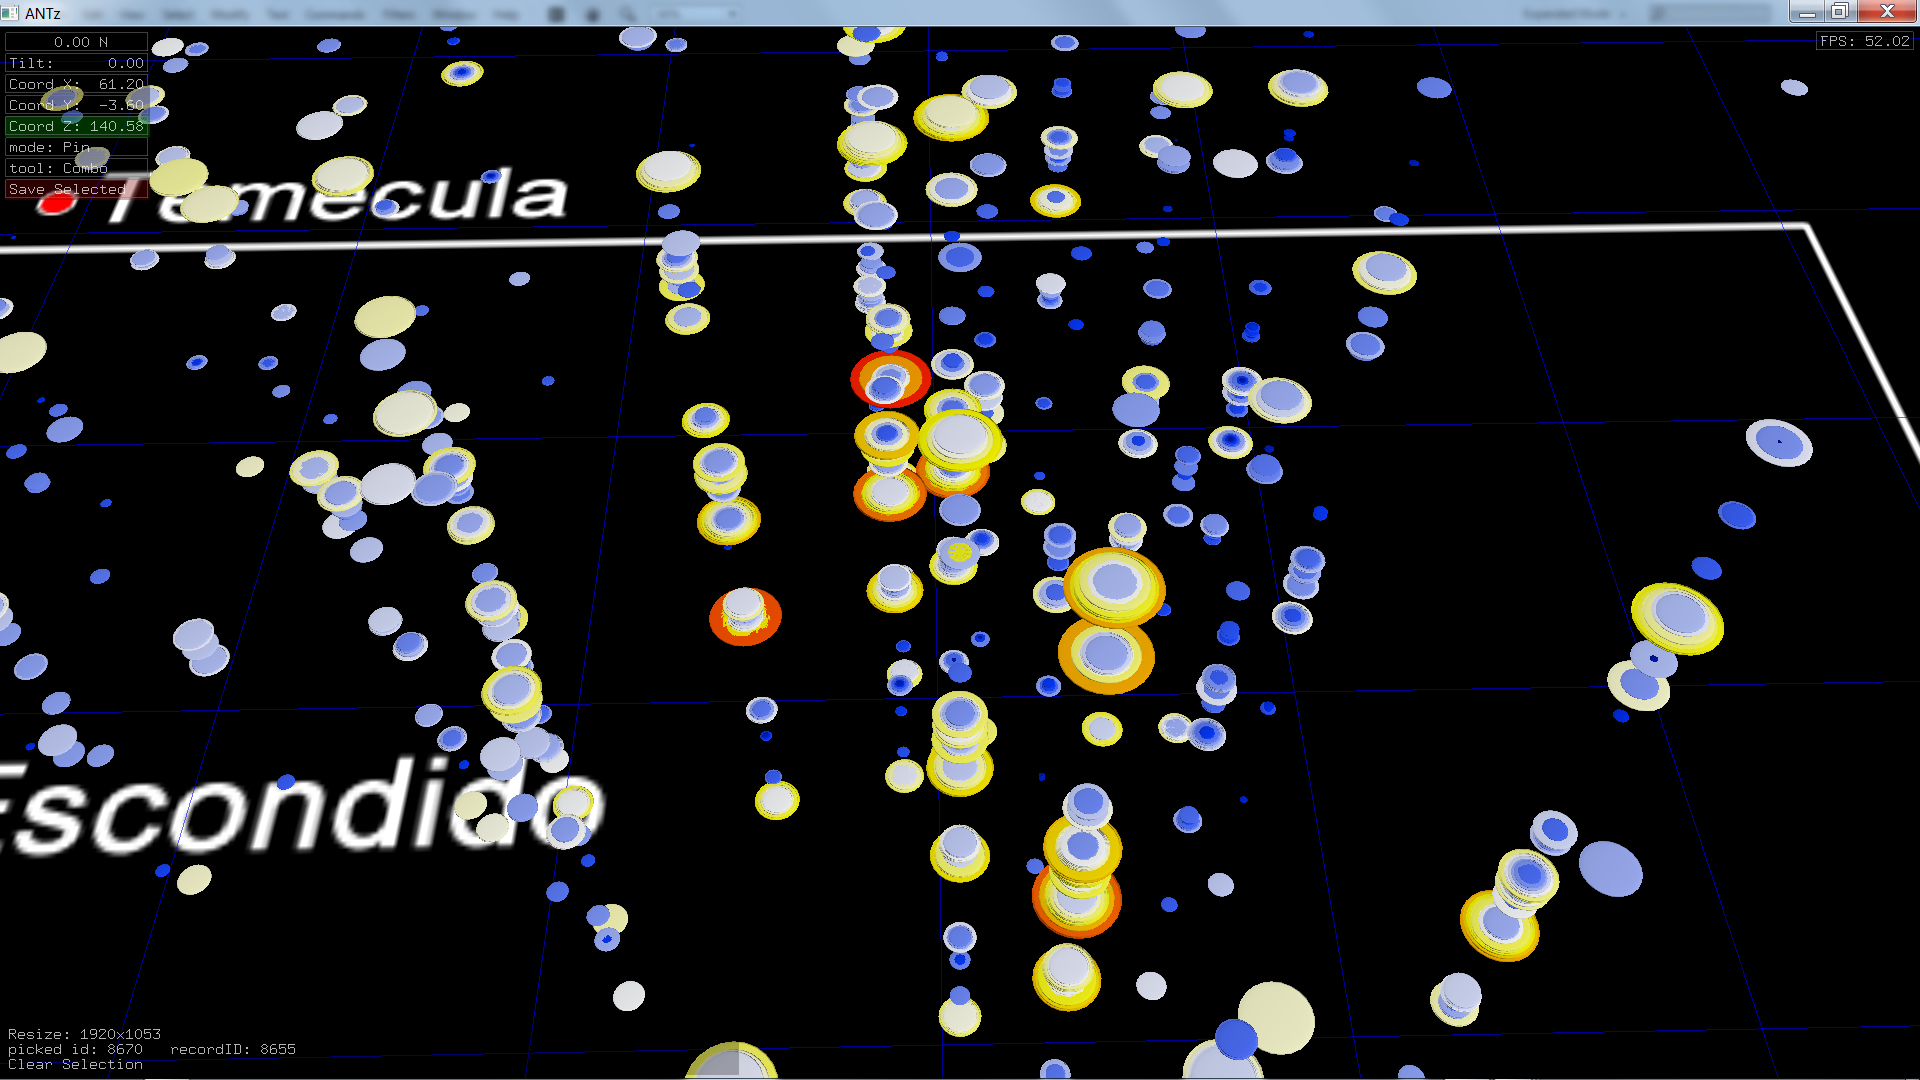
HPWREN has established fire alert thresholds for wind speed and direction and humidity. In this visualization fire alert states for the past year (November 2012 to October 2013) are rendered with color and scale representing the 'severity' of the fire alert status (time is vertical, use the I key for Label information).
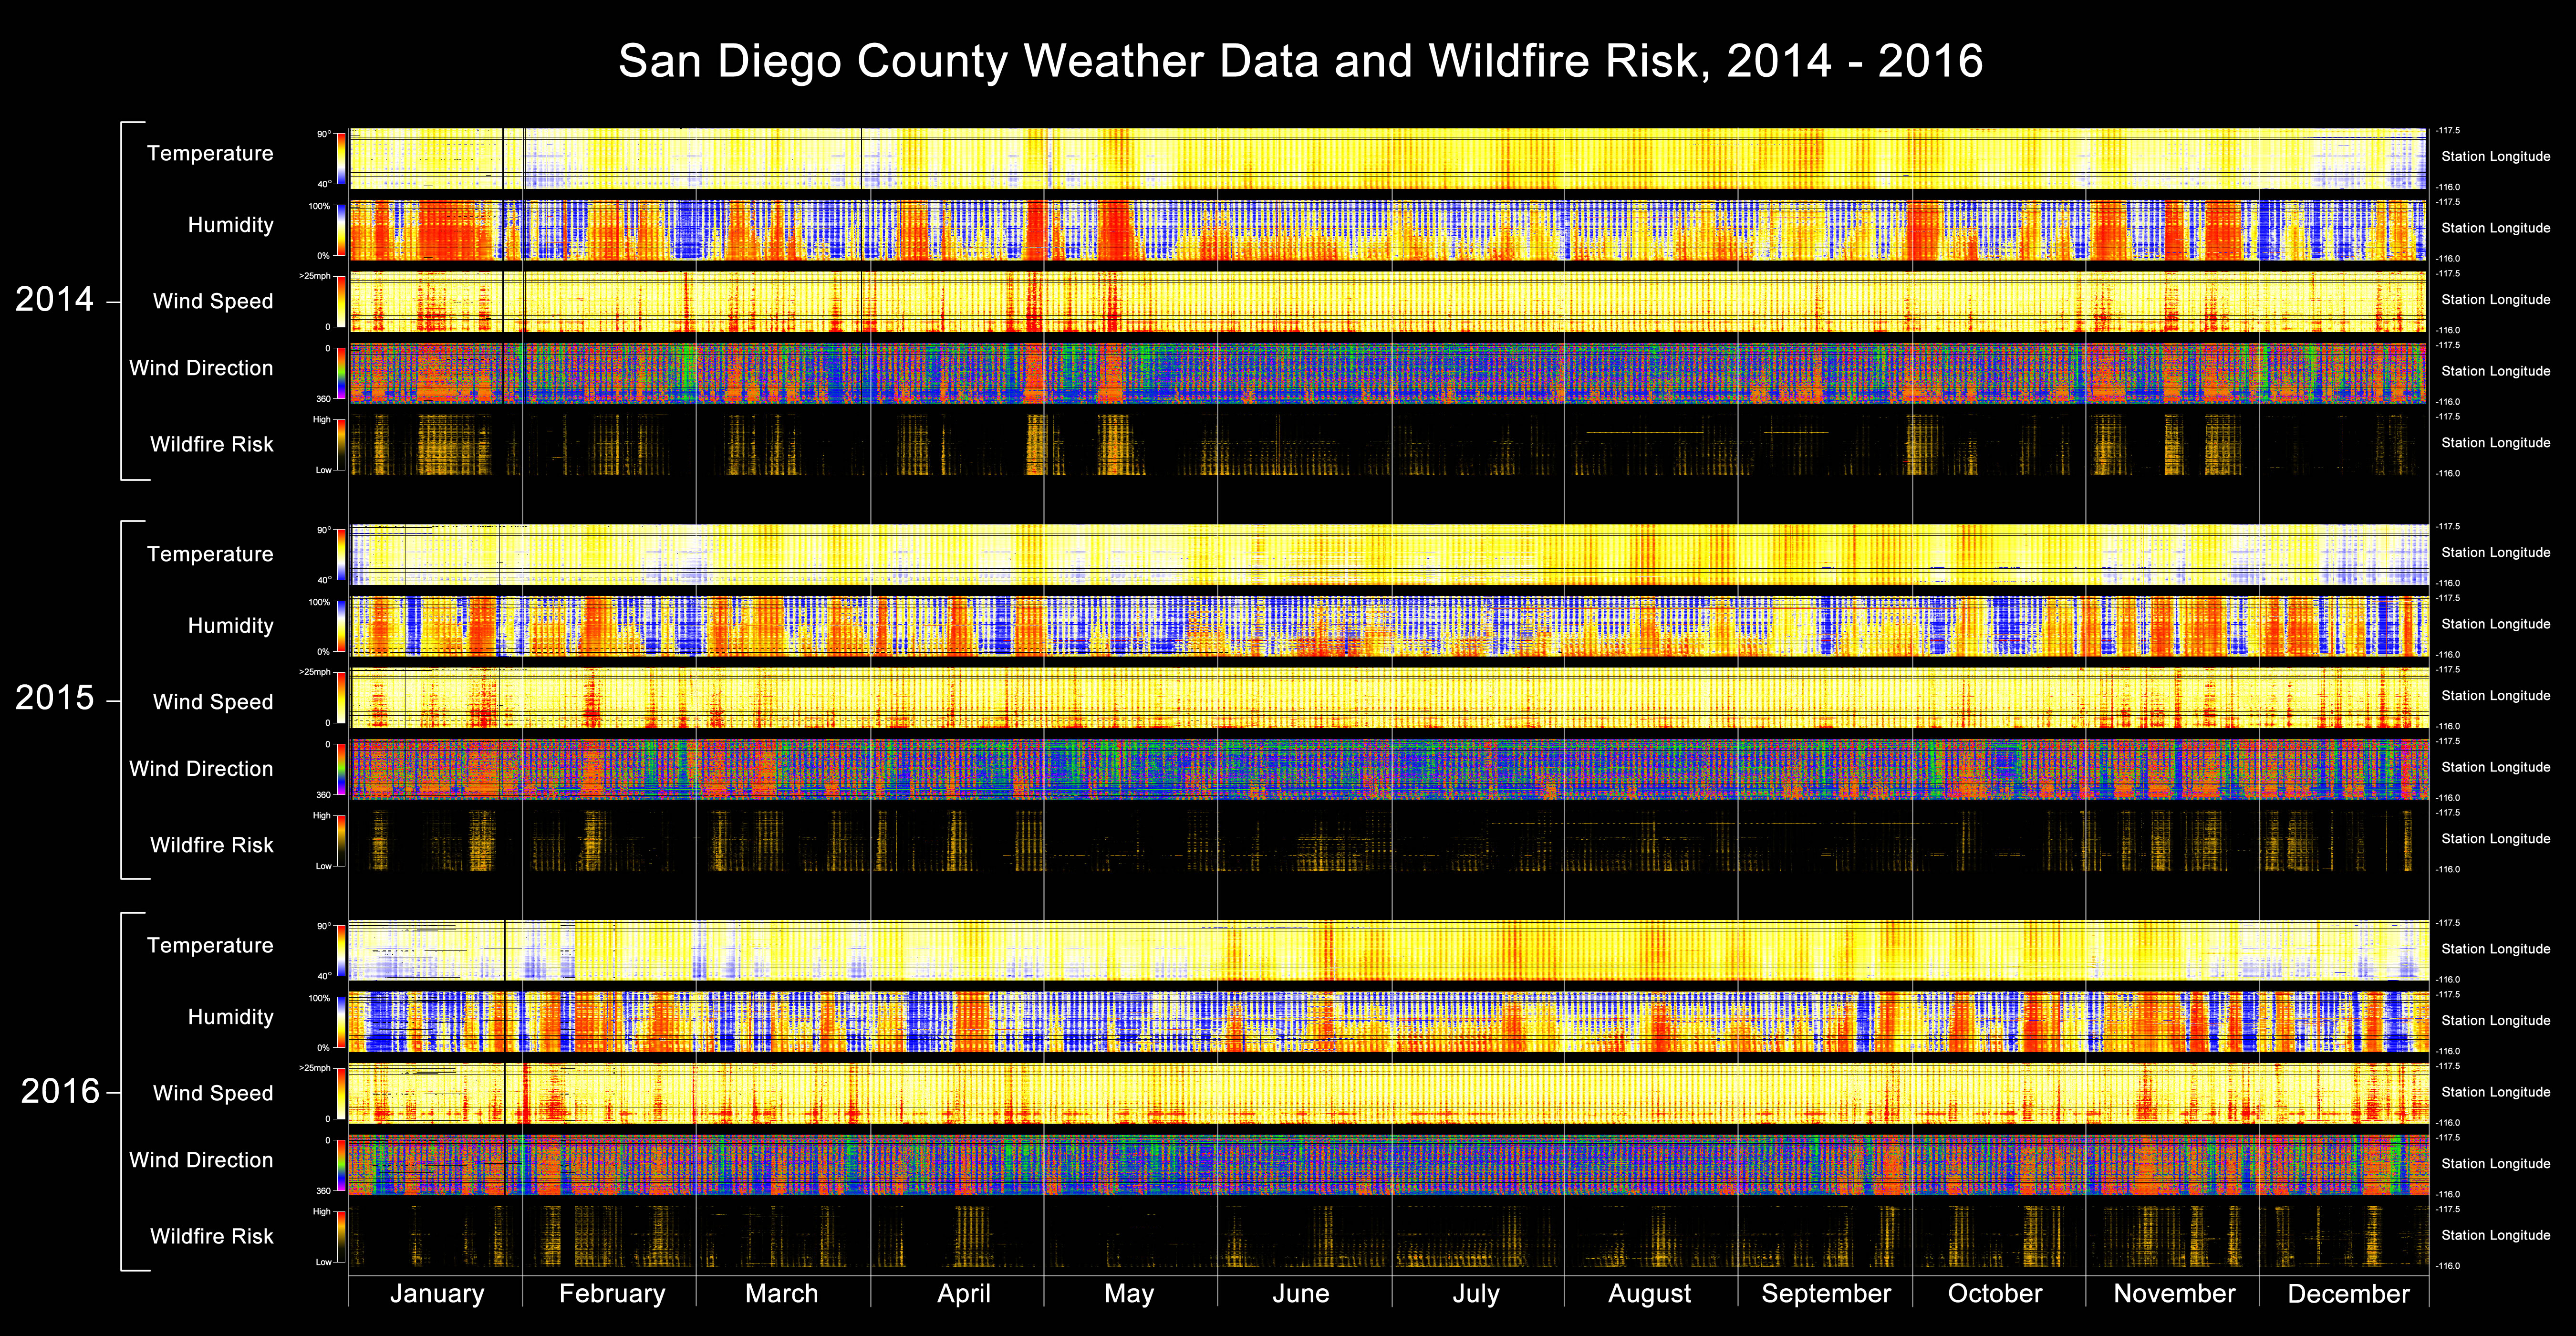
2D Weather Data and Fire Risk for 2014-2016
The visualization shown below uses the same data but in a 2D format. ANTz was not used for this visualization.