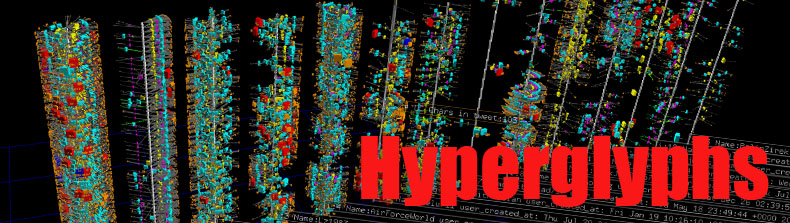
Advanced Visualization of Physiometric Data
Latest, Includes DEM data
Download a ZIP containing all necessary files (Windows executable)
Run the ANTz executable, hit the 1 key to load the physiometric data, hit the 2 key to load the DEM data, hit the P key to play the animation.
Older Versions
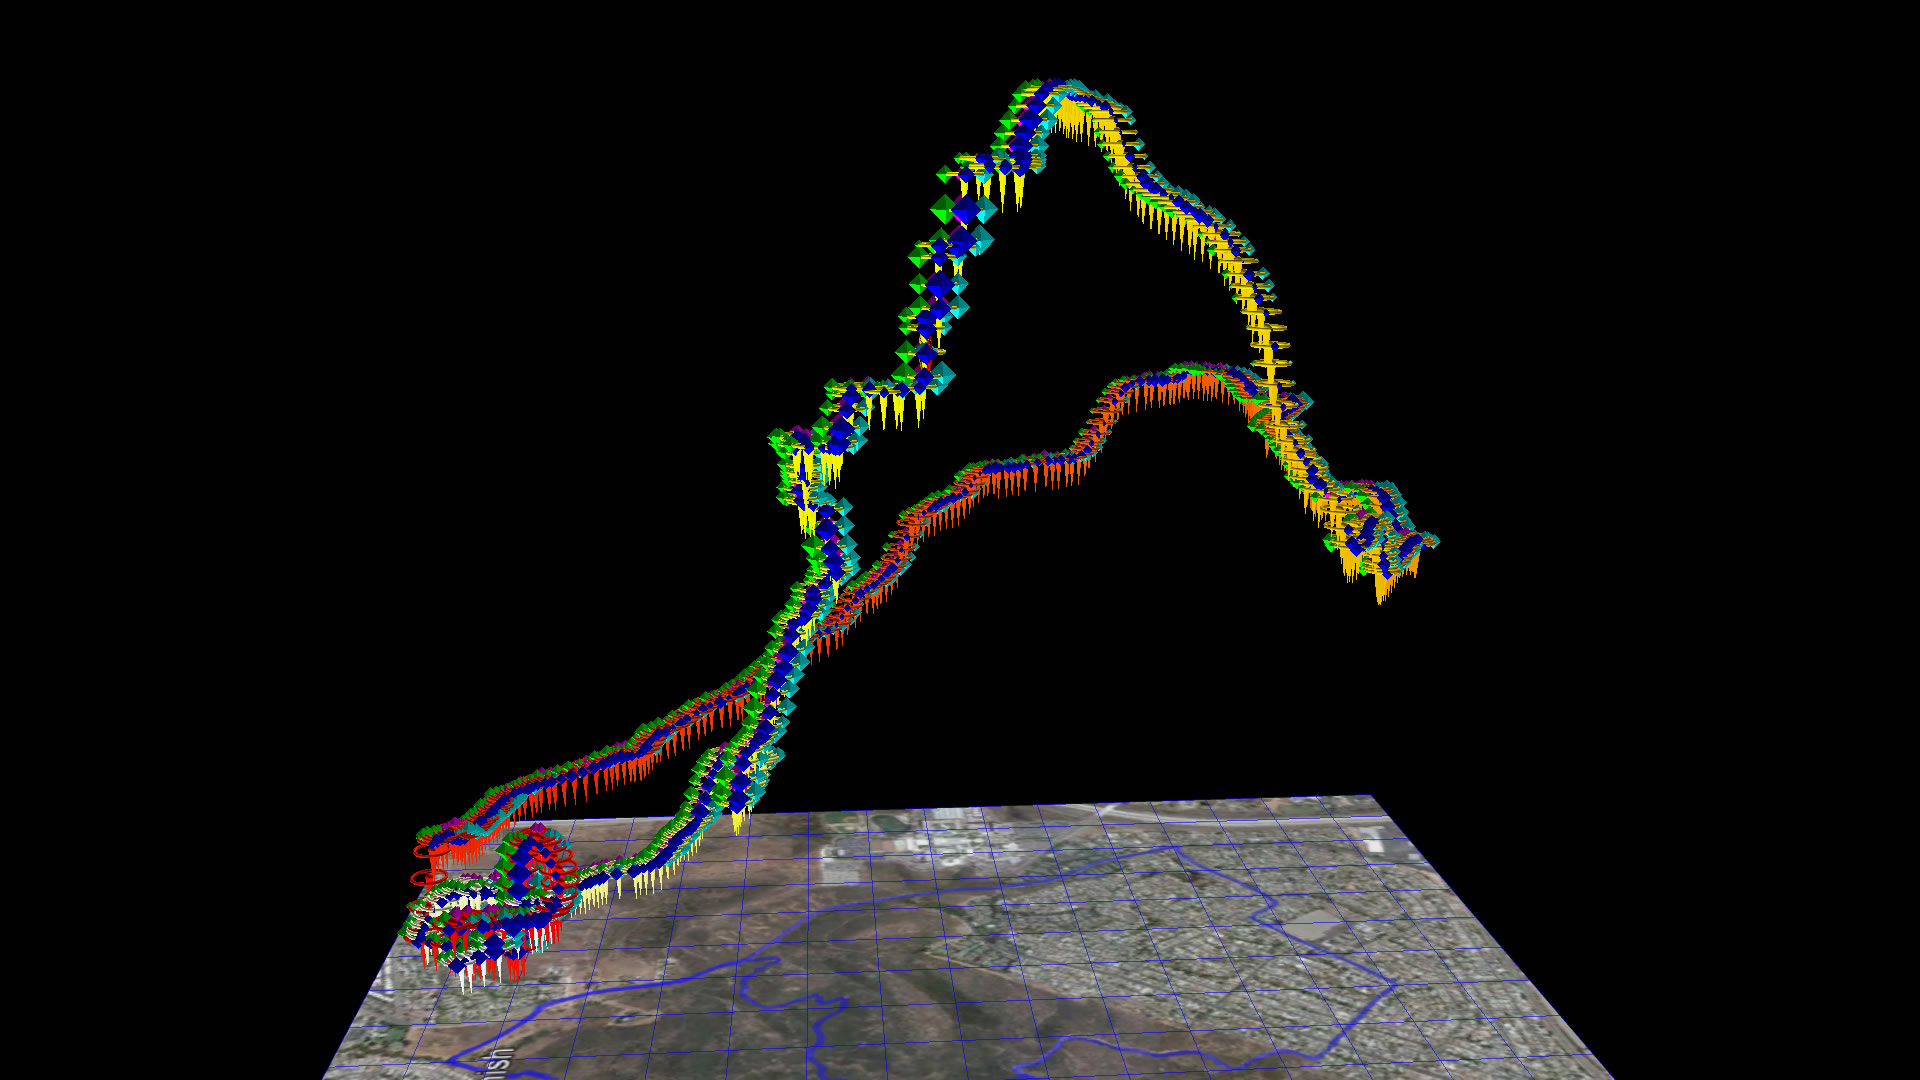
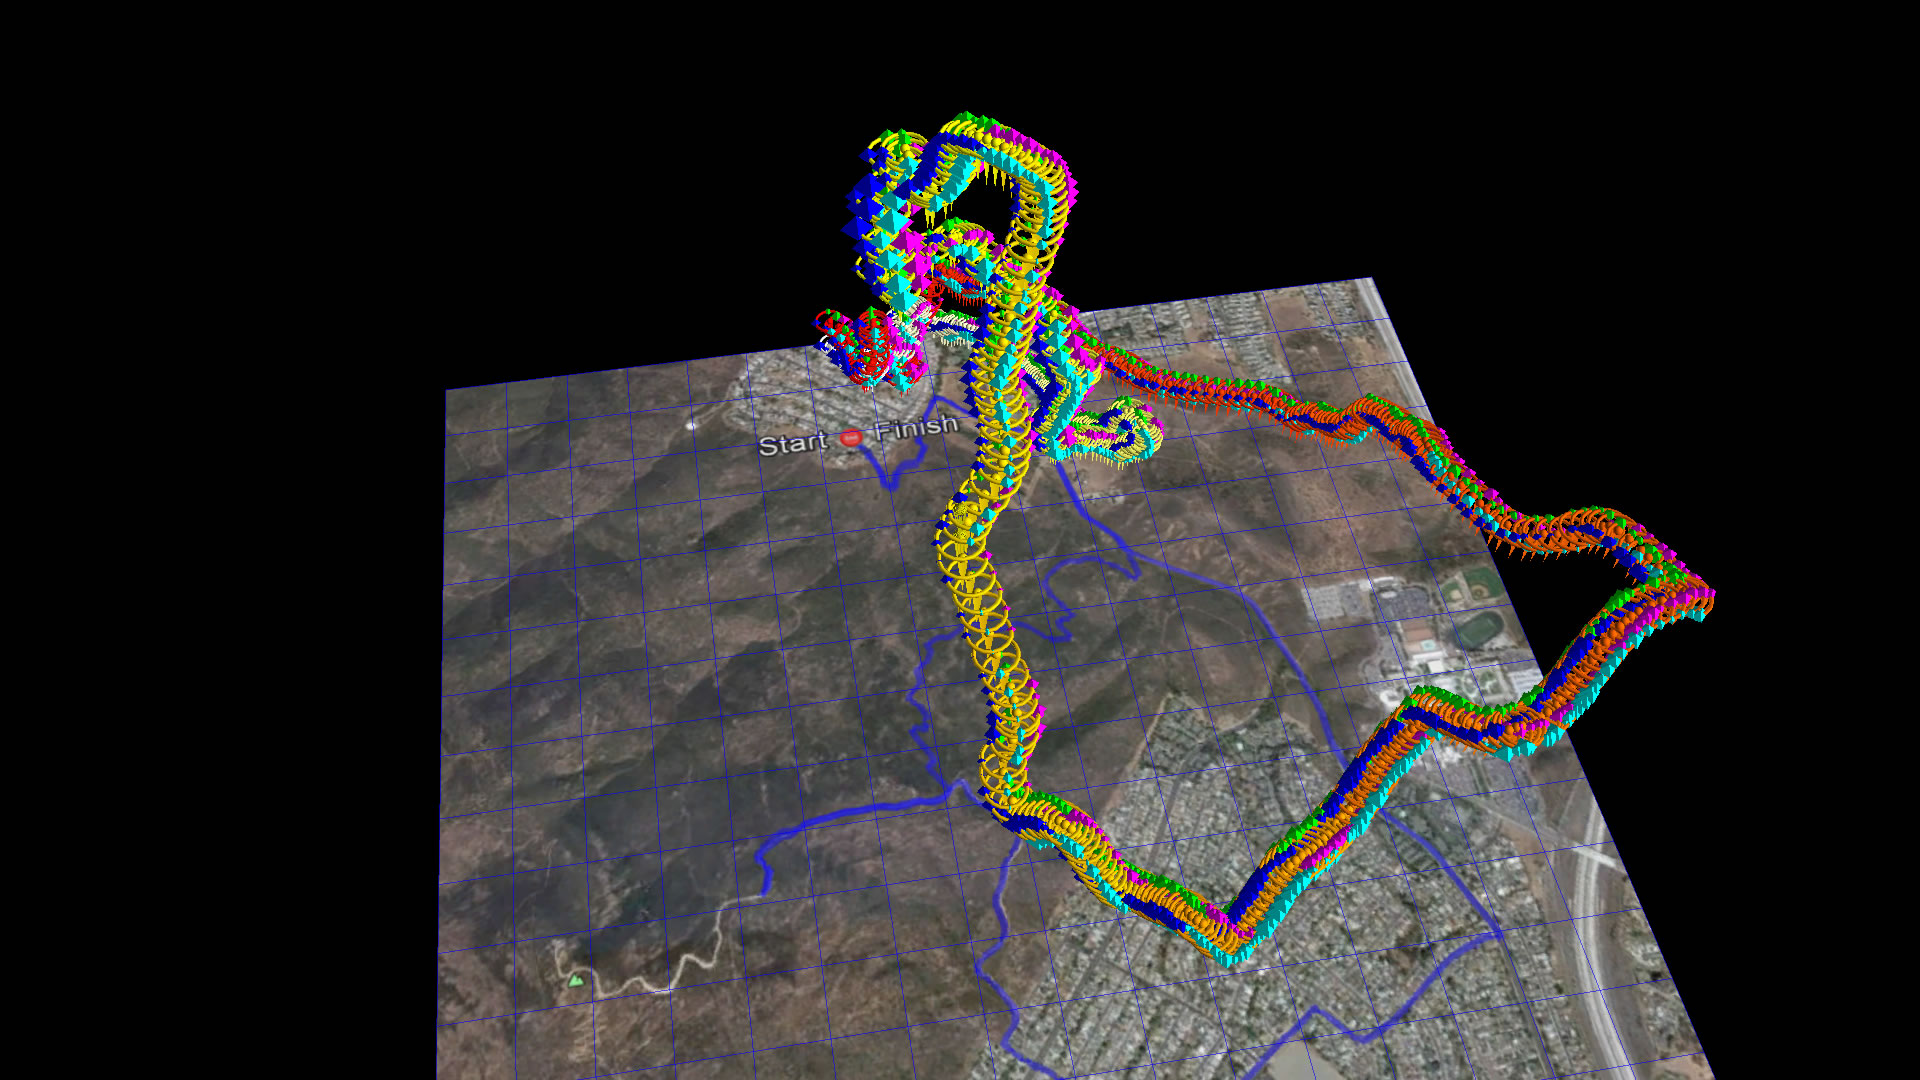
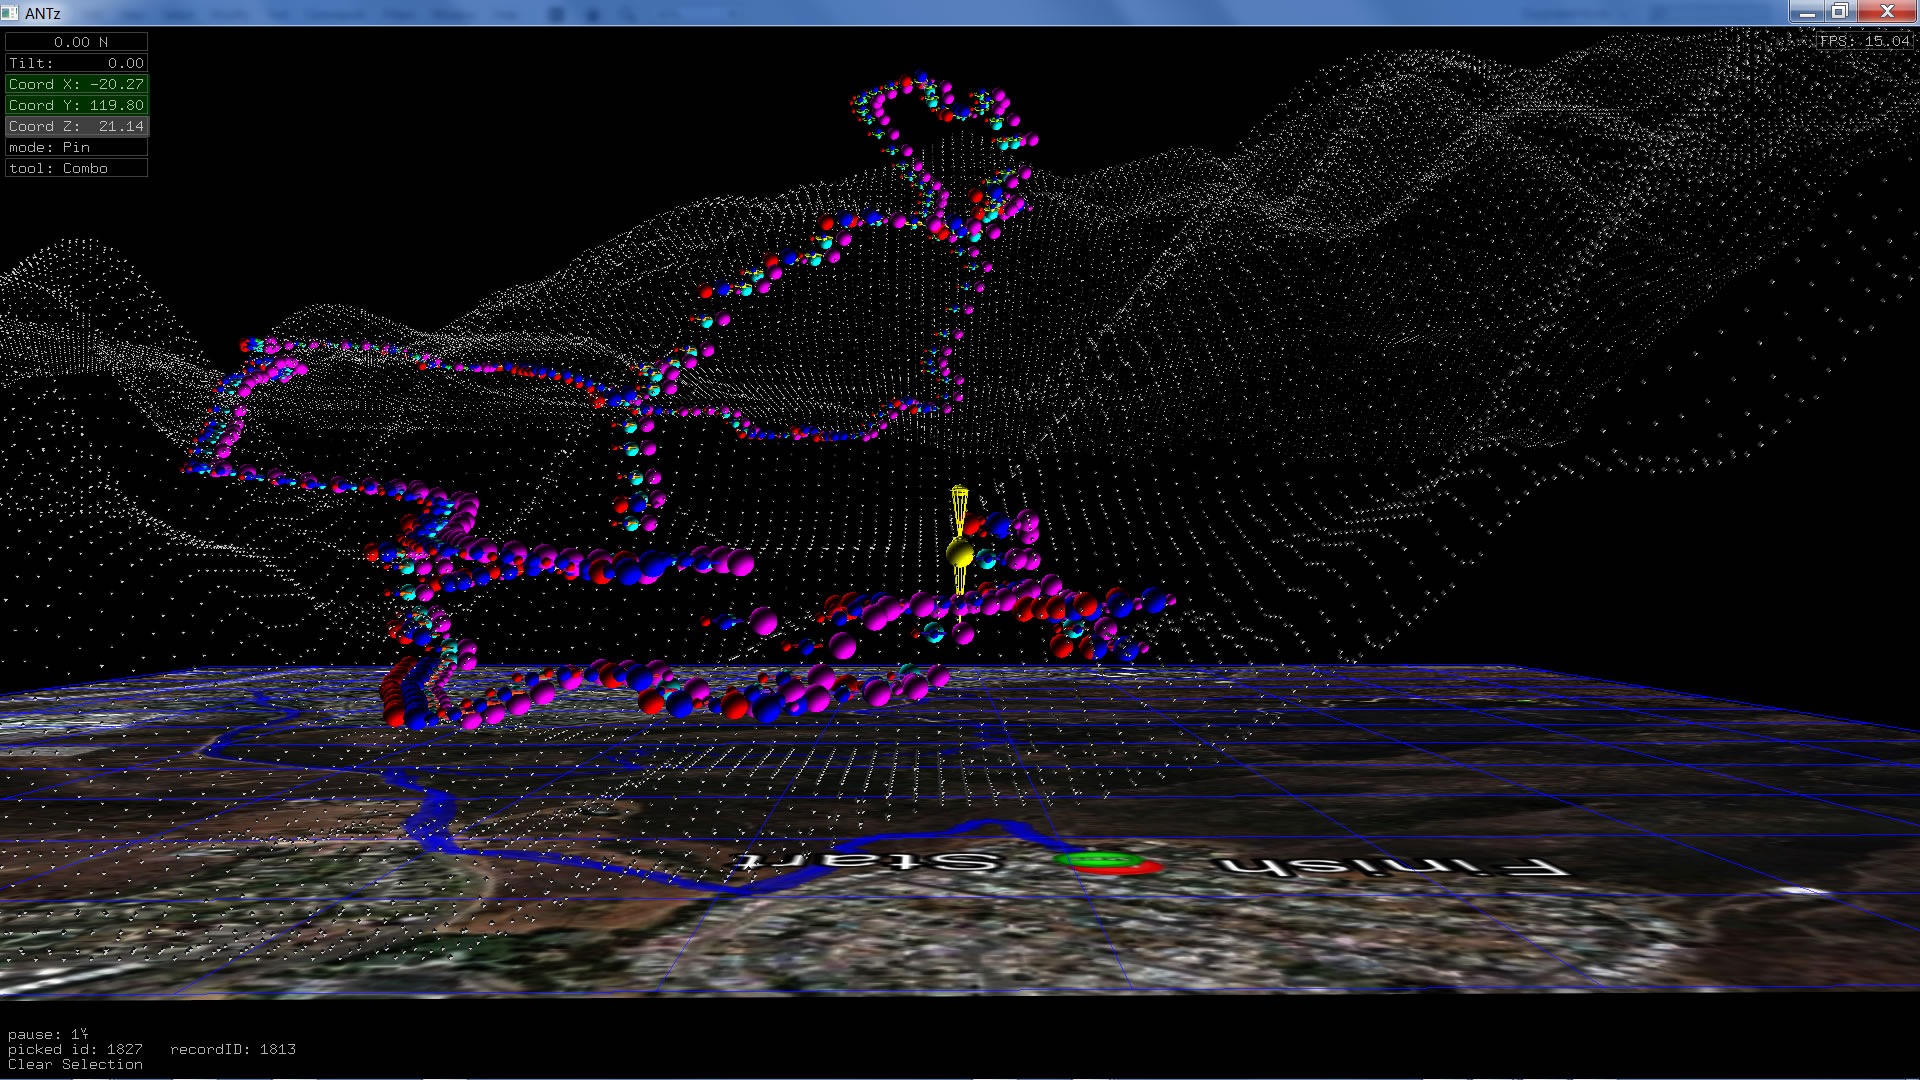
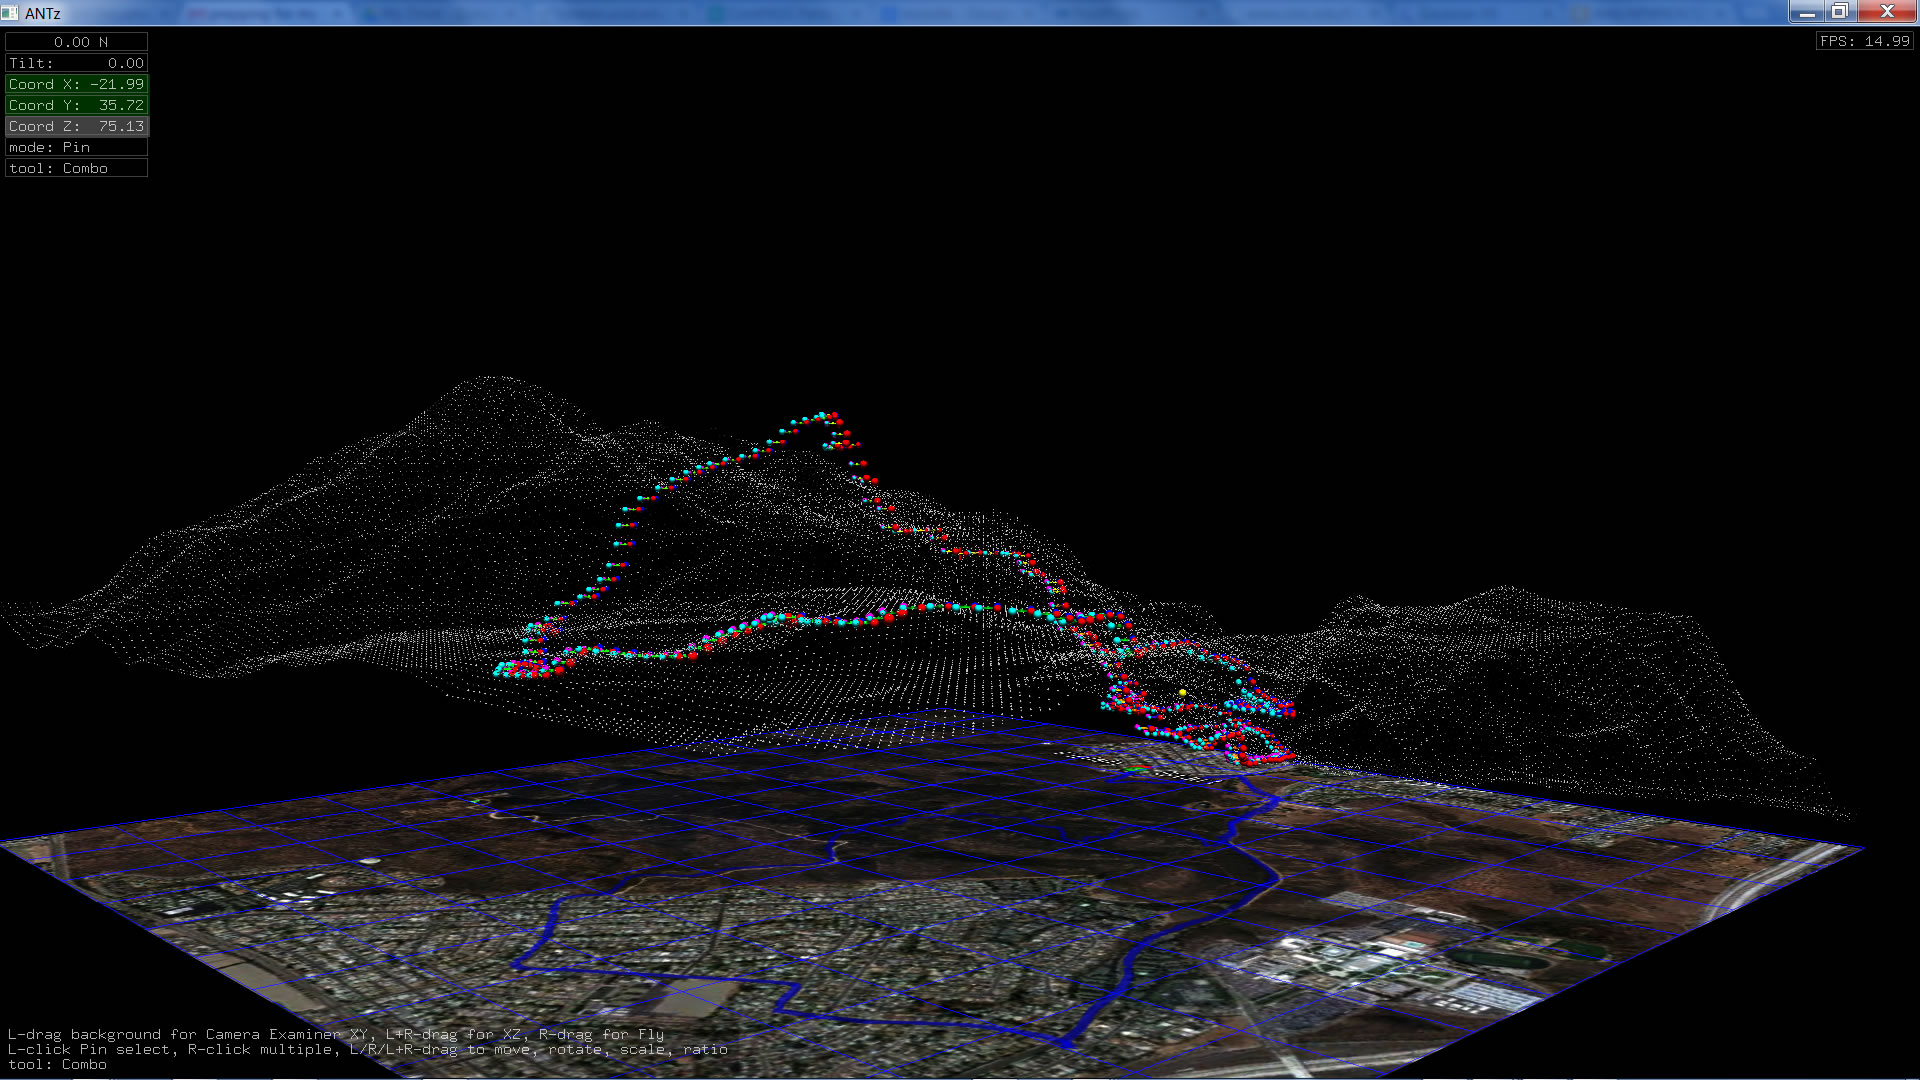
This is a hypothetical example of using ANTz channels to animate objects wherein object pulse rate correlates with physiological parameters including heart rate, respiration, etc.. Once the file is loaded, hit the P key to animate objects. The pulse rate correlates with heart rate, respiration rate, and other physiological parameters collected while riding uphill and downhill on Cowles Mountain in Mission Trails Regional Park, San Diego, California.
Animated Version
Download self-contained zip with data, ant.exe, map image, csv files, and .bat file.
Instructions to run the app:
Extract the contents of the zip file. Double-click the cowlesphysio_simple_vibe.bat file to launch the app and load the data. Hit Tab to properly orient the camera view. Hit P to play the animation.
Standard (Non-animated) Version
Download self-contained zip with data, ant.exe, map image, csv files, and .bat file.
Instructions to run the app:
Extract the contents of the zip file. Double-click the cowlesphysio.bat file to launch the app and load the data.