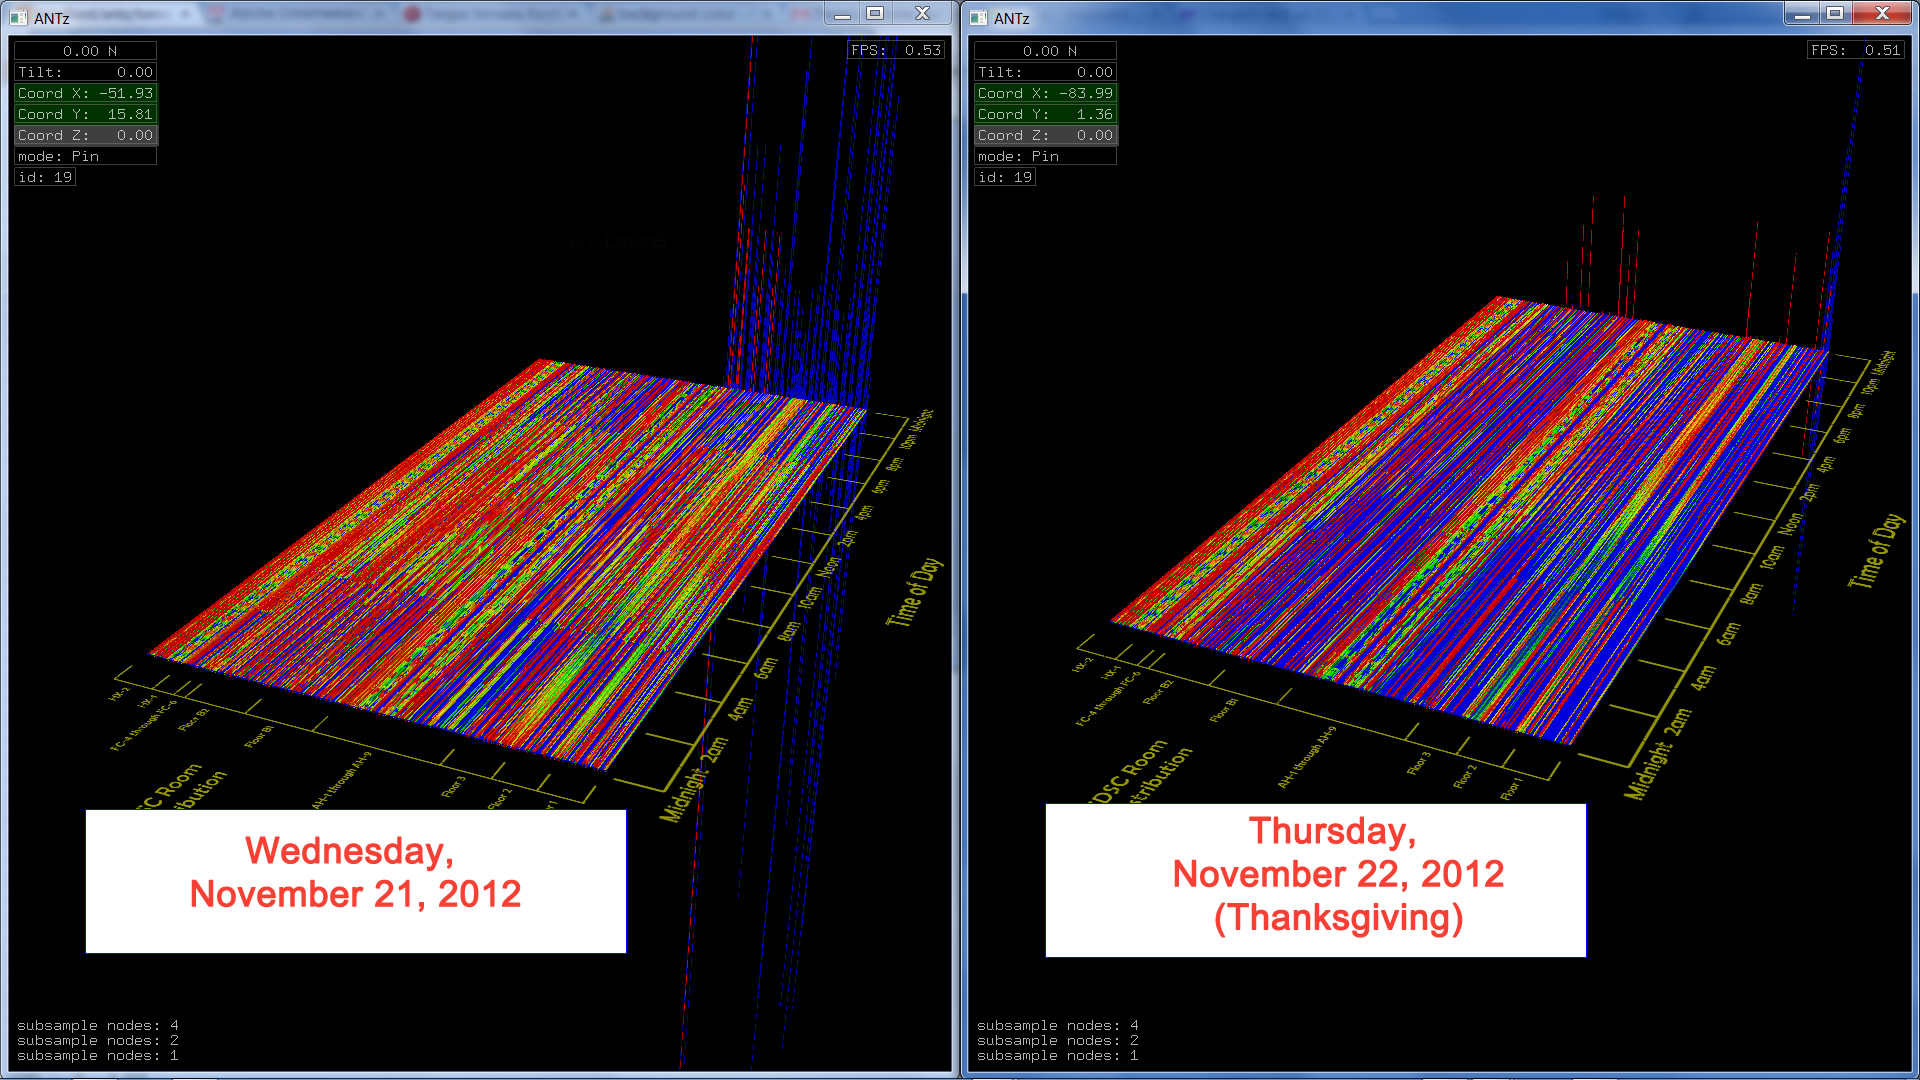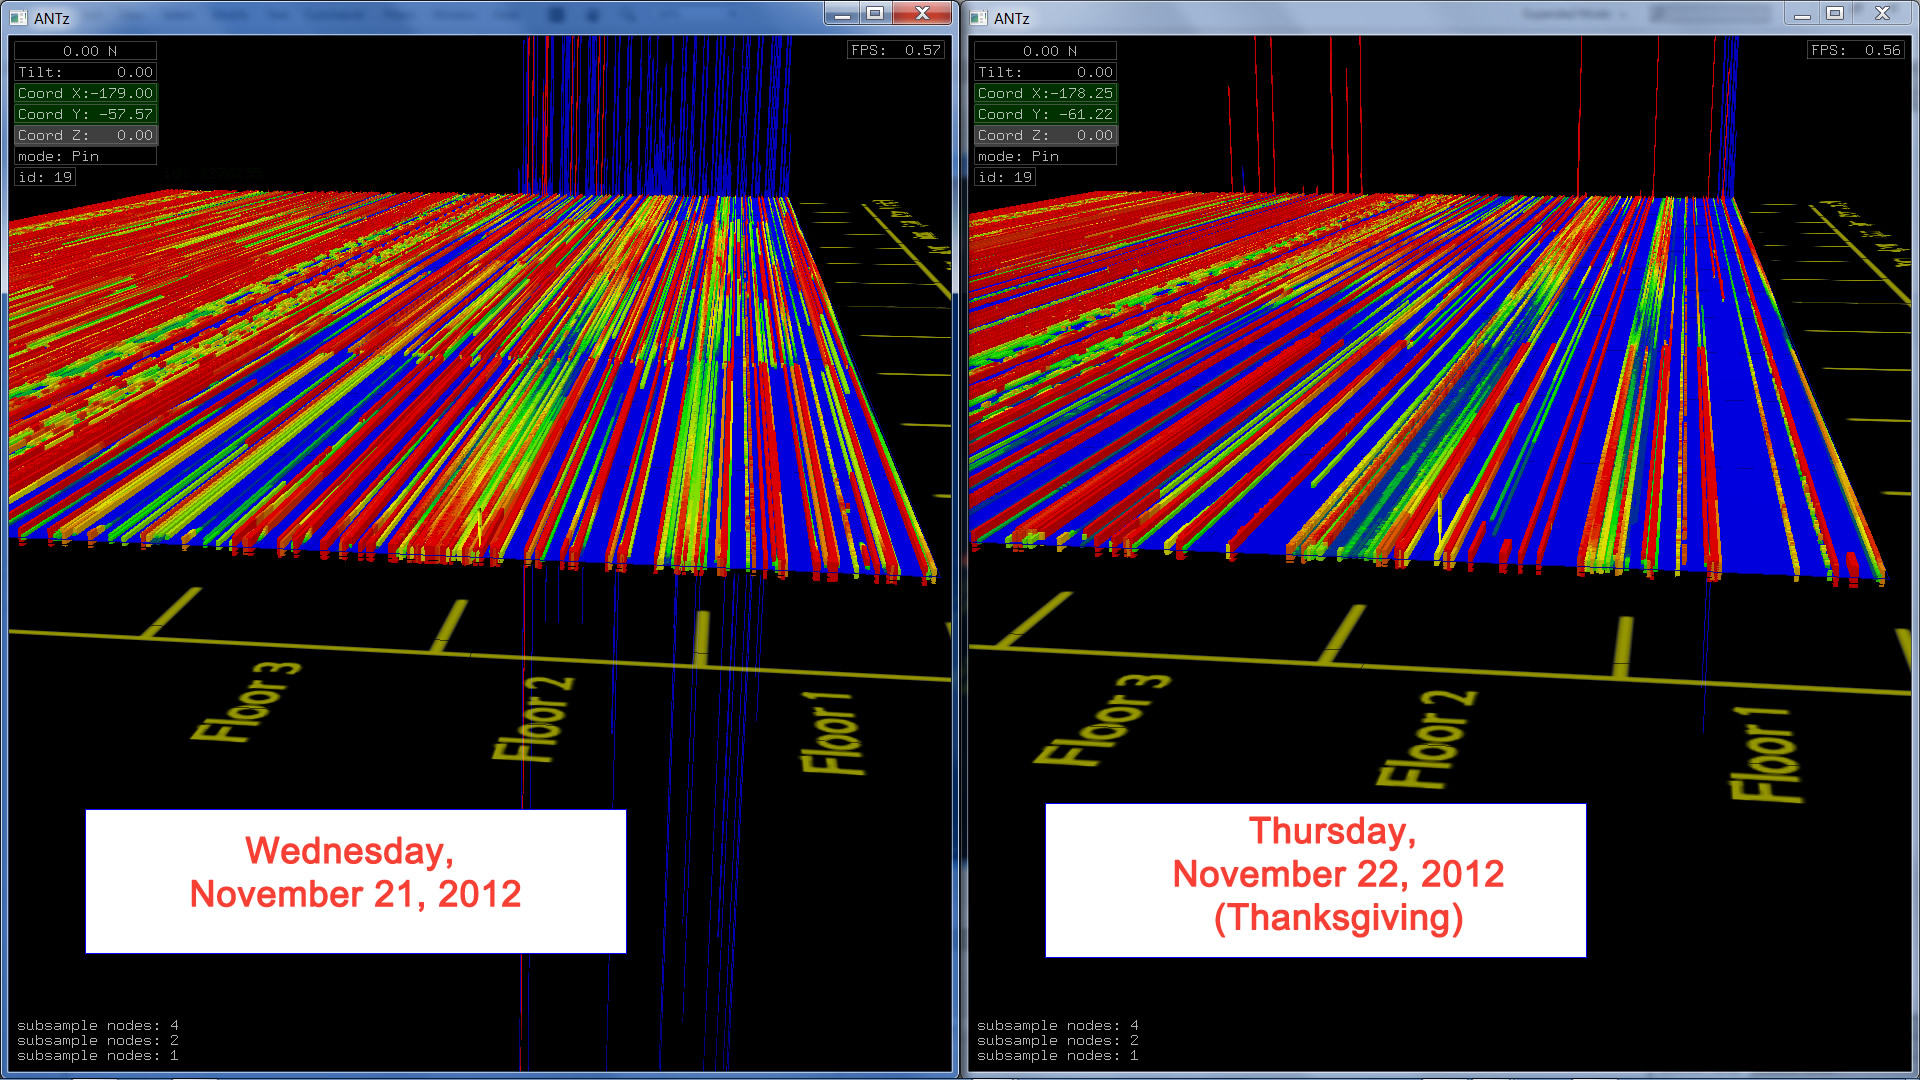
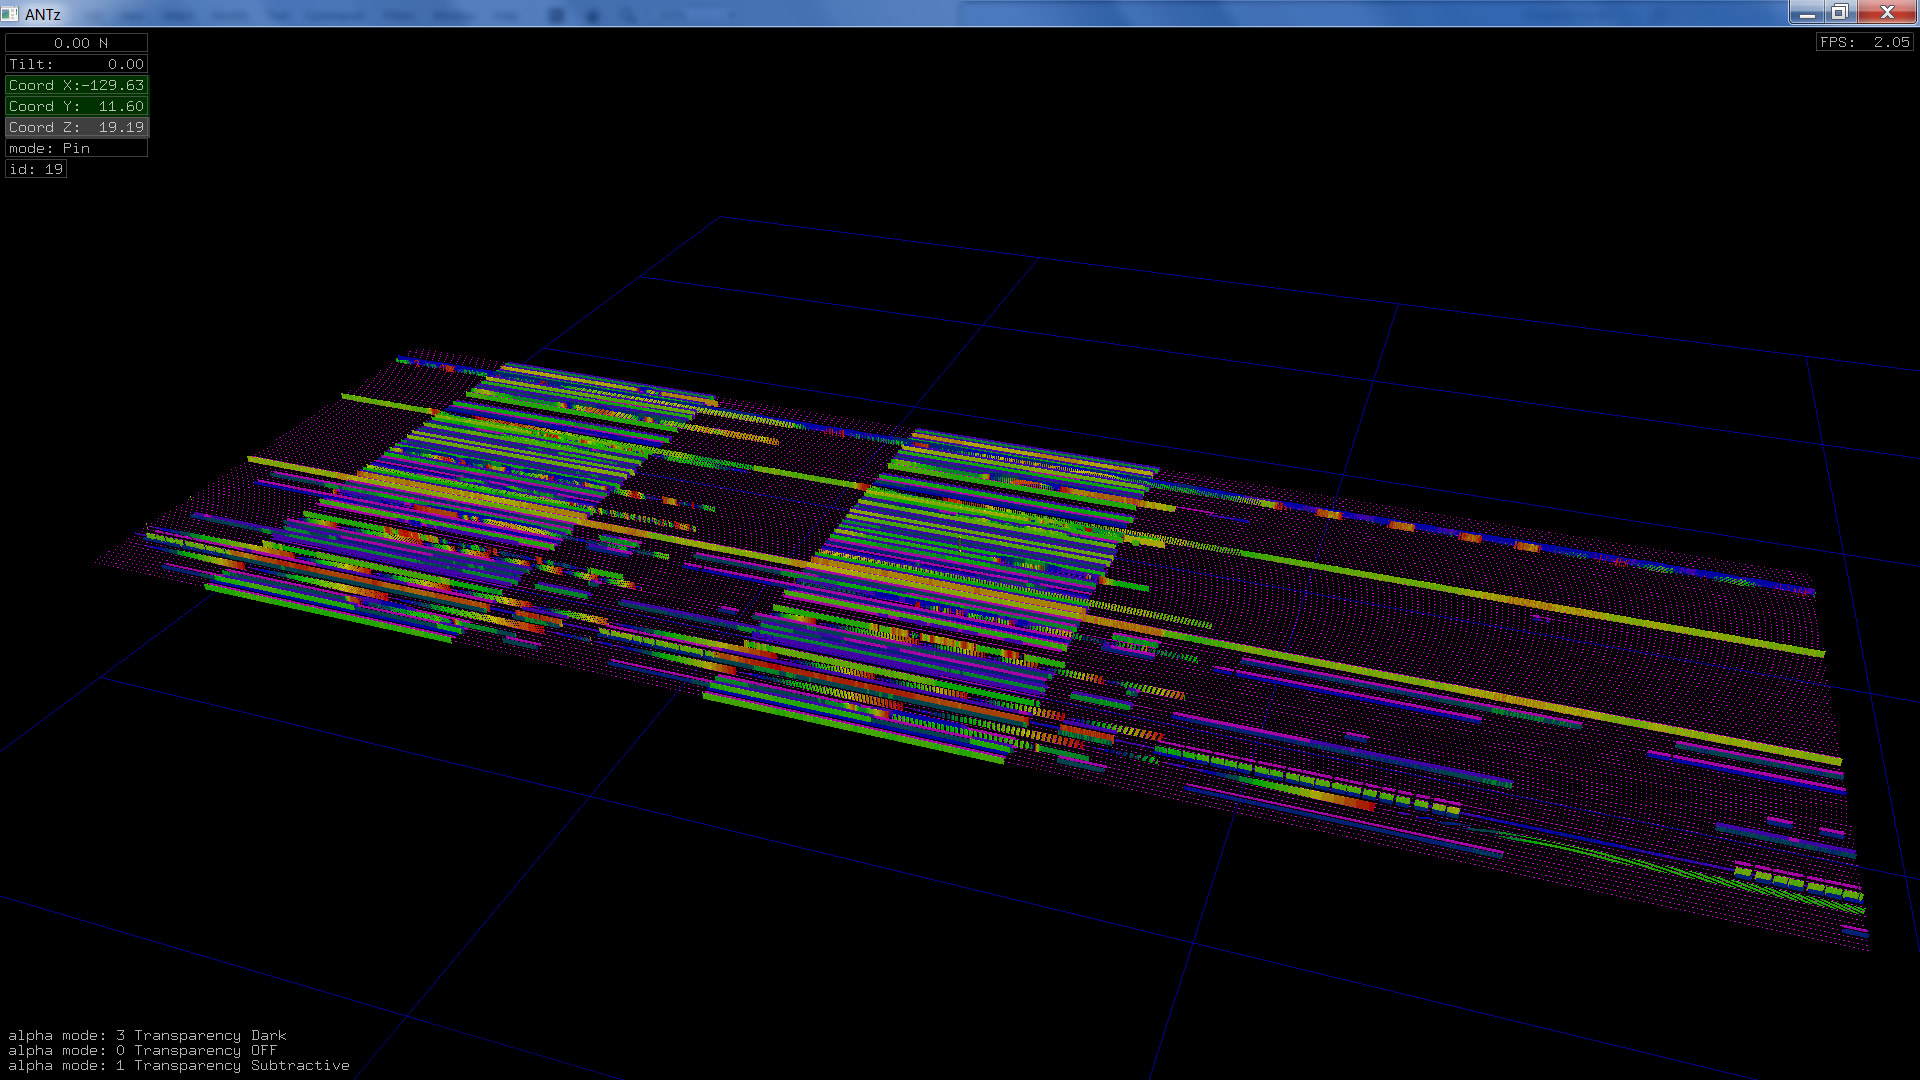
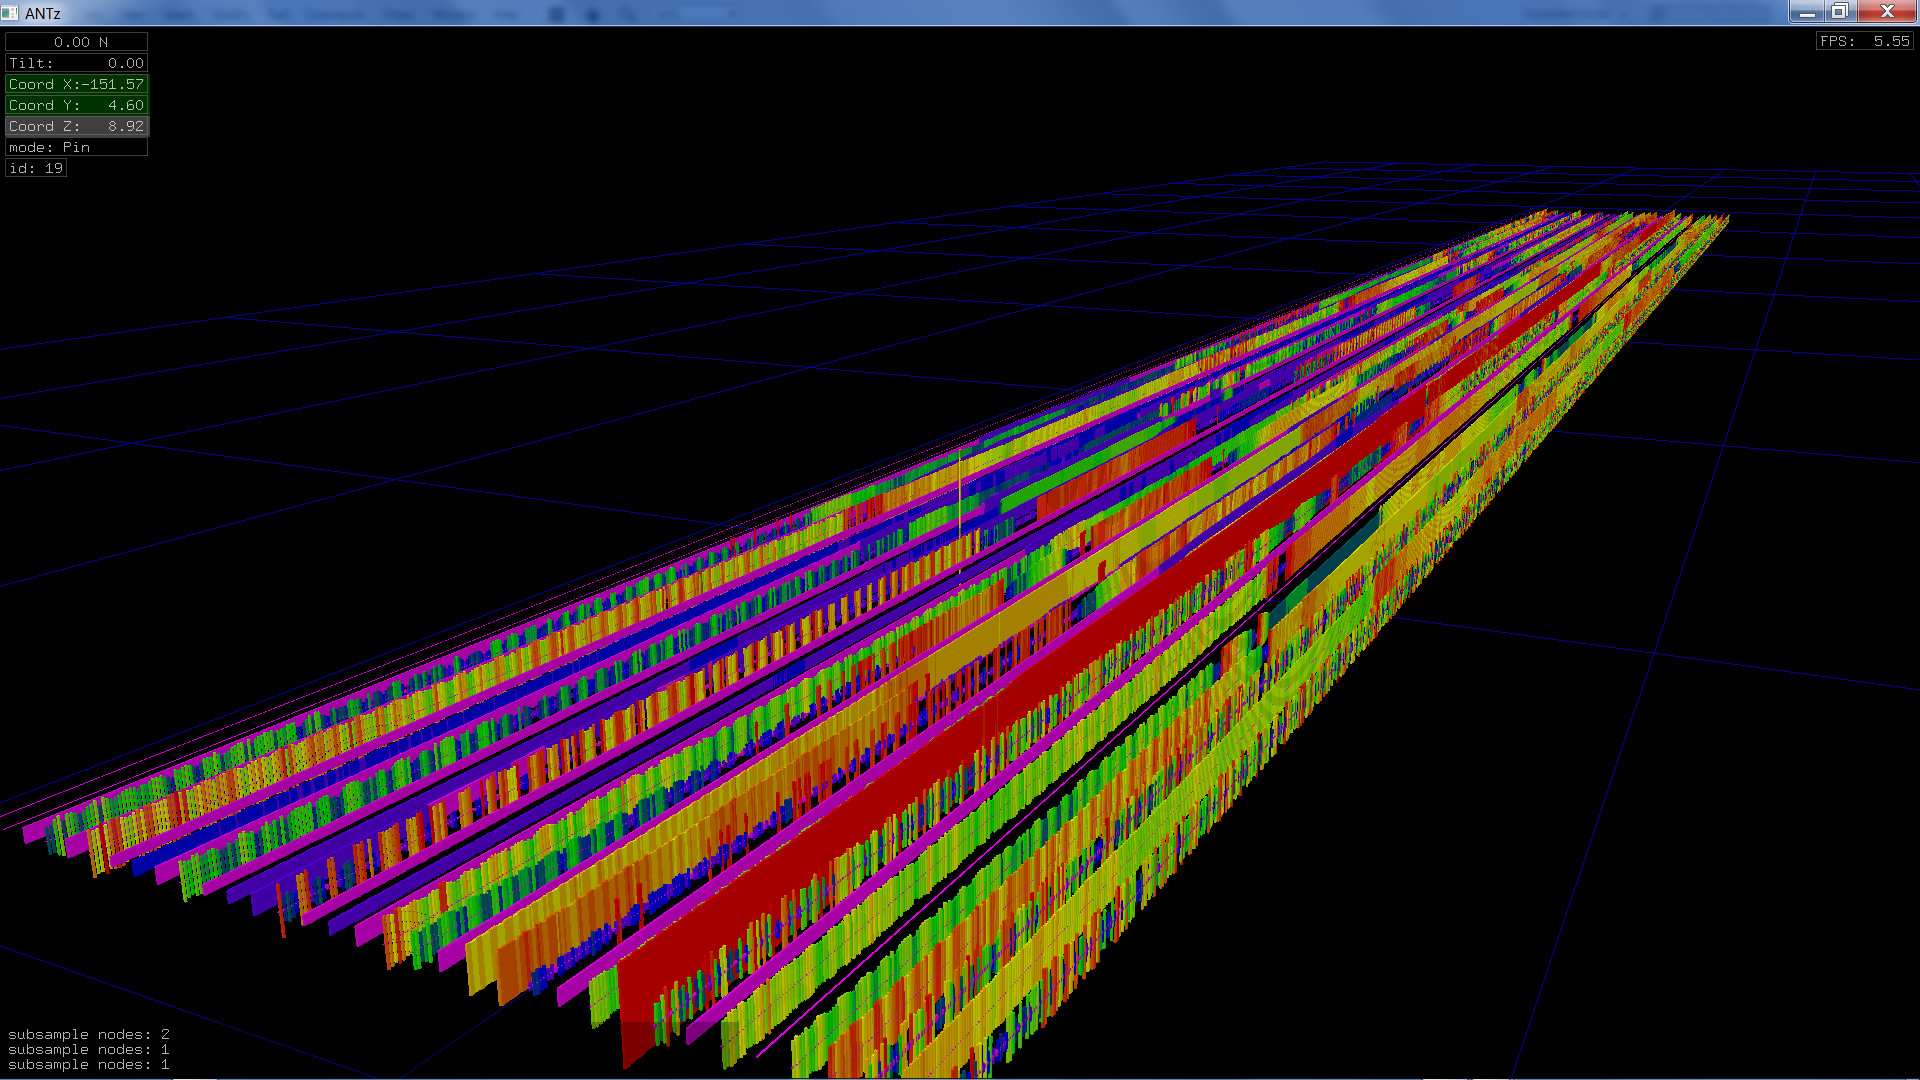
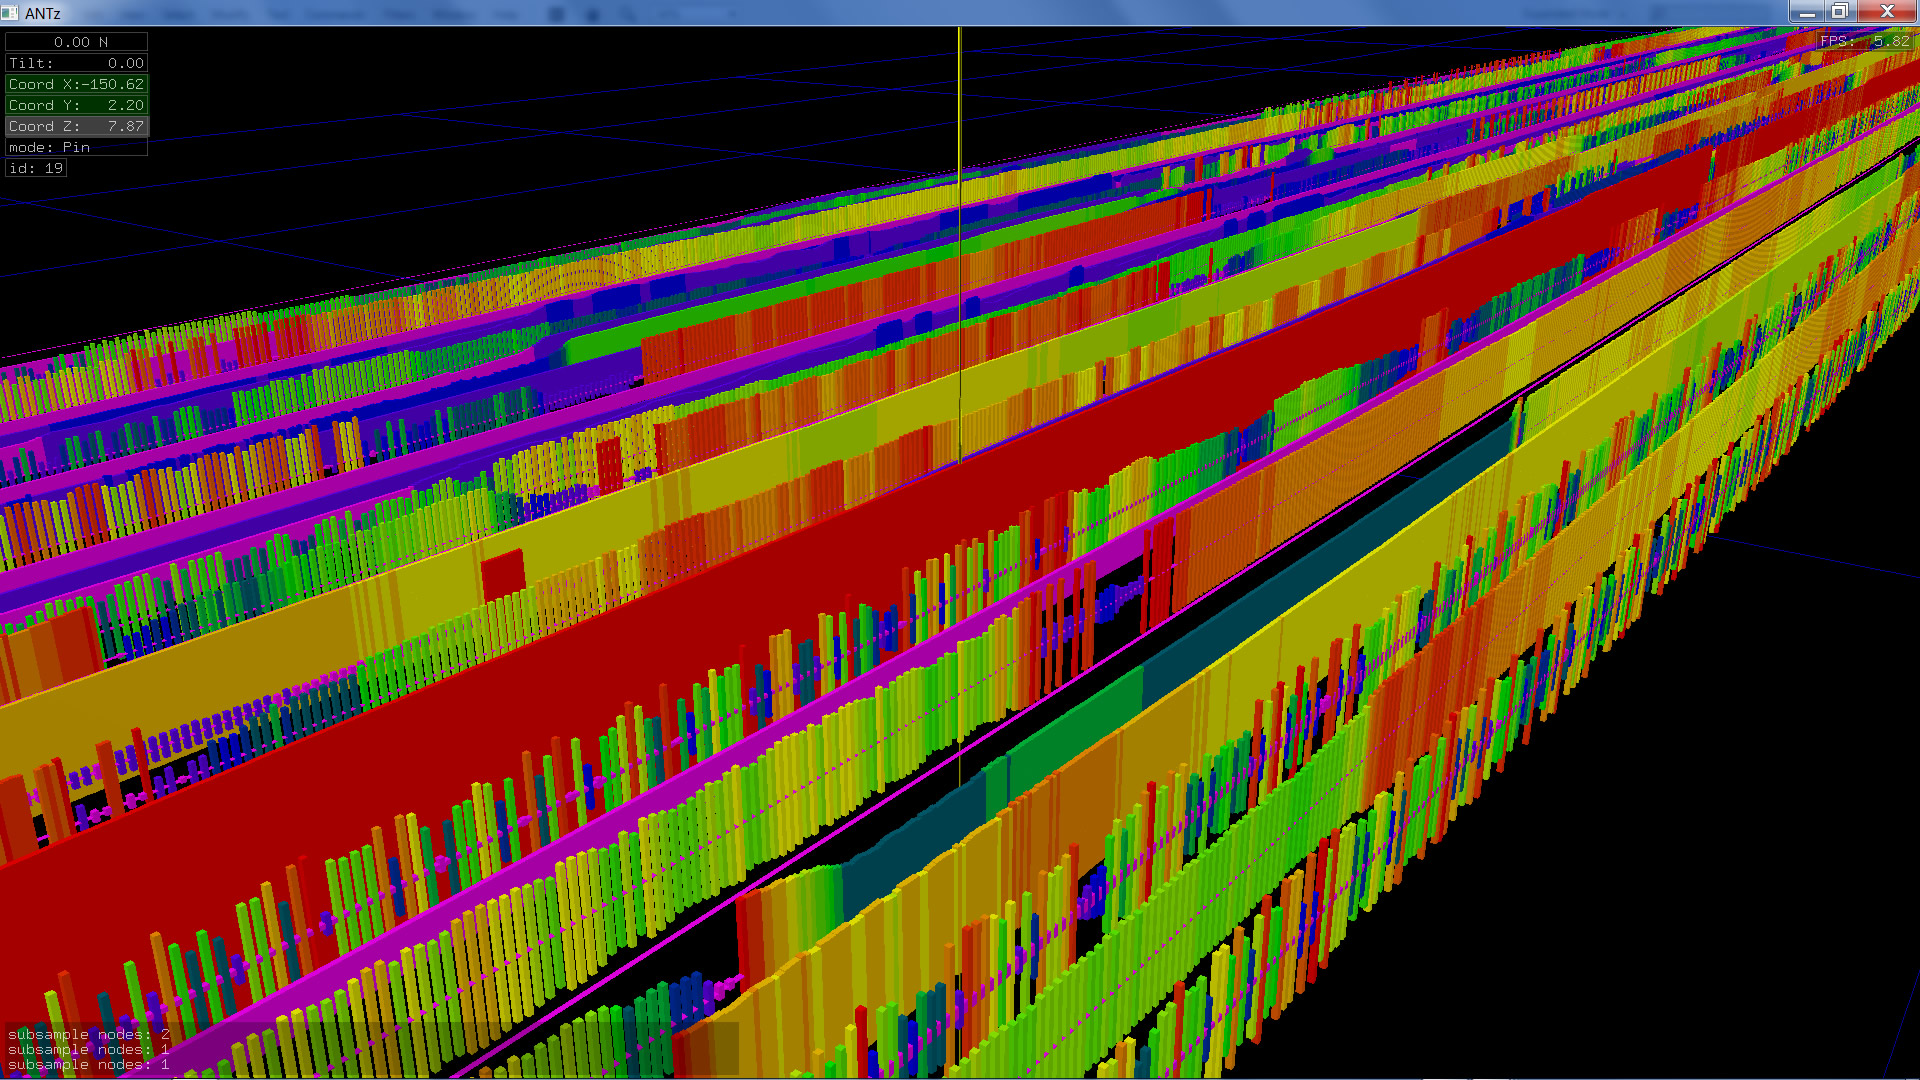
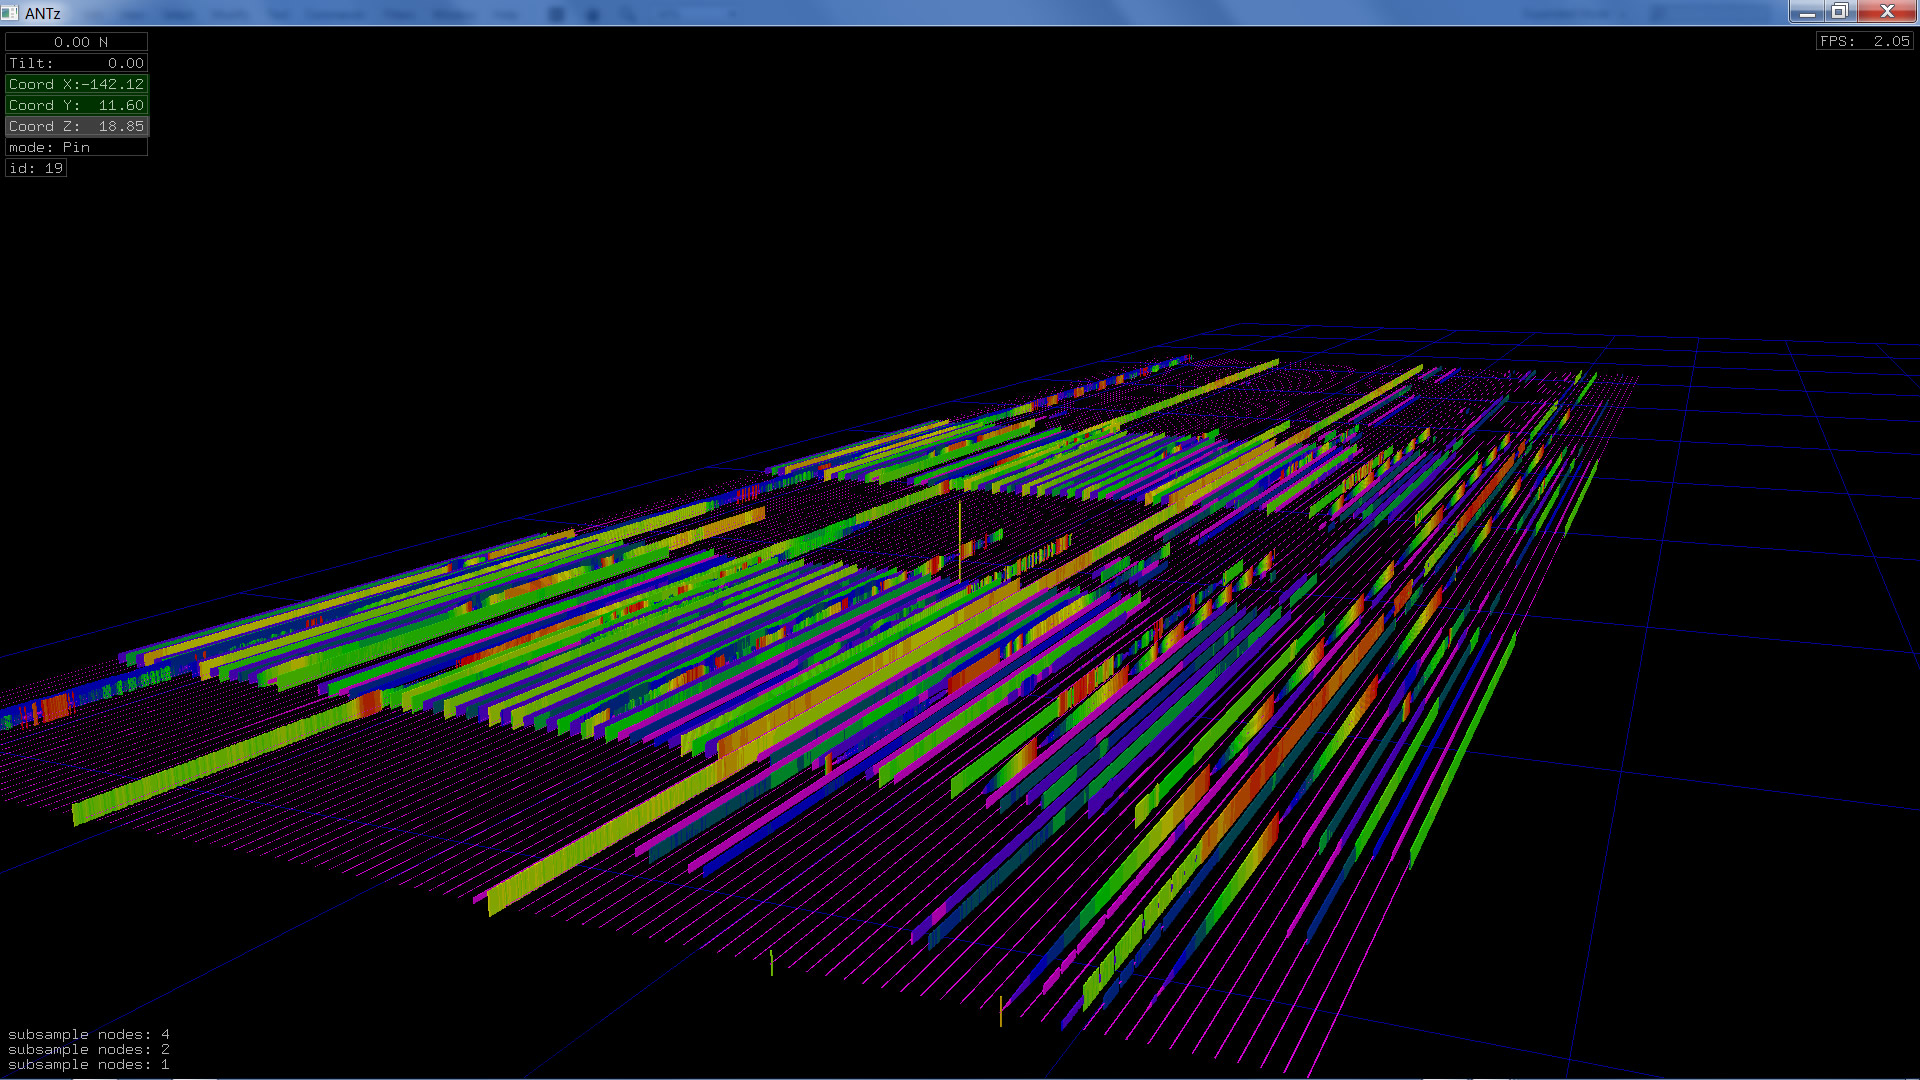
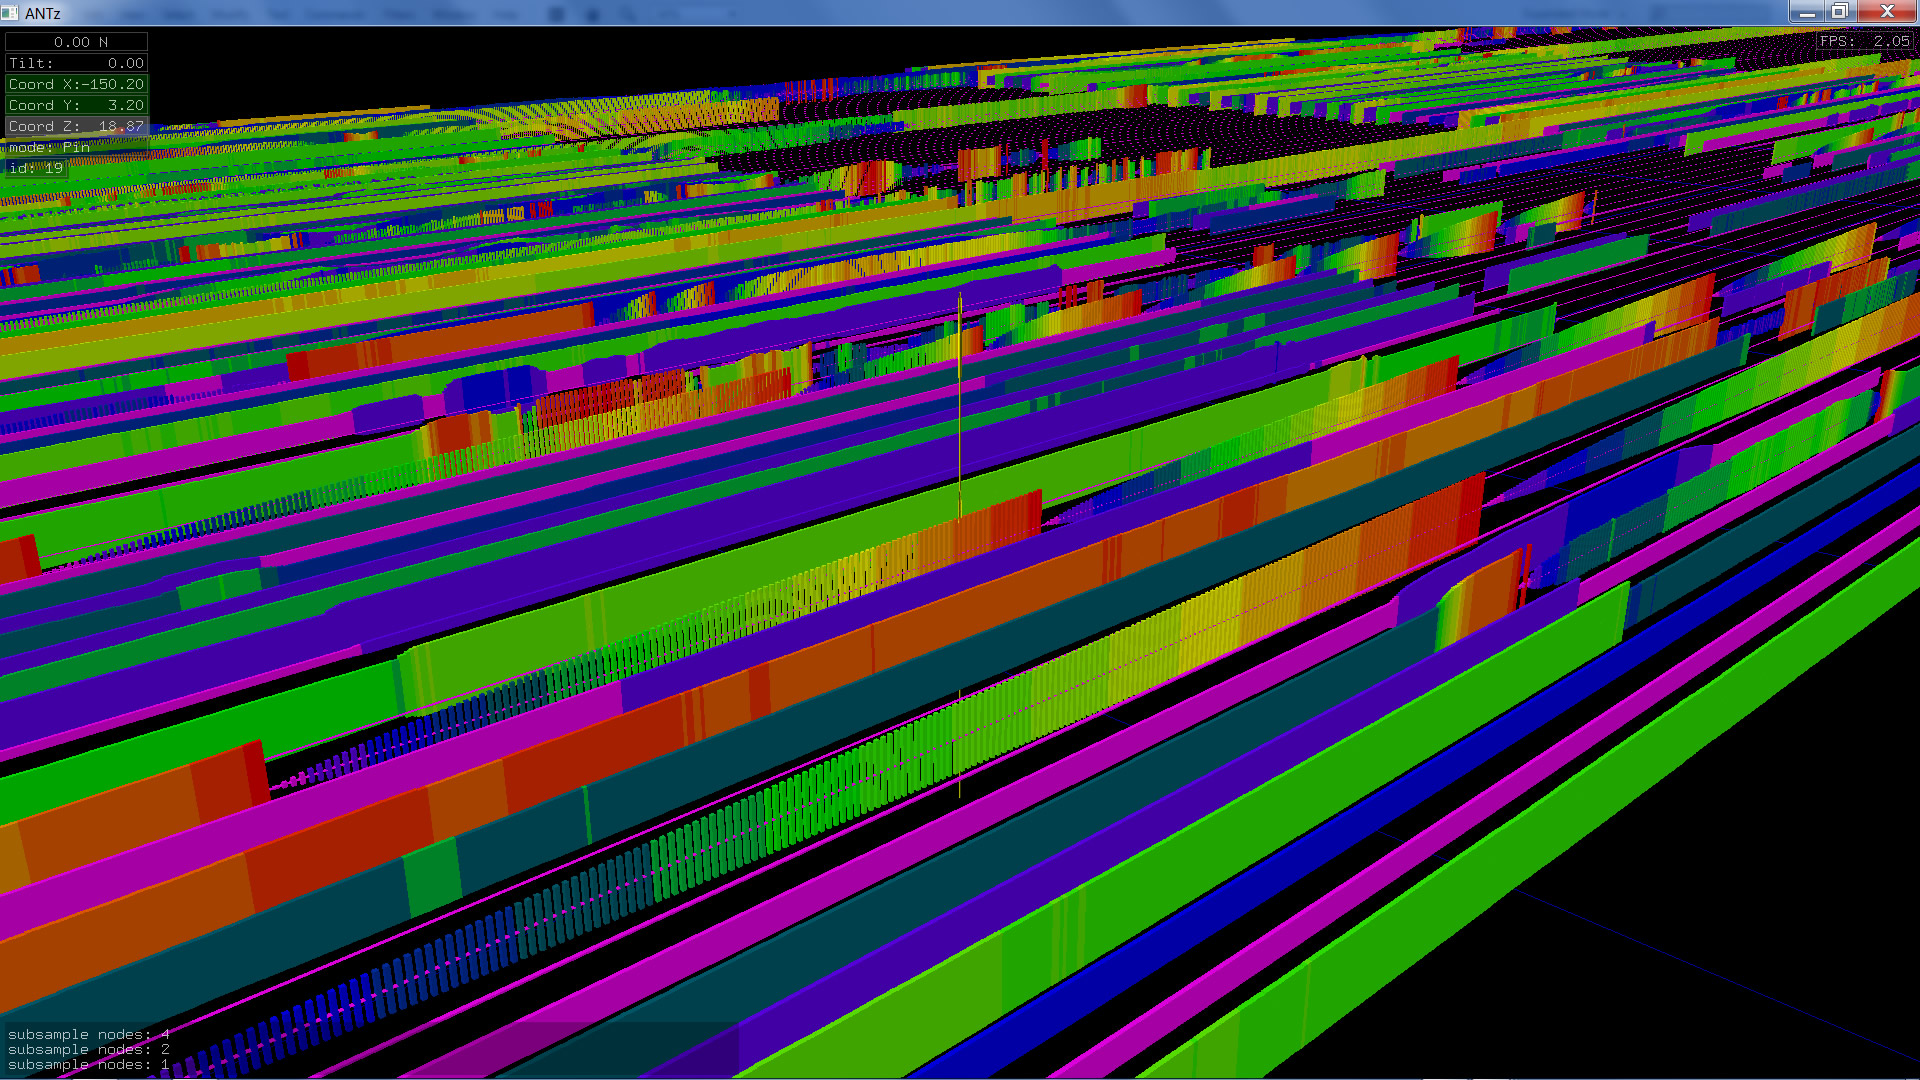
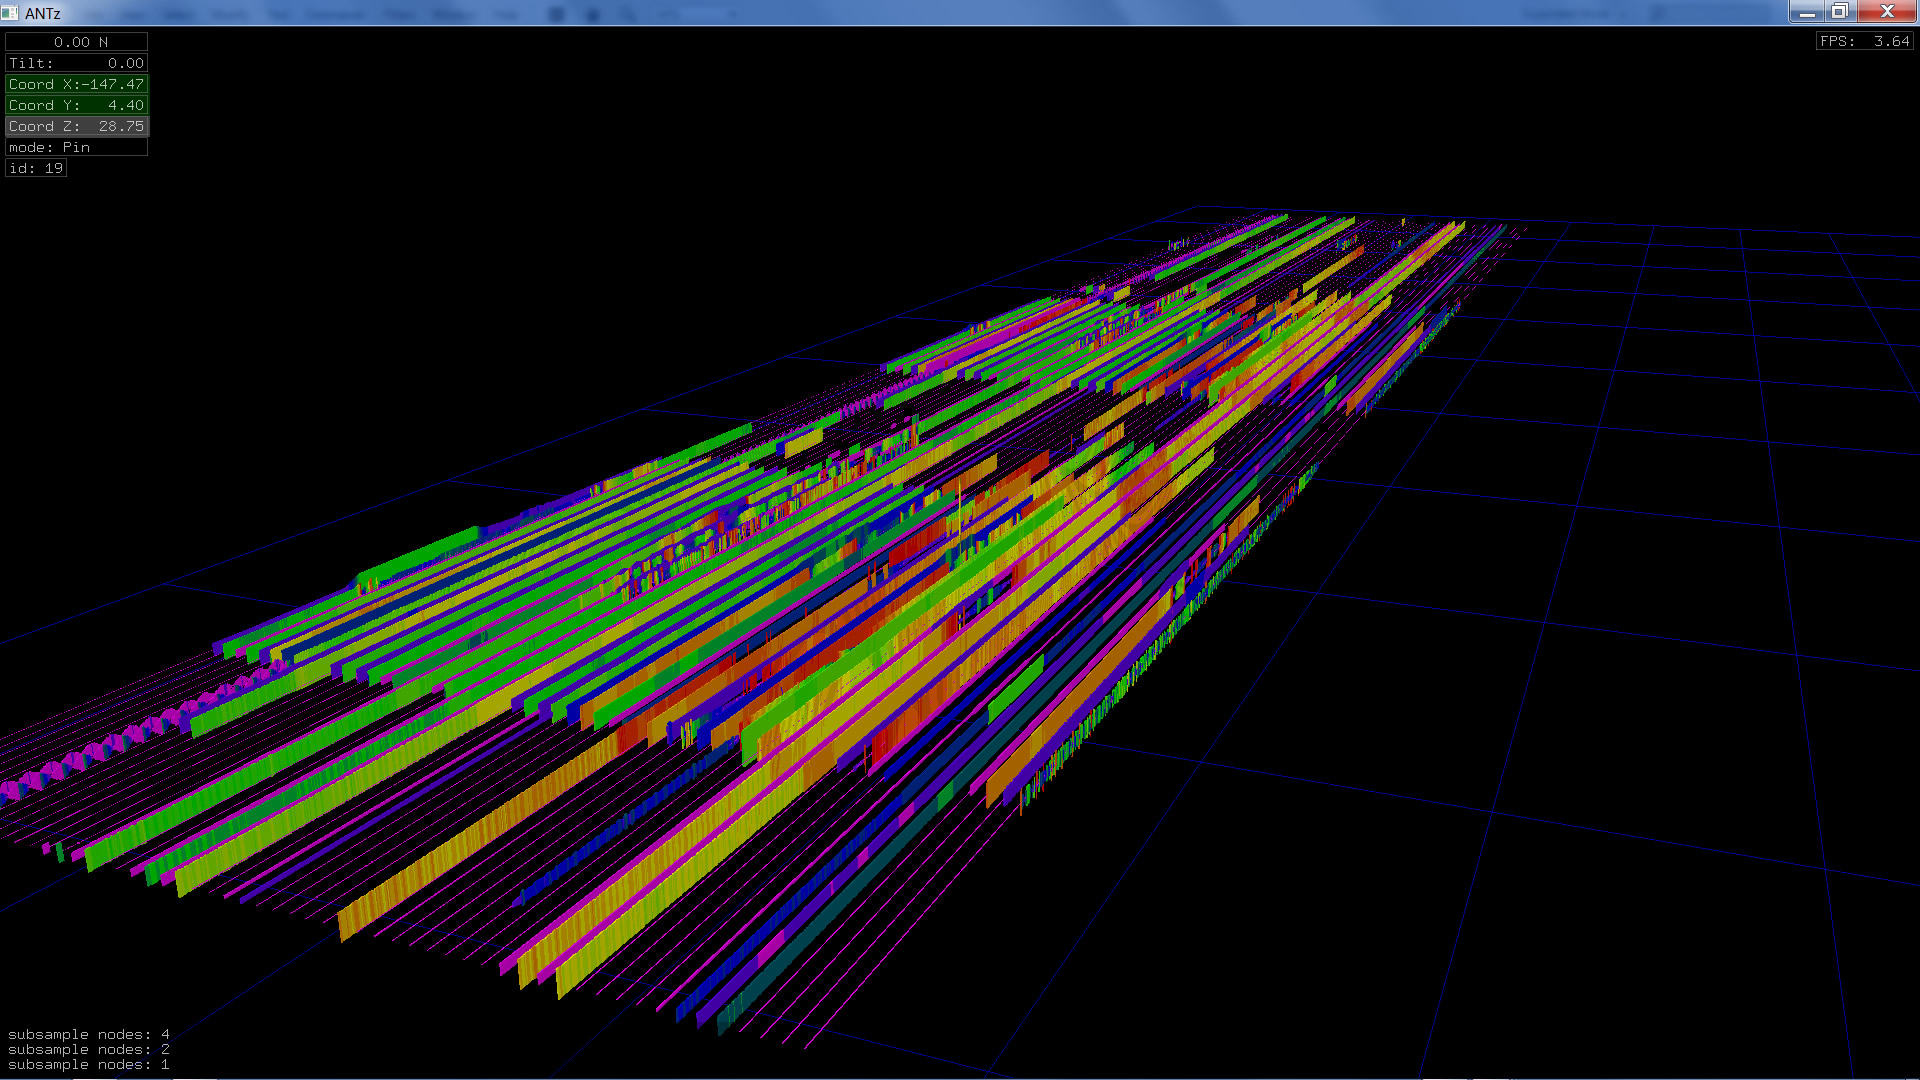
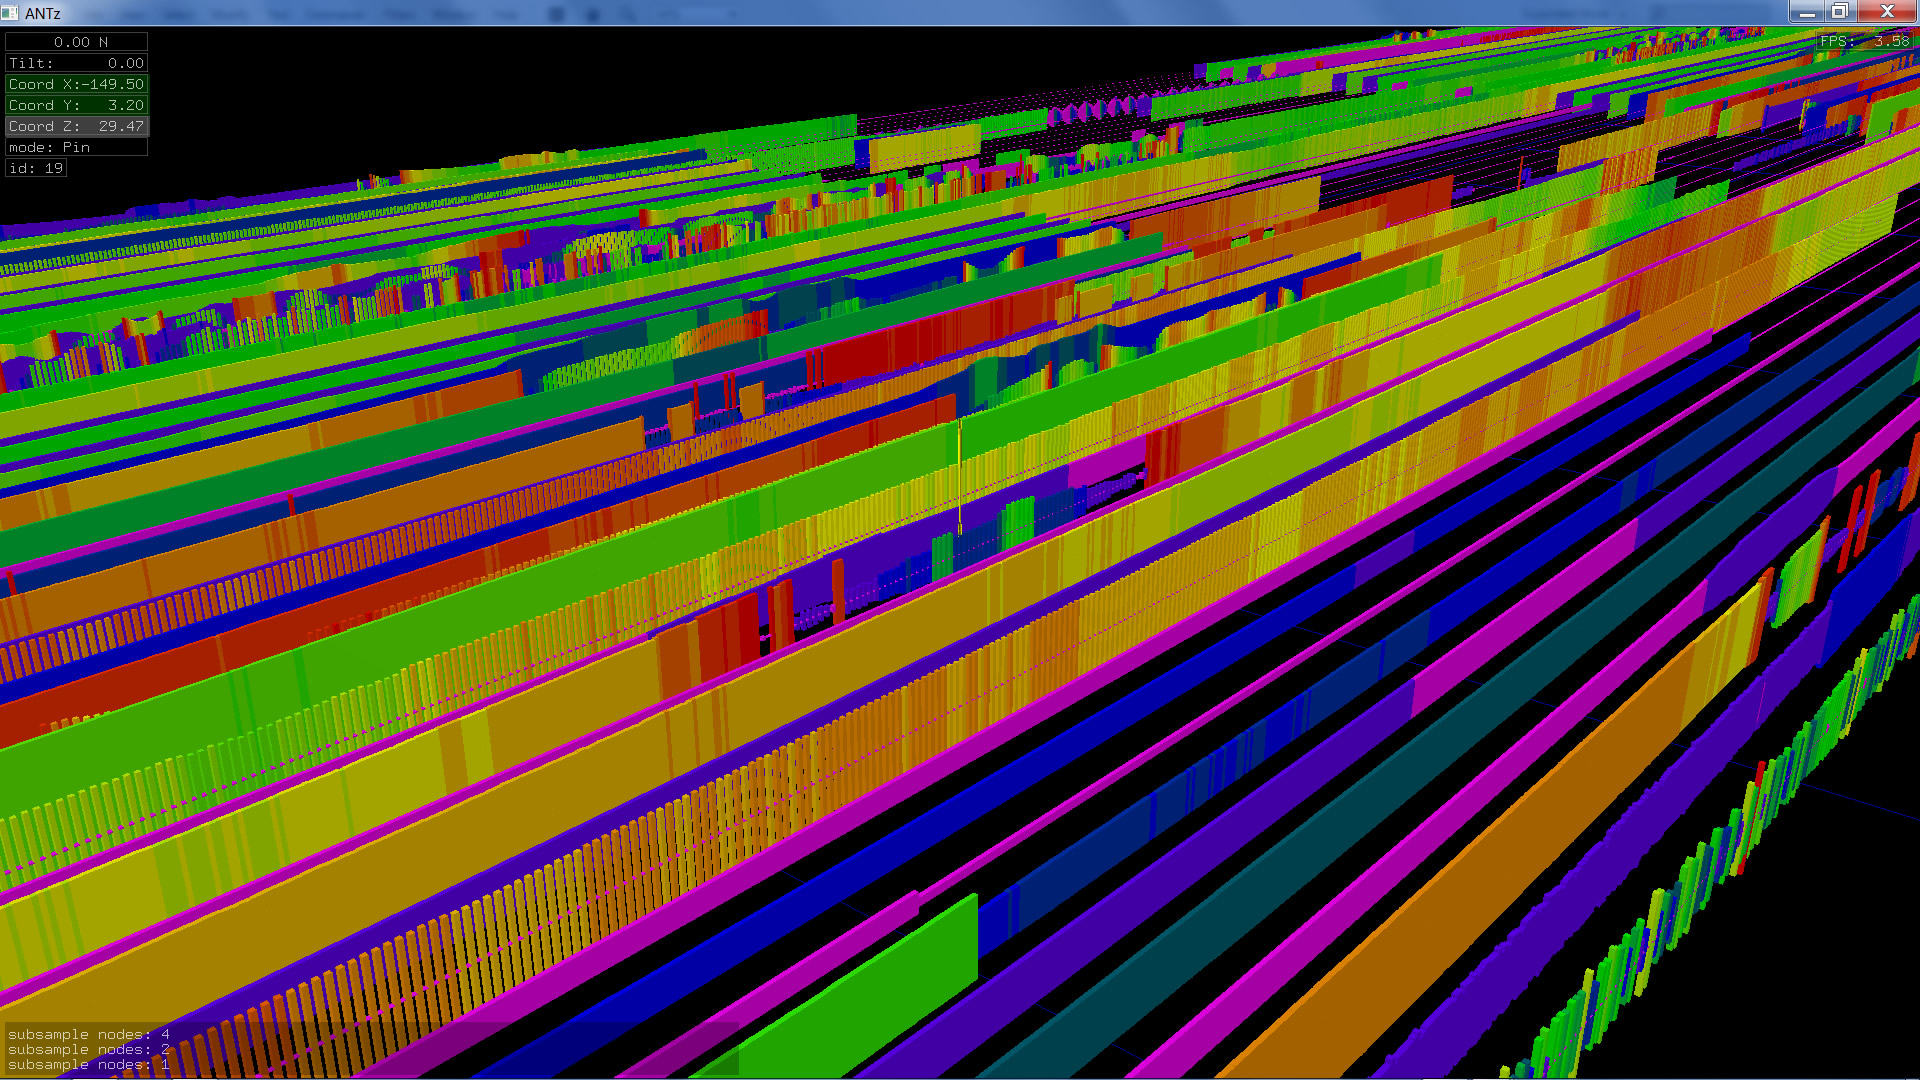
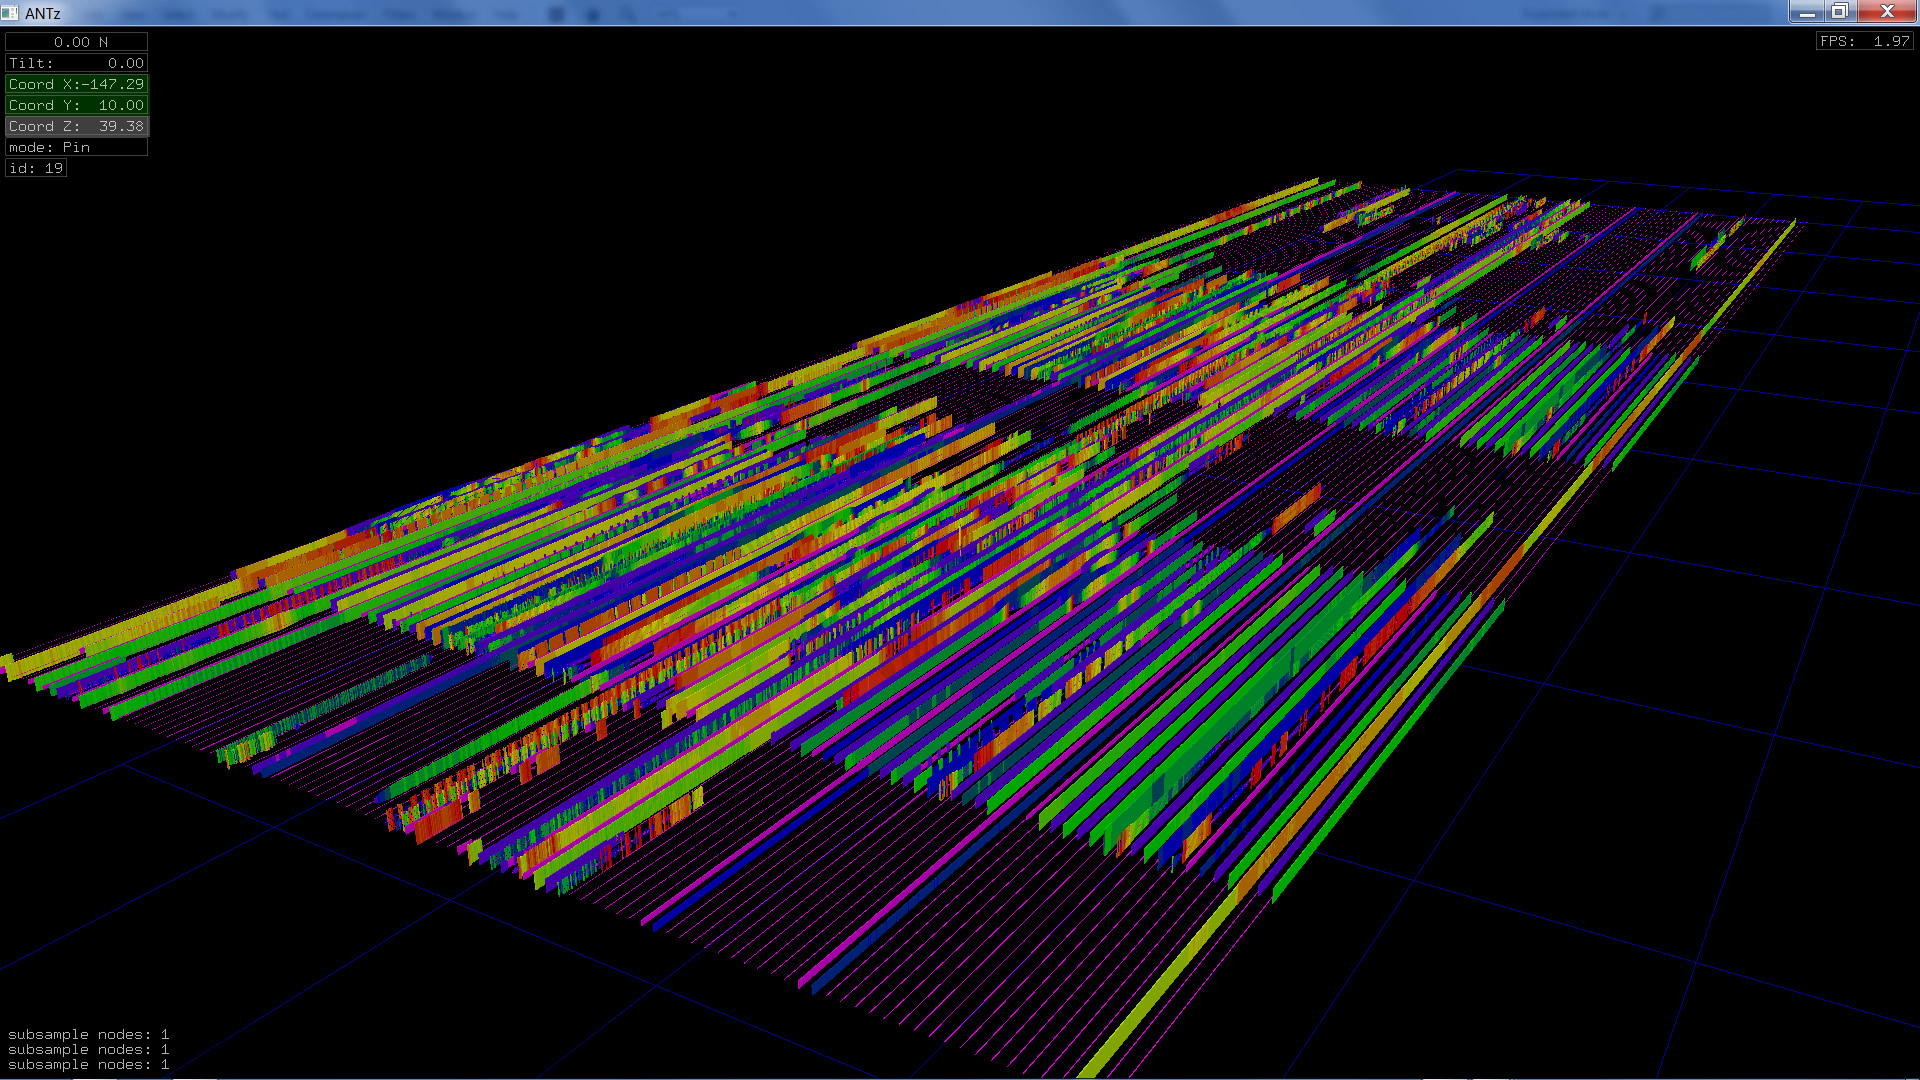
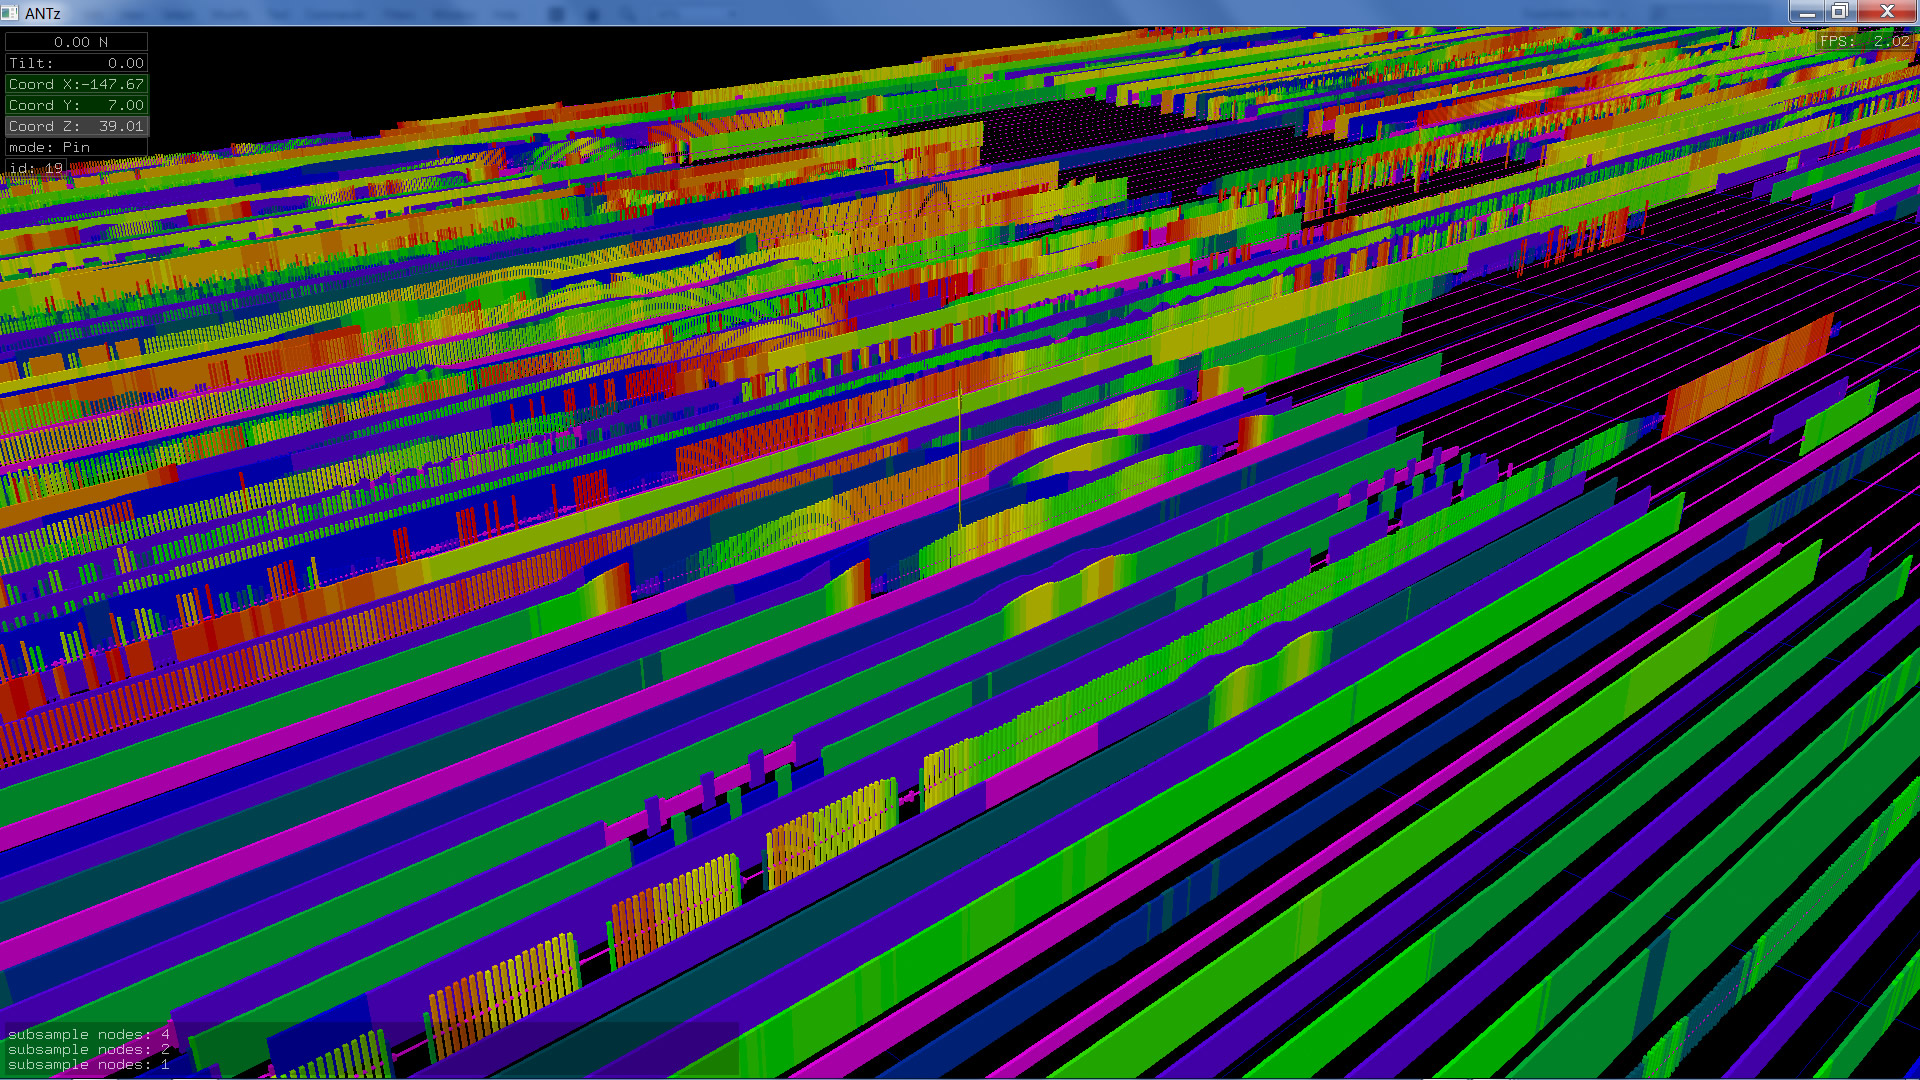
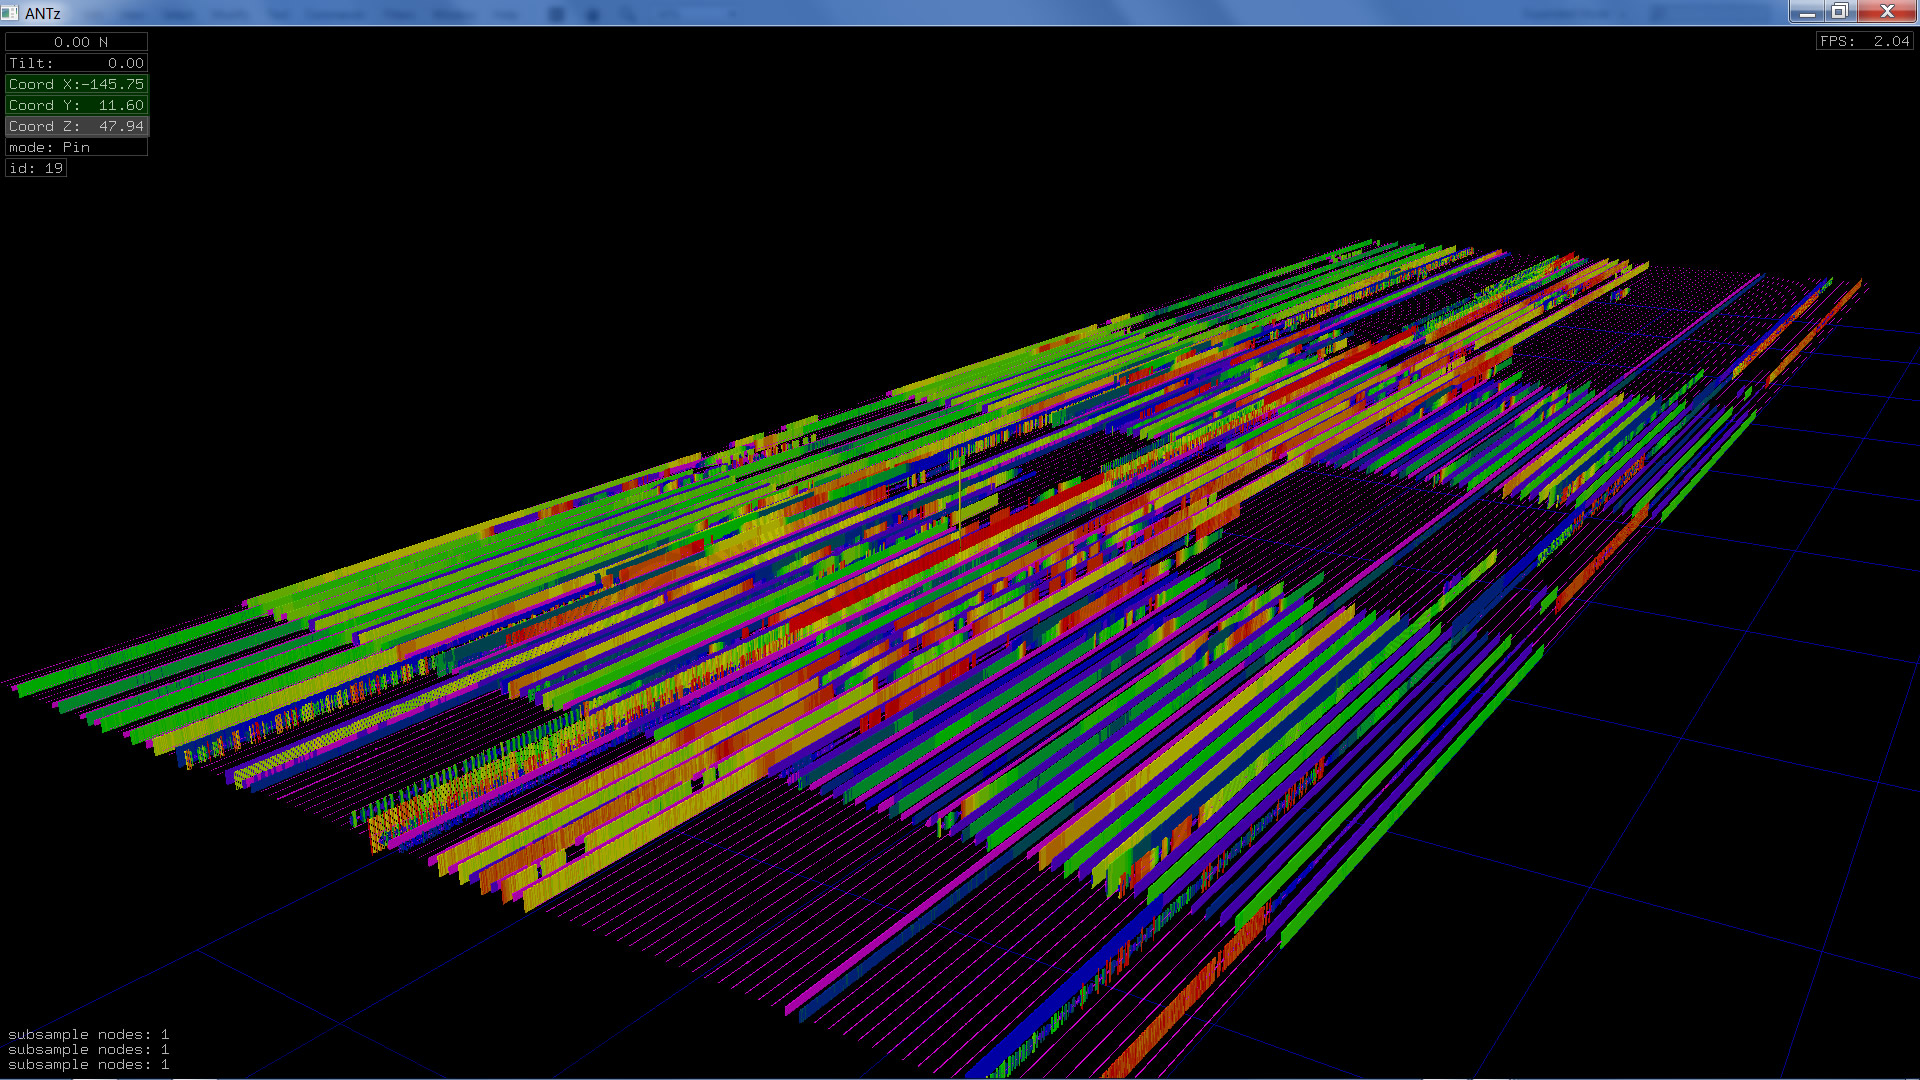
Visualization of UCSD SmartGrid Energy Use
November 20-22, 2012
UCSD Jacobs School of Engineering, Building #3
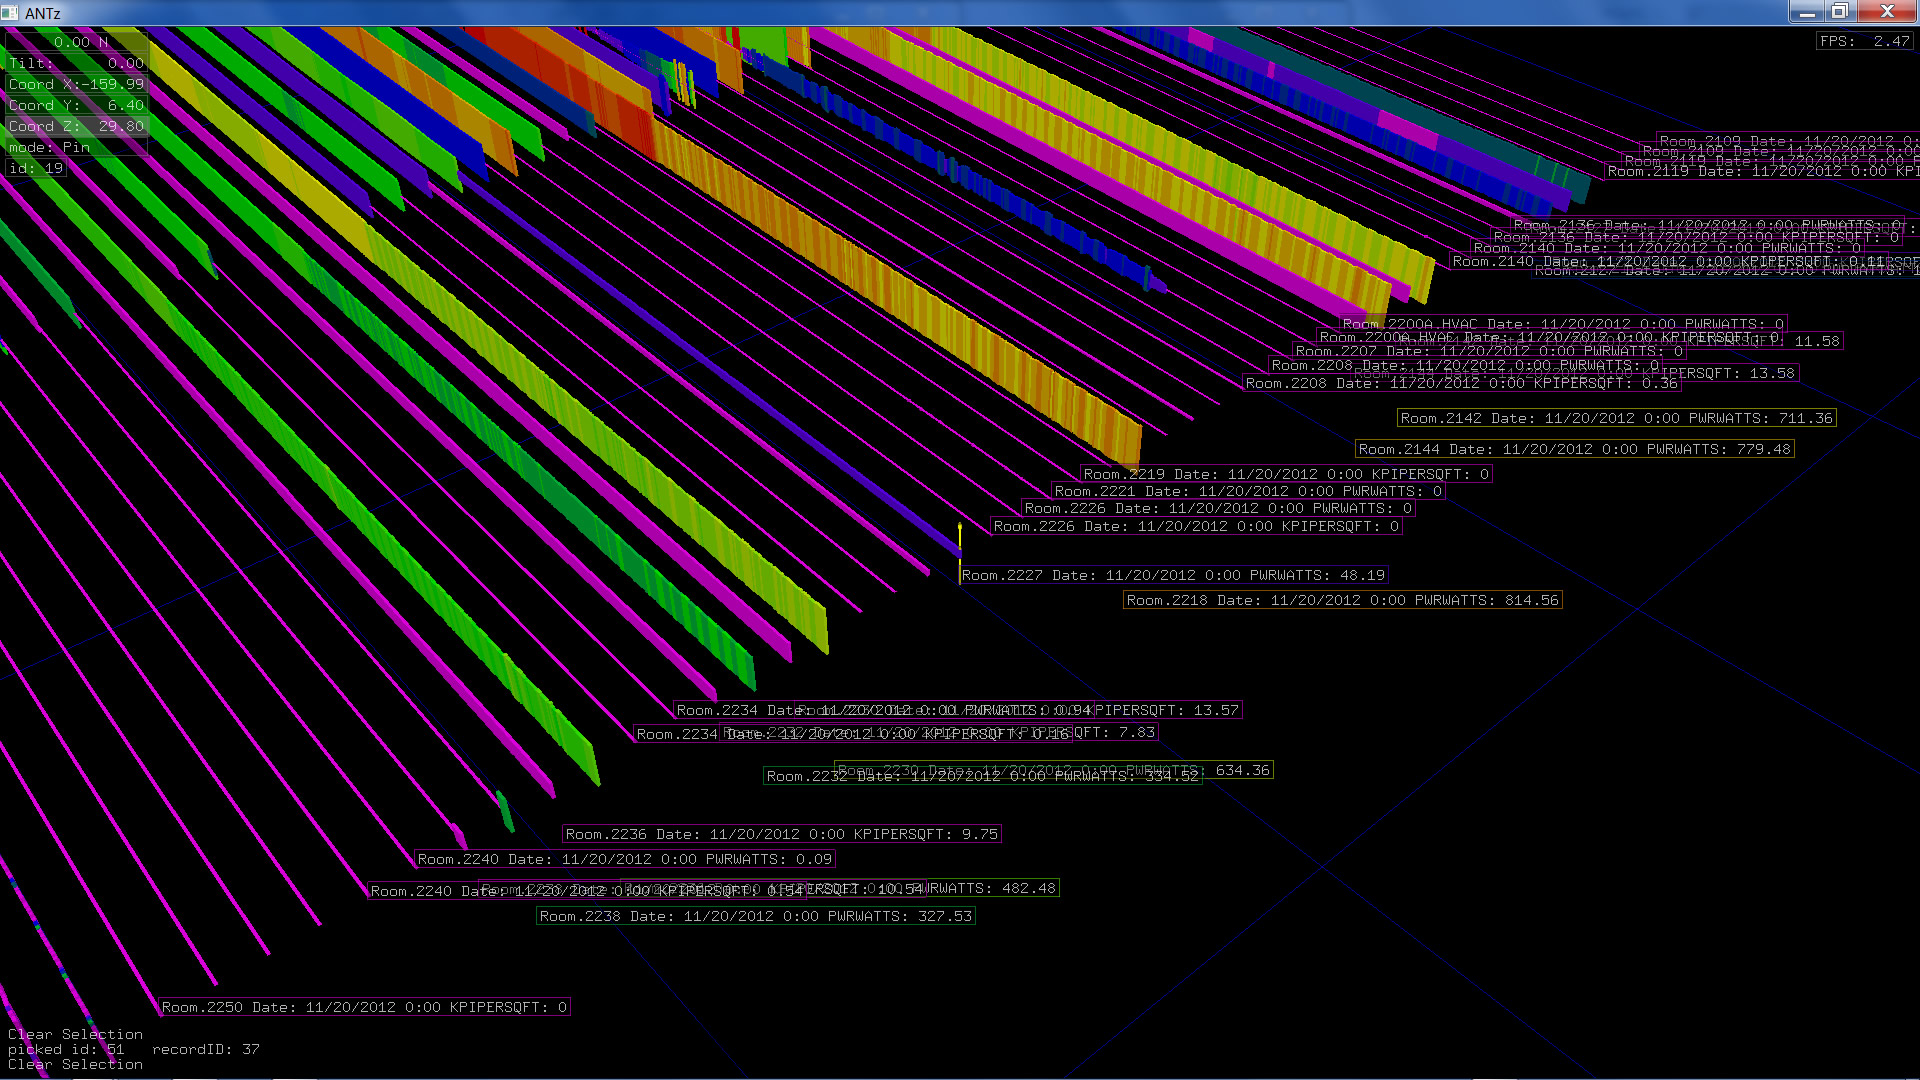
Data is collected every 1 minute. Data includes KPI per sq. ft. and HVAC power use.

Building Diagram
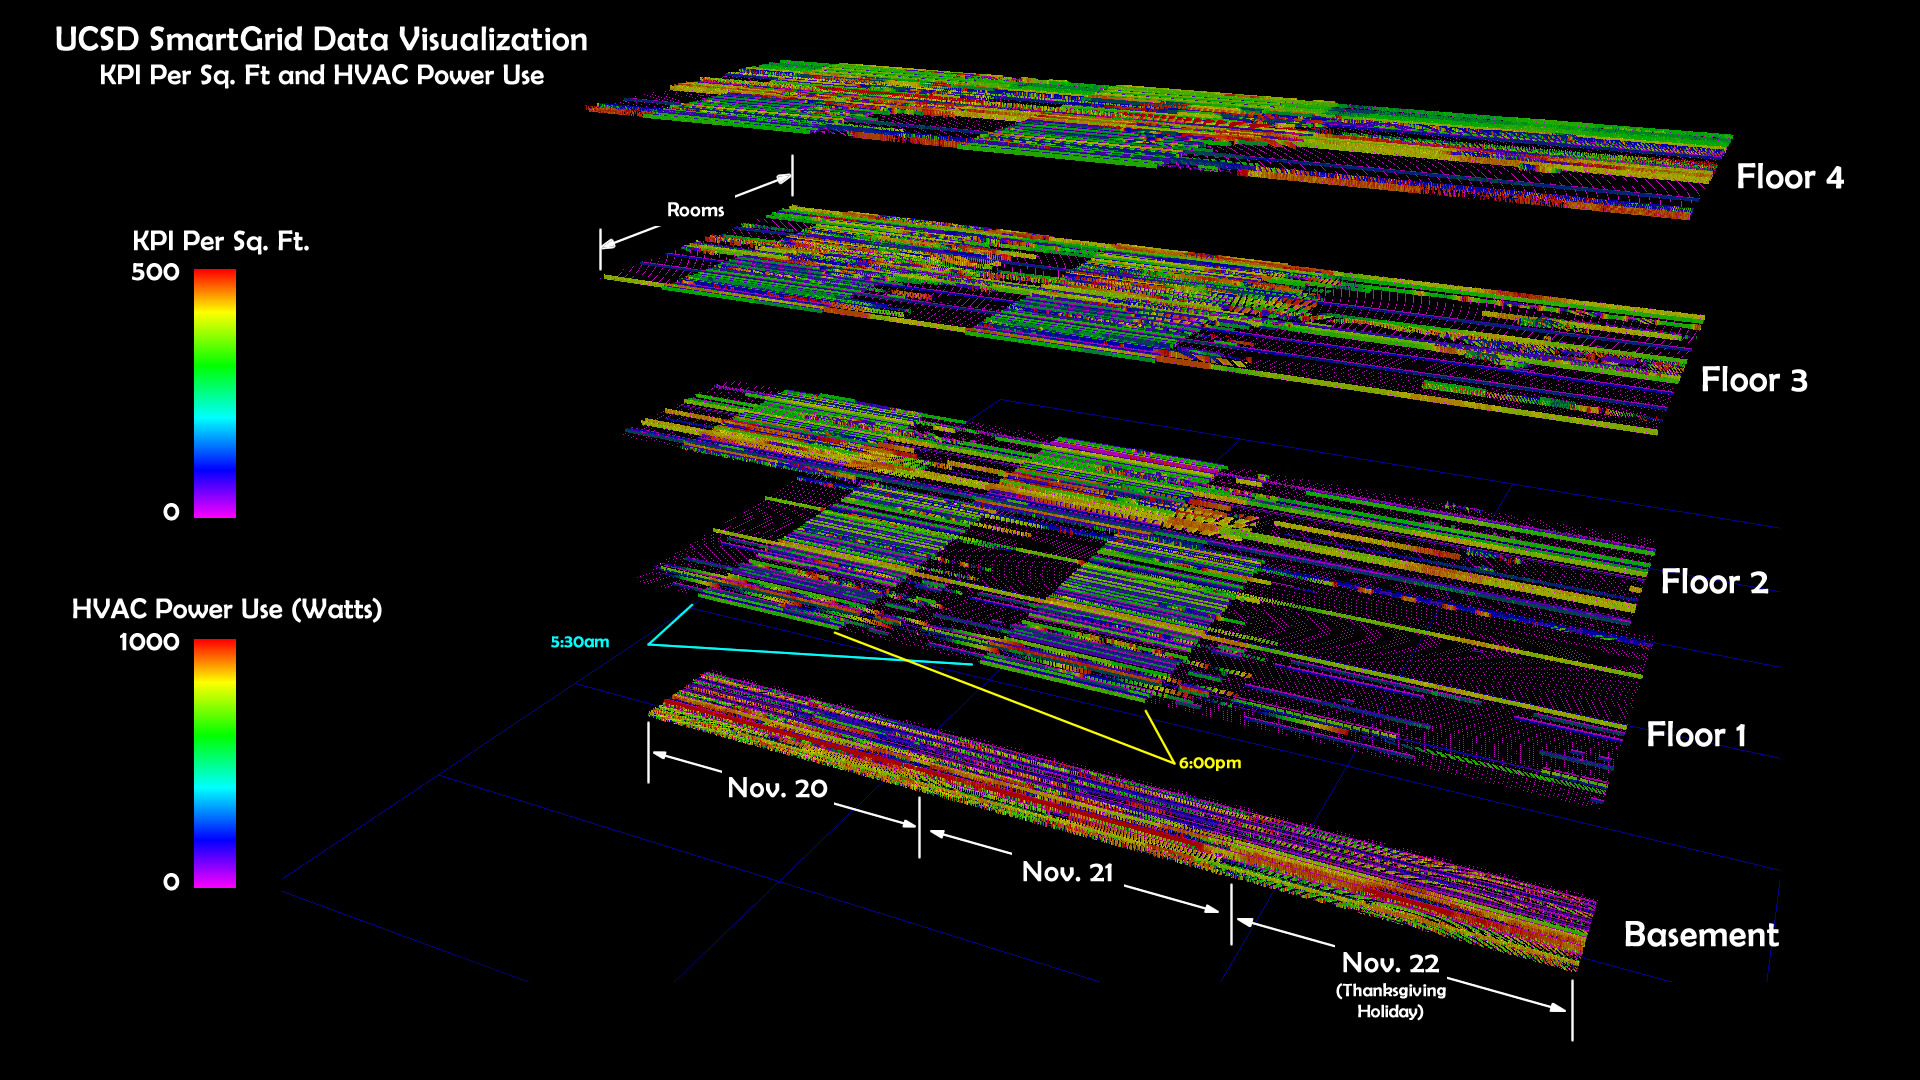
Room Locations (Floor 2)
| Floor | View 1 | View 2 | View 3 |
| Base | 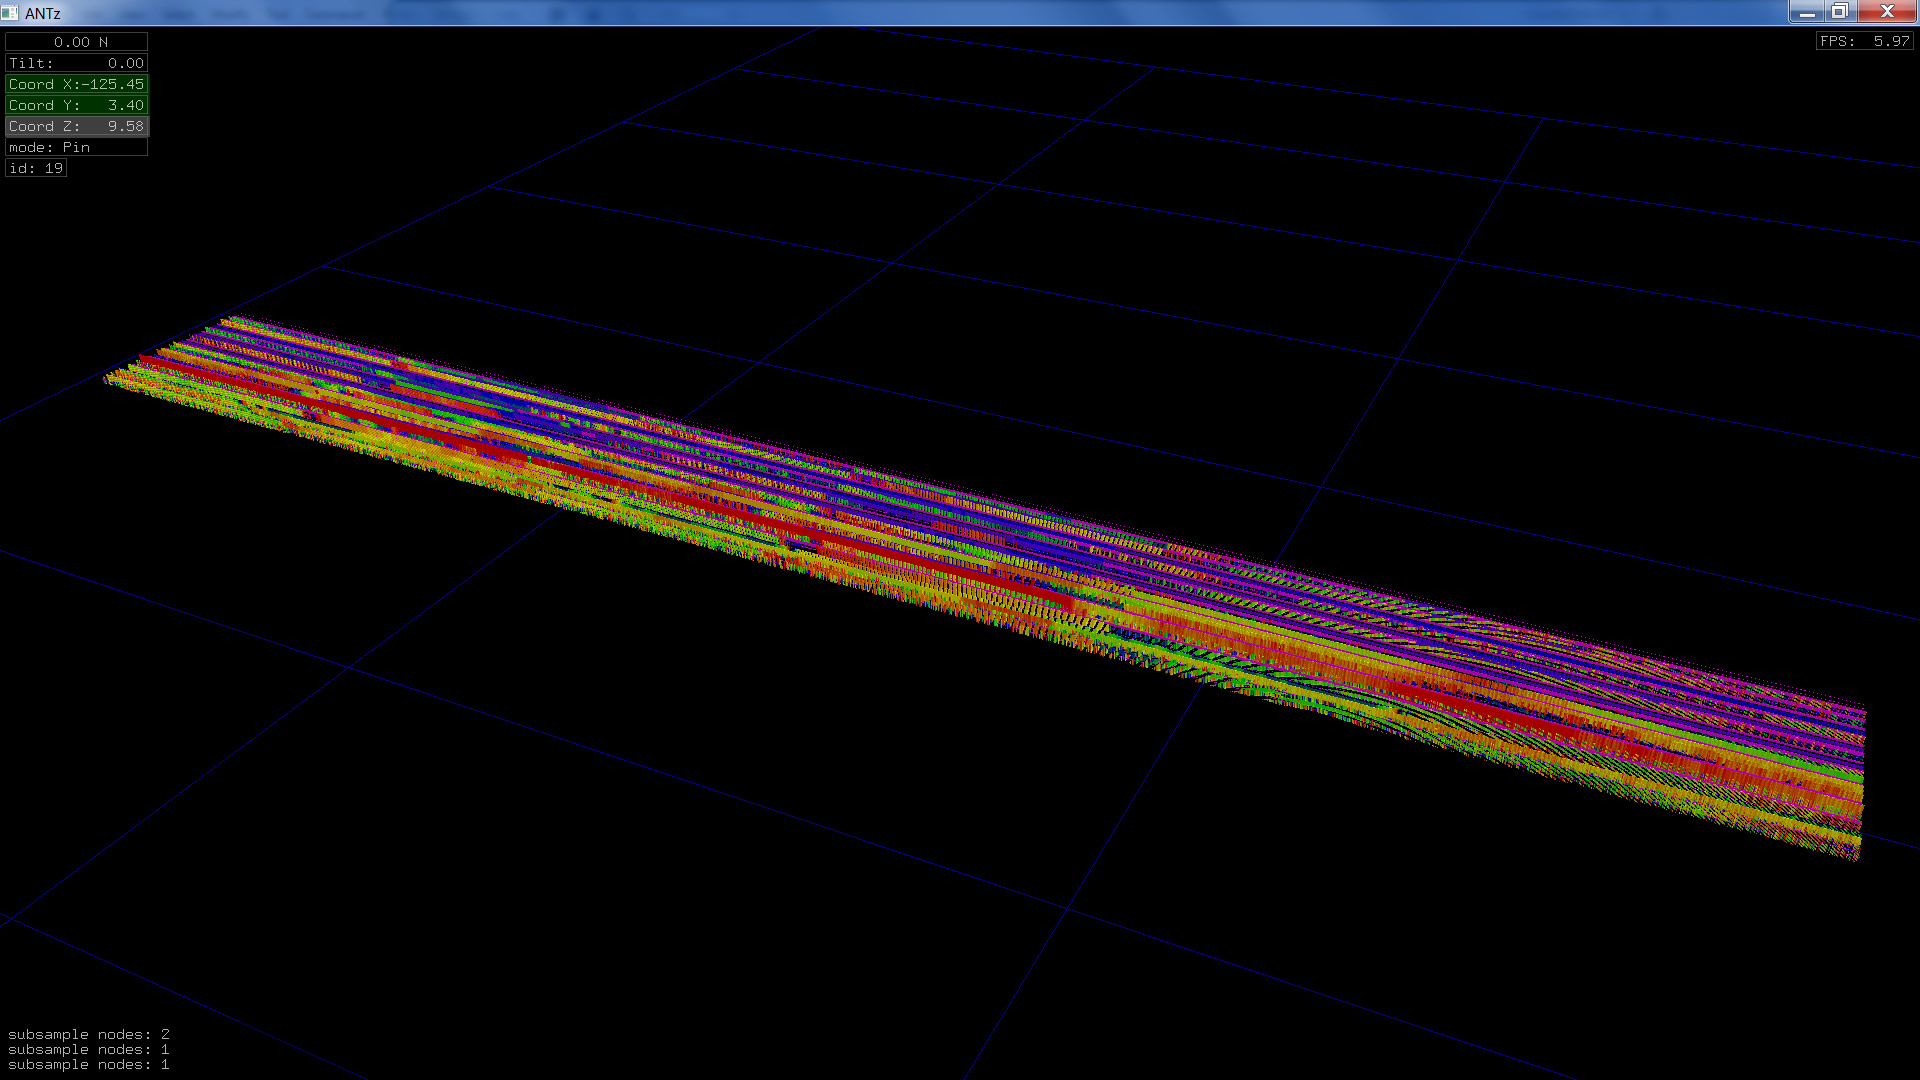 |
 |
 |
| 1 | |
 |
 |
| 2 | 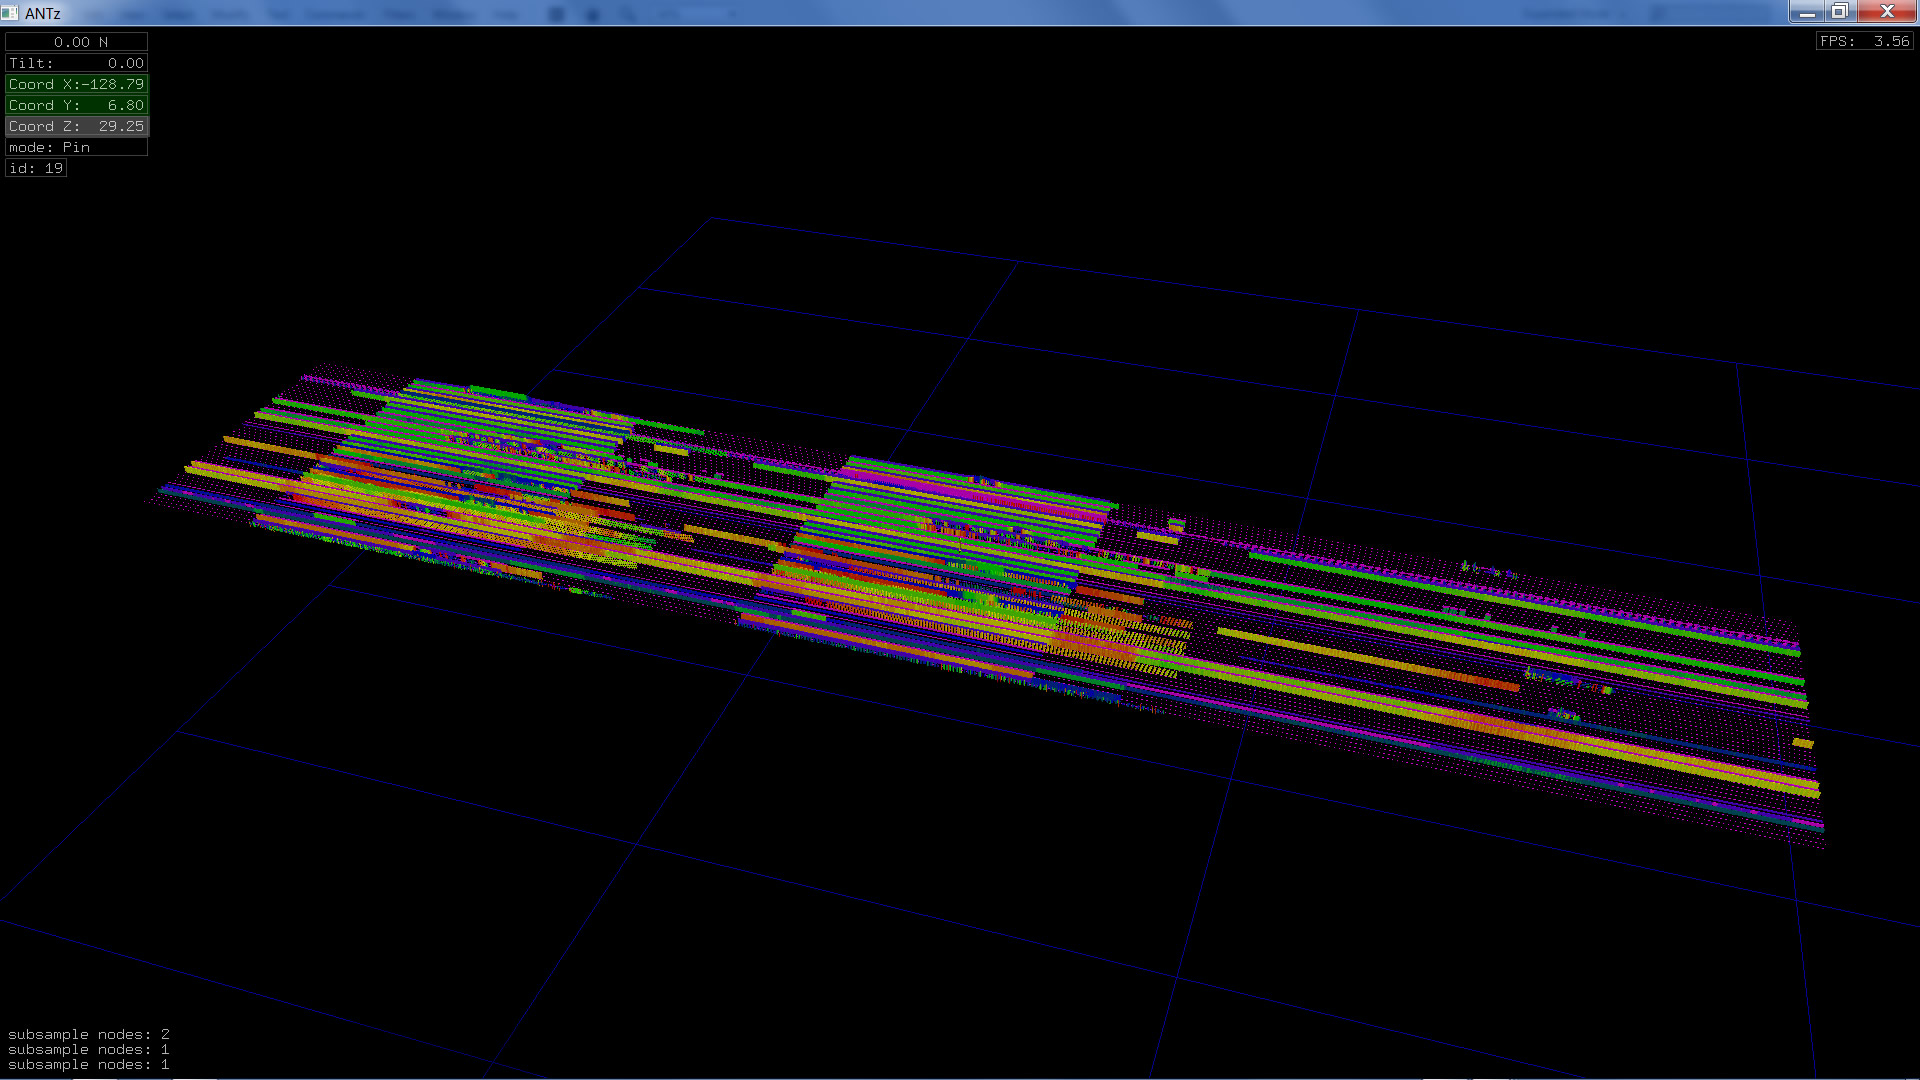 |
 |
 |
| 3 | 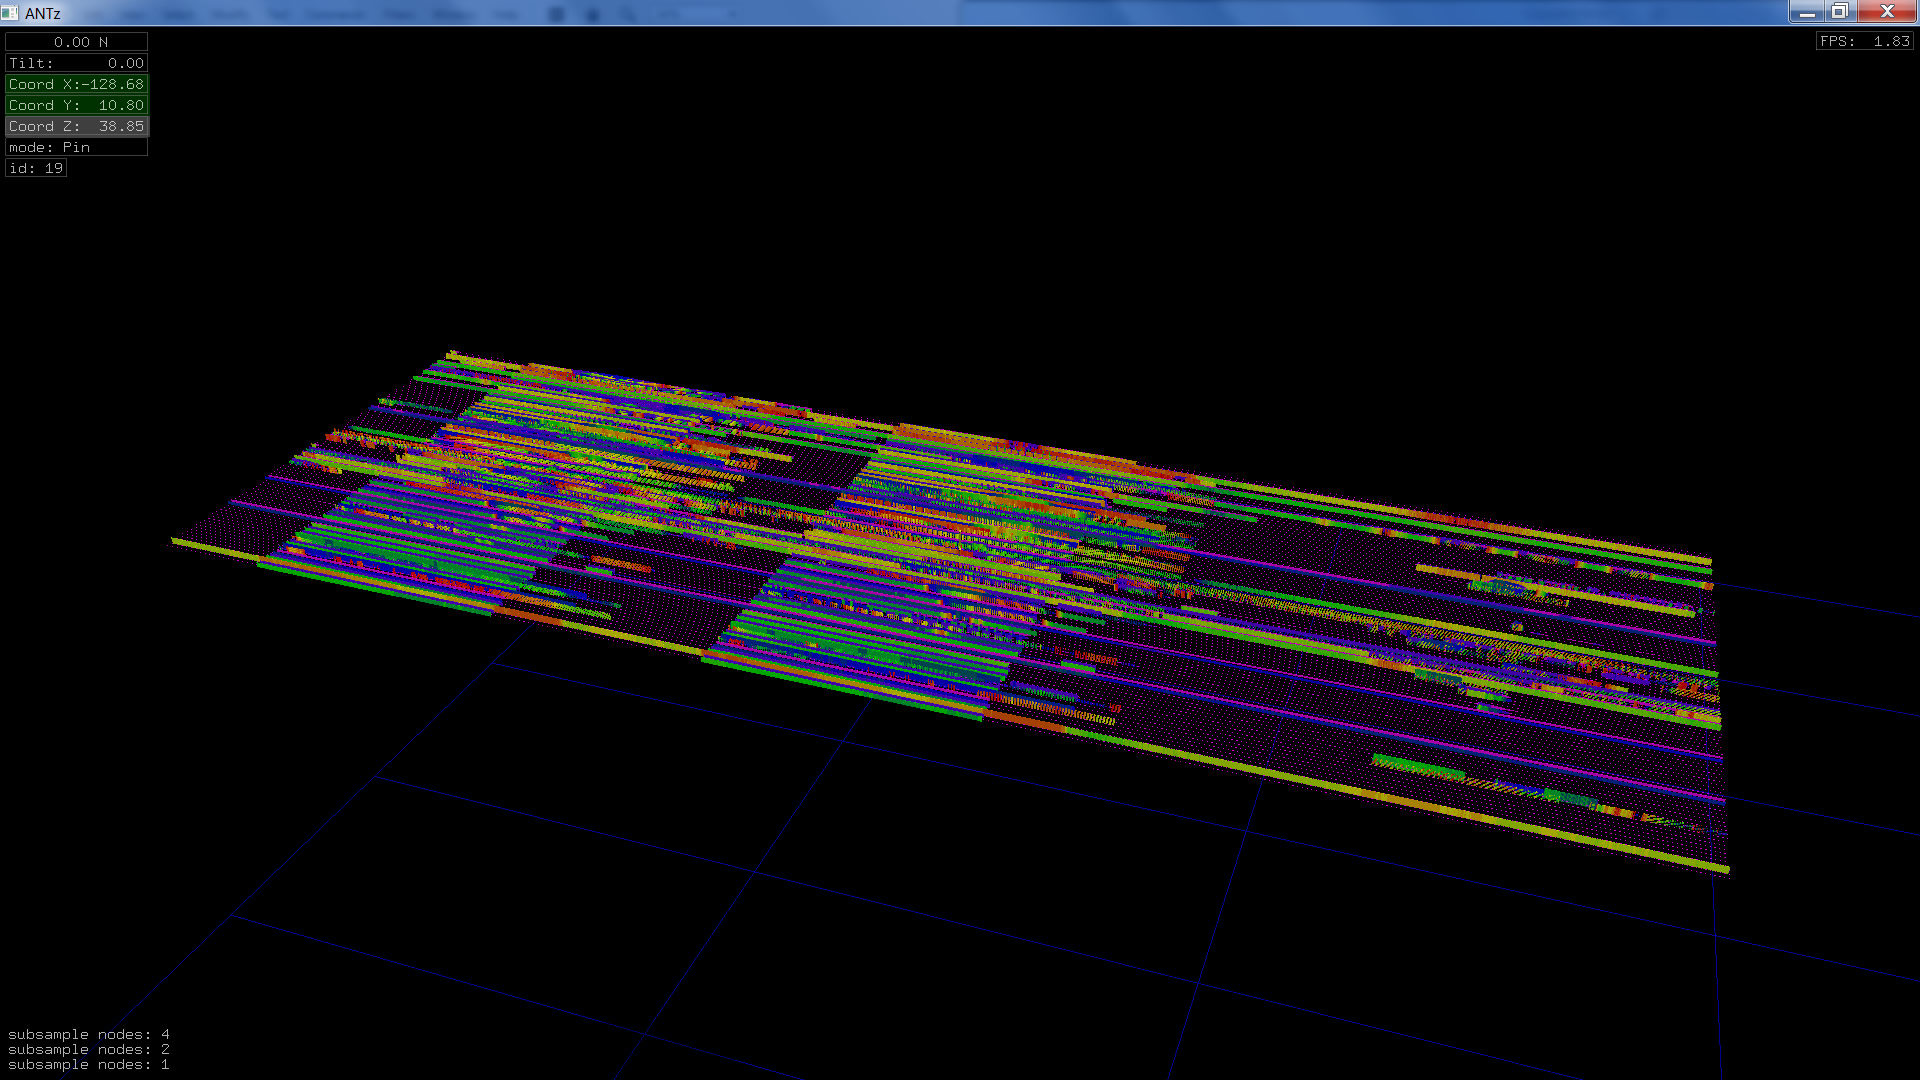 |
 |
 |
| 4 | 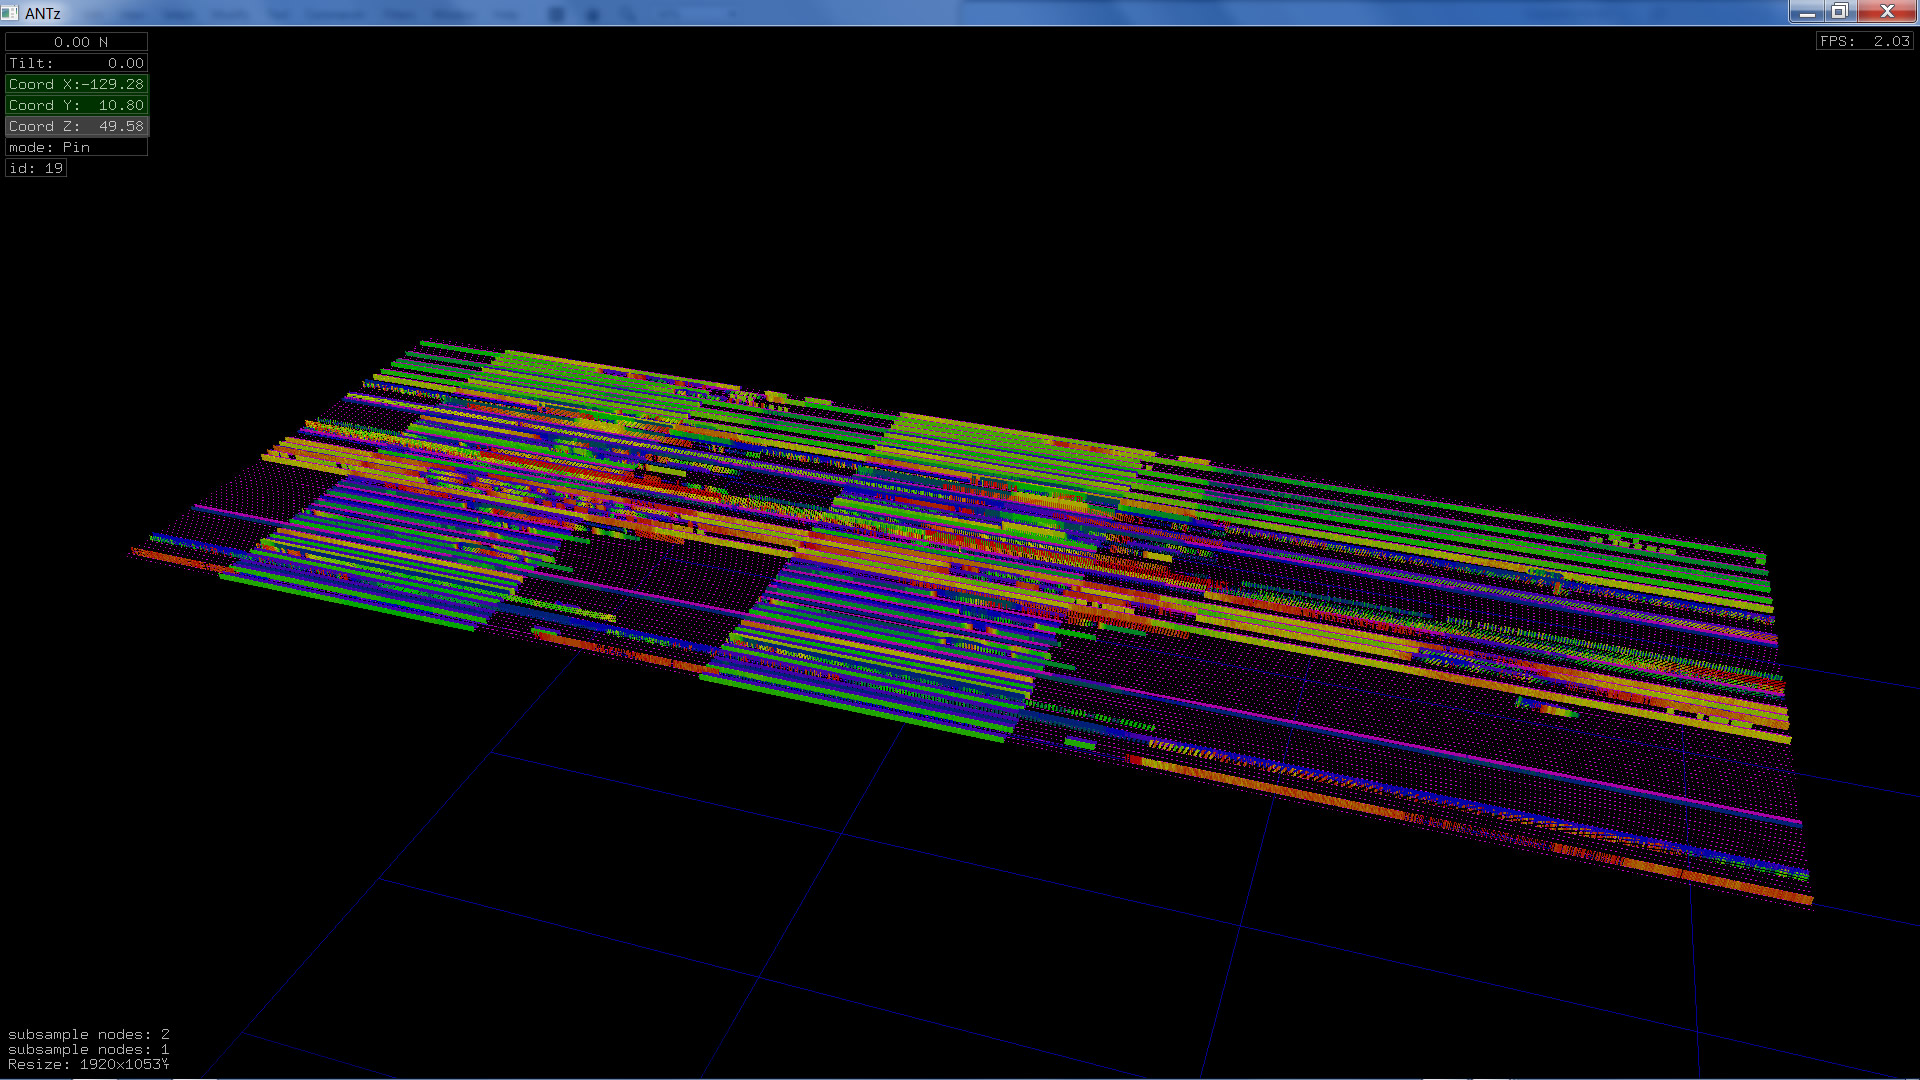 |
 |
|
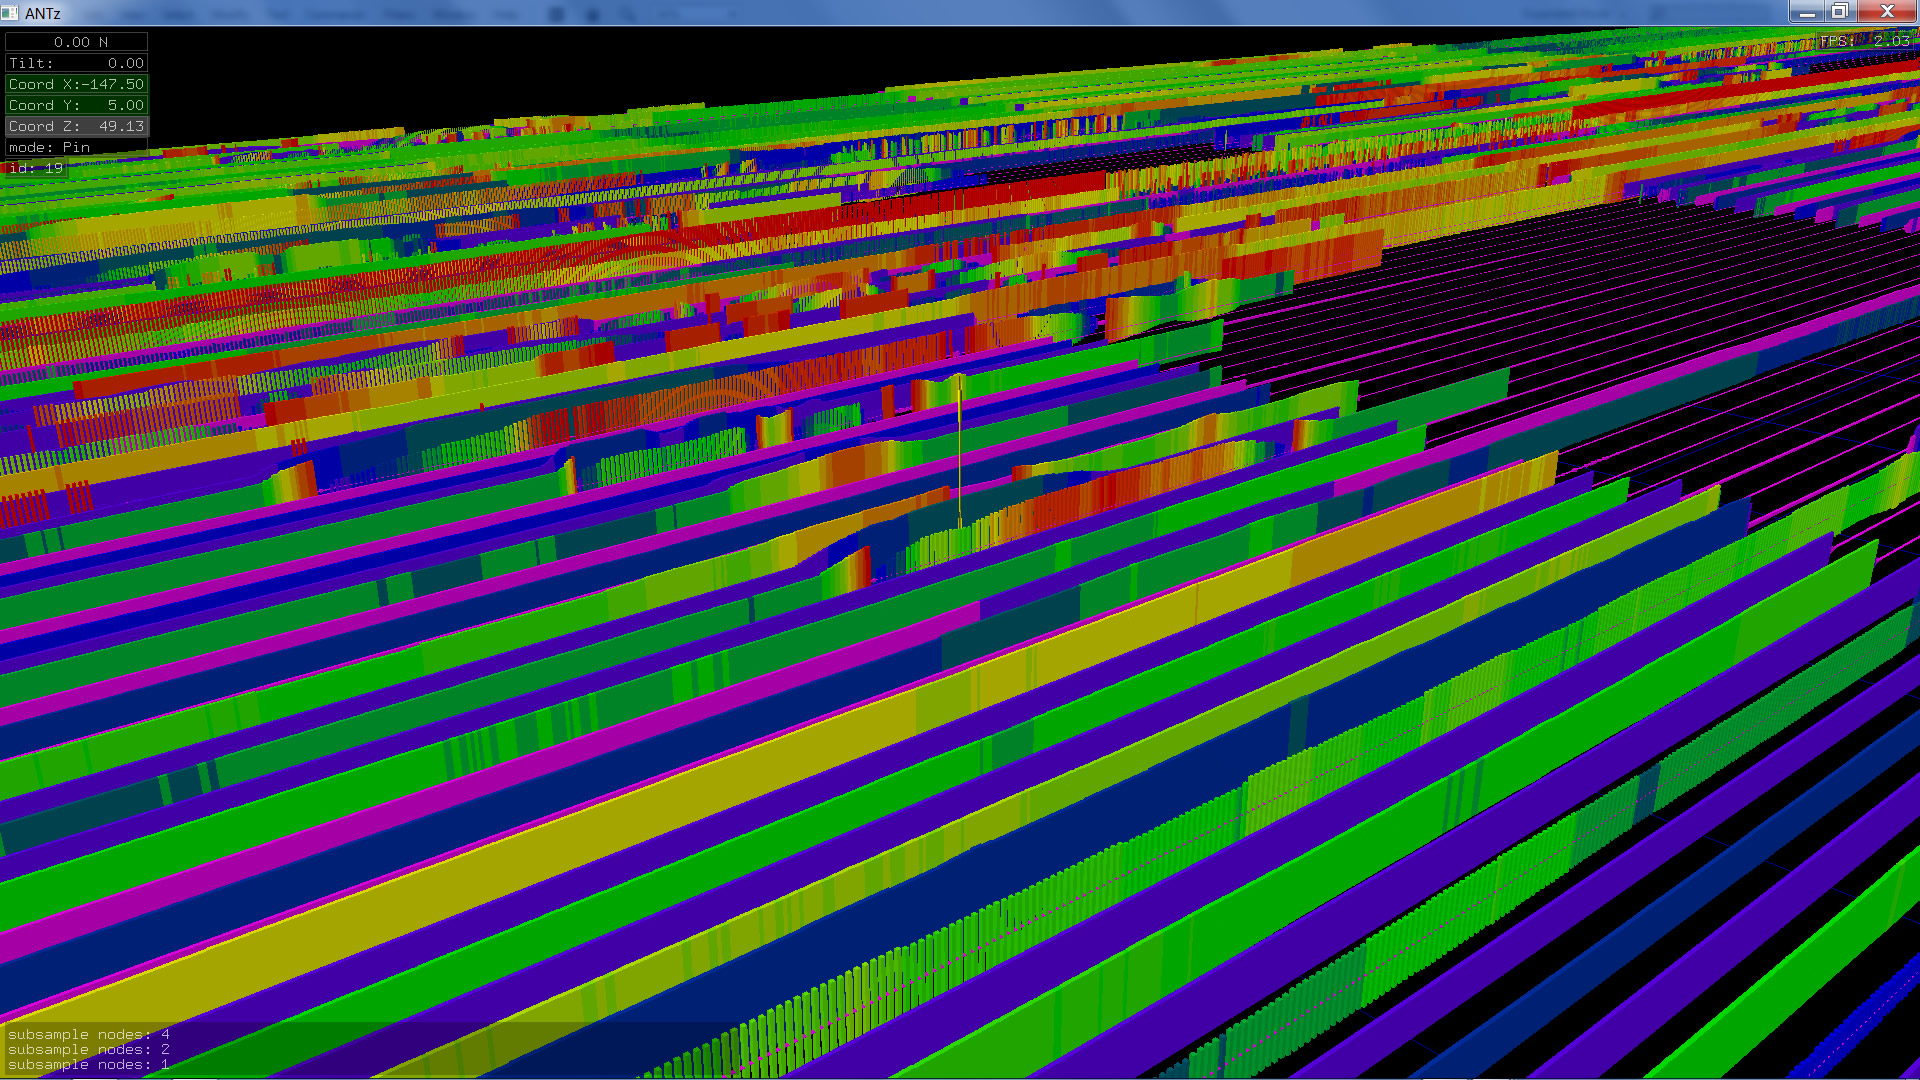
Download Sample Data
To run sample data viz, download and extract zip, run antz.exe, hit the "1" key to load the data with labels. (NOTE: executable is Windows only. Download the appropriate executable for your OS)
Basement (5.5 Mb zip)
Floor 1 (14.3 Mb zip)
Floor 2 (8.4 Mb zip)
Floor 3 (15.6 Mb zip)
Floor 4 (16 Mb zip)
All Floors (60 Mb zip)
November 20-22, 2012
San Diego Supercomputer Center, East Building
Data is collected every 1 minute. Data includes KPI per sq. ft. and HVAC power use.