Main Antz Page | Toroid Visualizations
Advanced Visualization of California Standardized Test Scores (STAR)
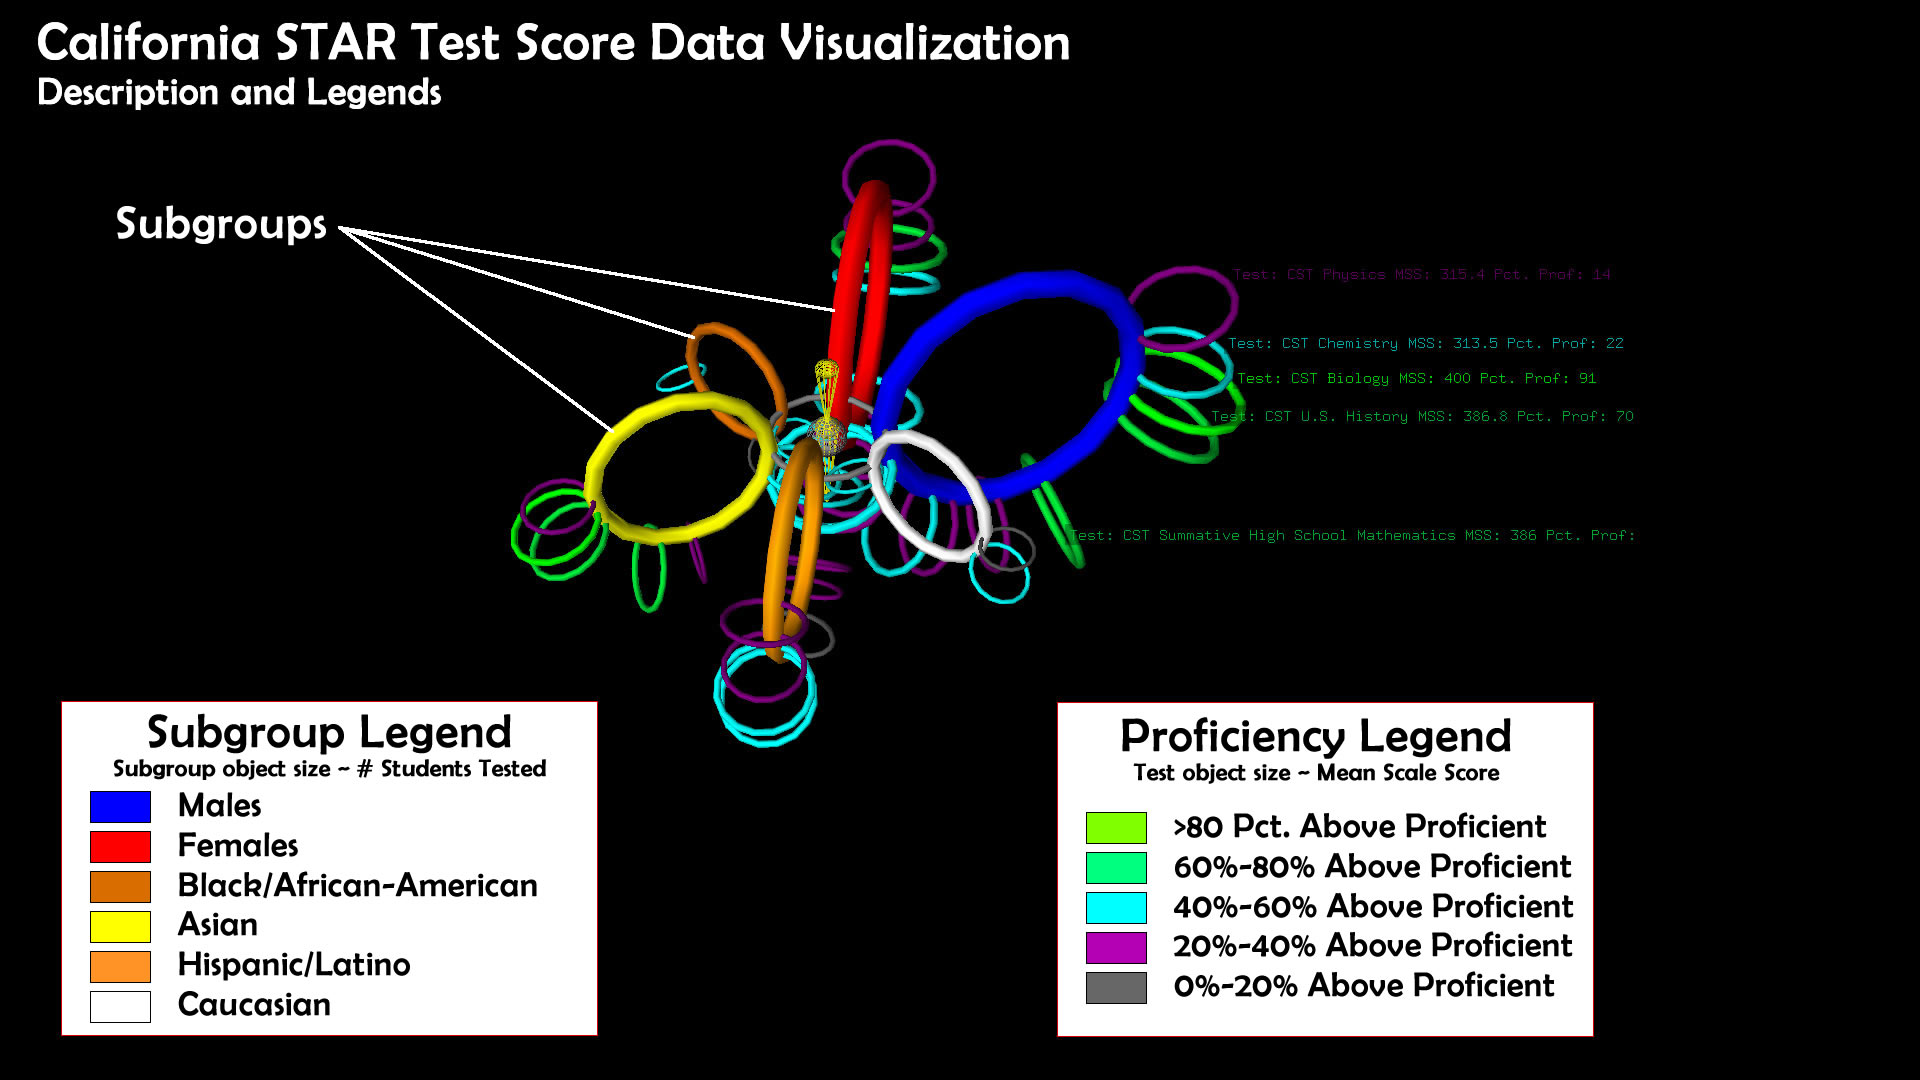
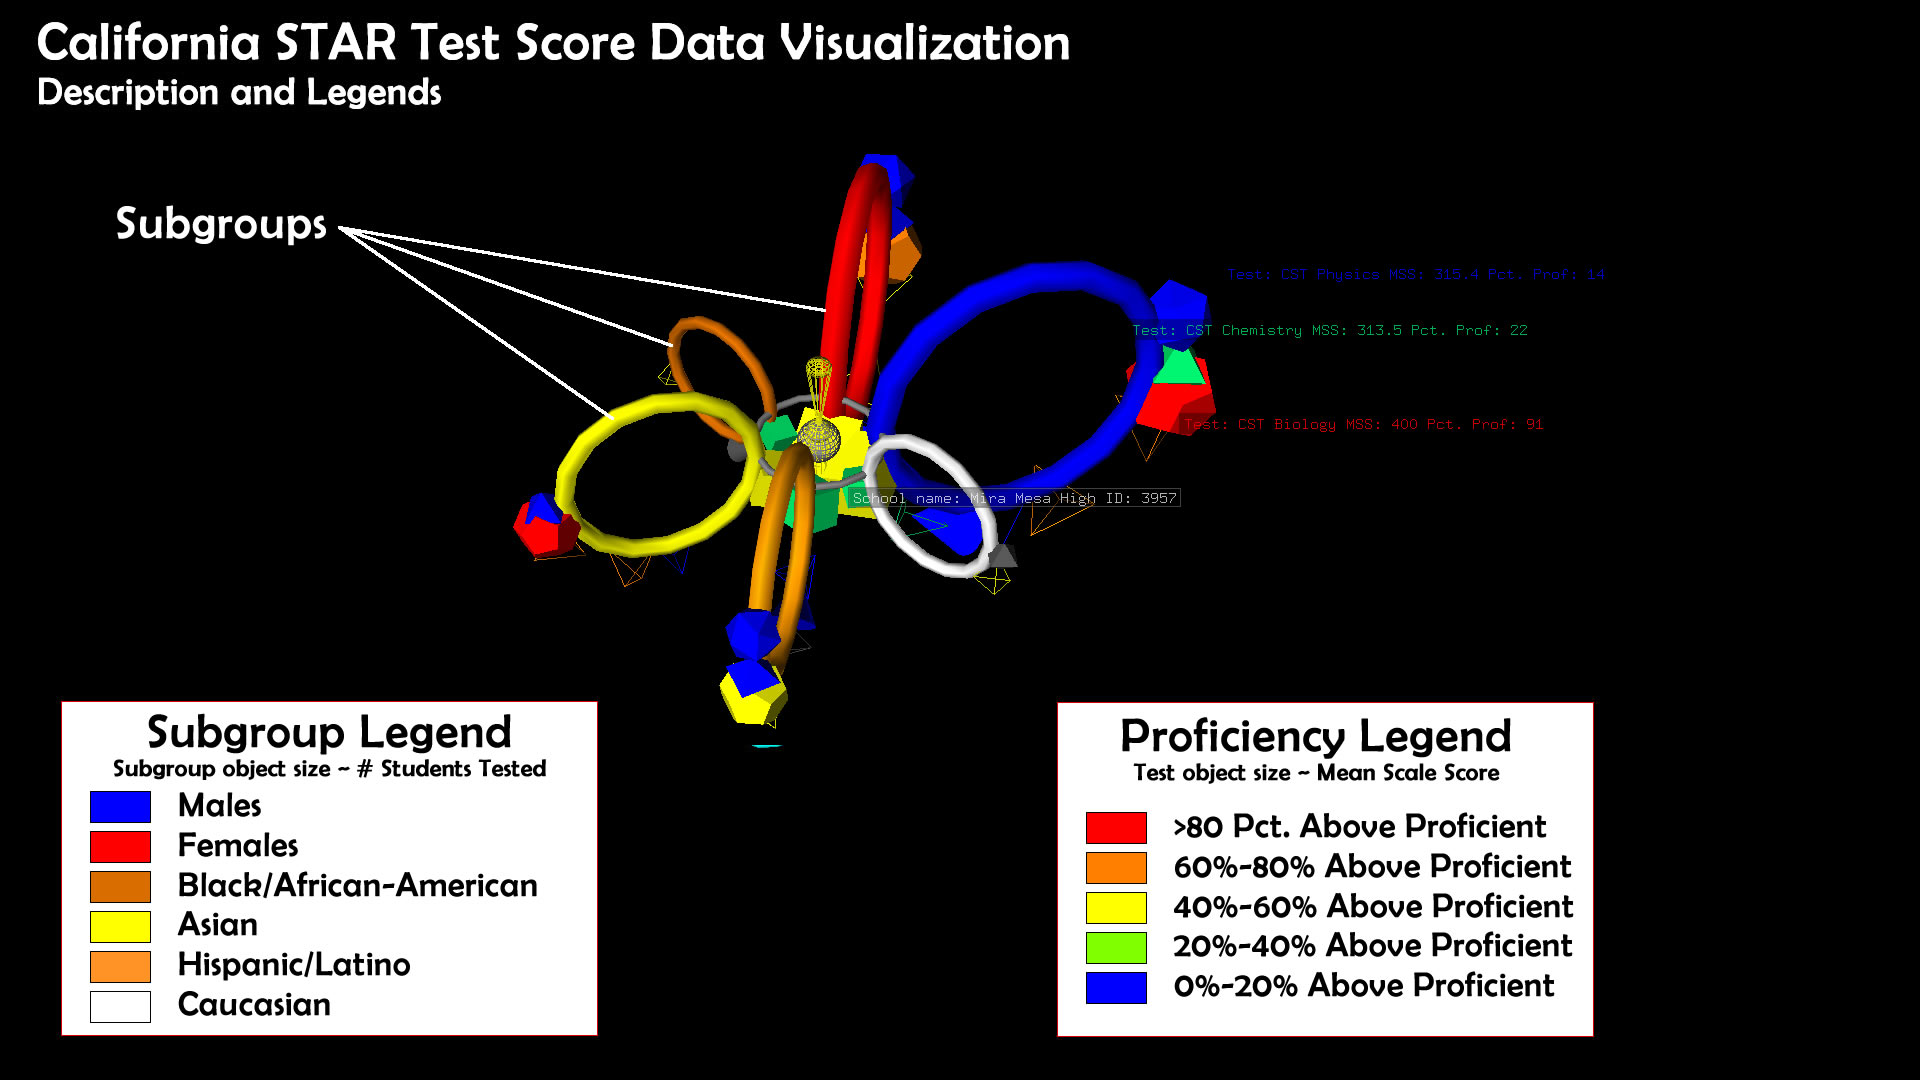
Legends
Query the Database Interactively With Antz
Downloading Data Preprocessed for Visualization with Antz
To view the data, run the antz_b.exe executable and hit the "1" key. This will load the ANTZ0001.CSV file in the antzcsv folder in addition to the Tag file containing the labels.
The downloadable zips below use Antz Labels for descriptive information. Select an object and hit the "i" key to display the object's label.
Single Grade, All Years 2003 - 2012
Learn more about this dataset from the California STAR testing data site.
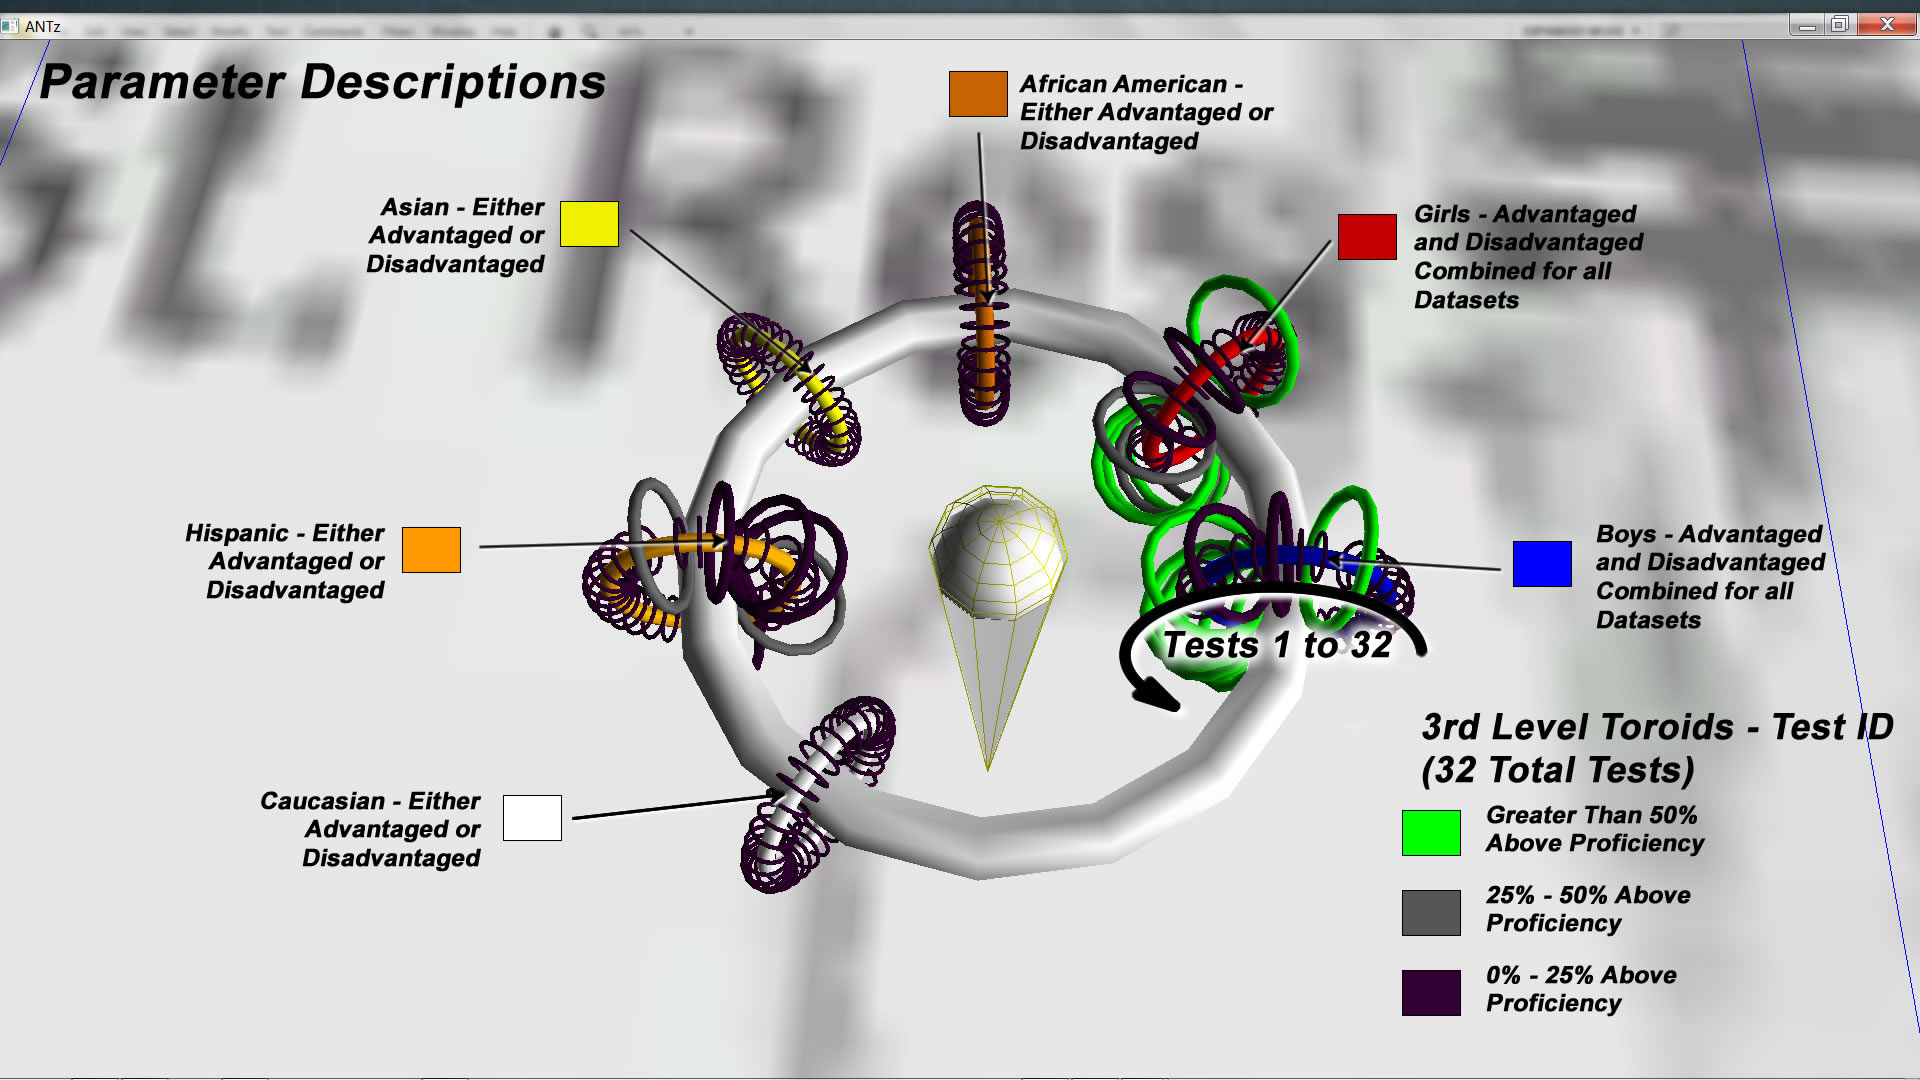
Parameter Descriptions
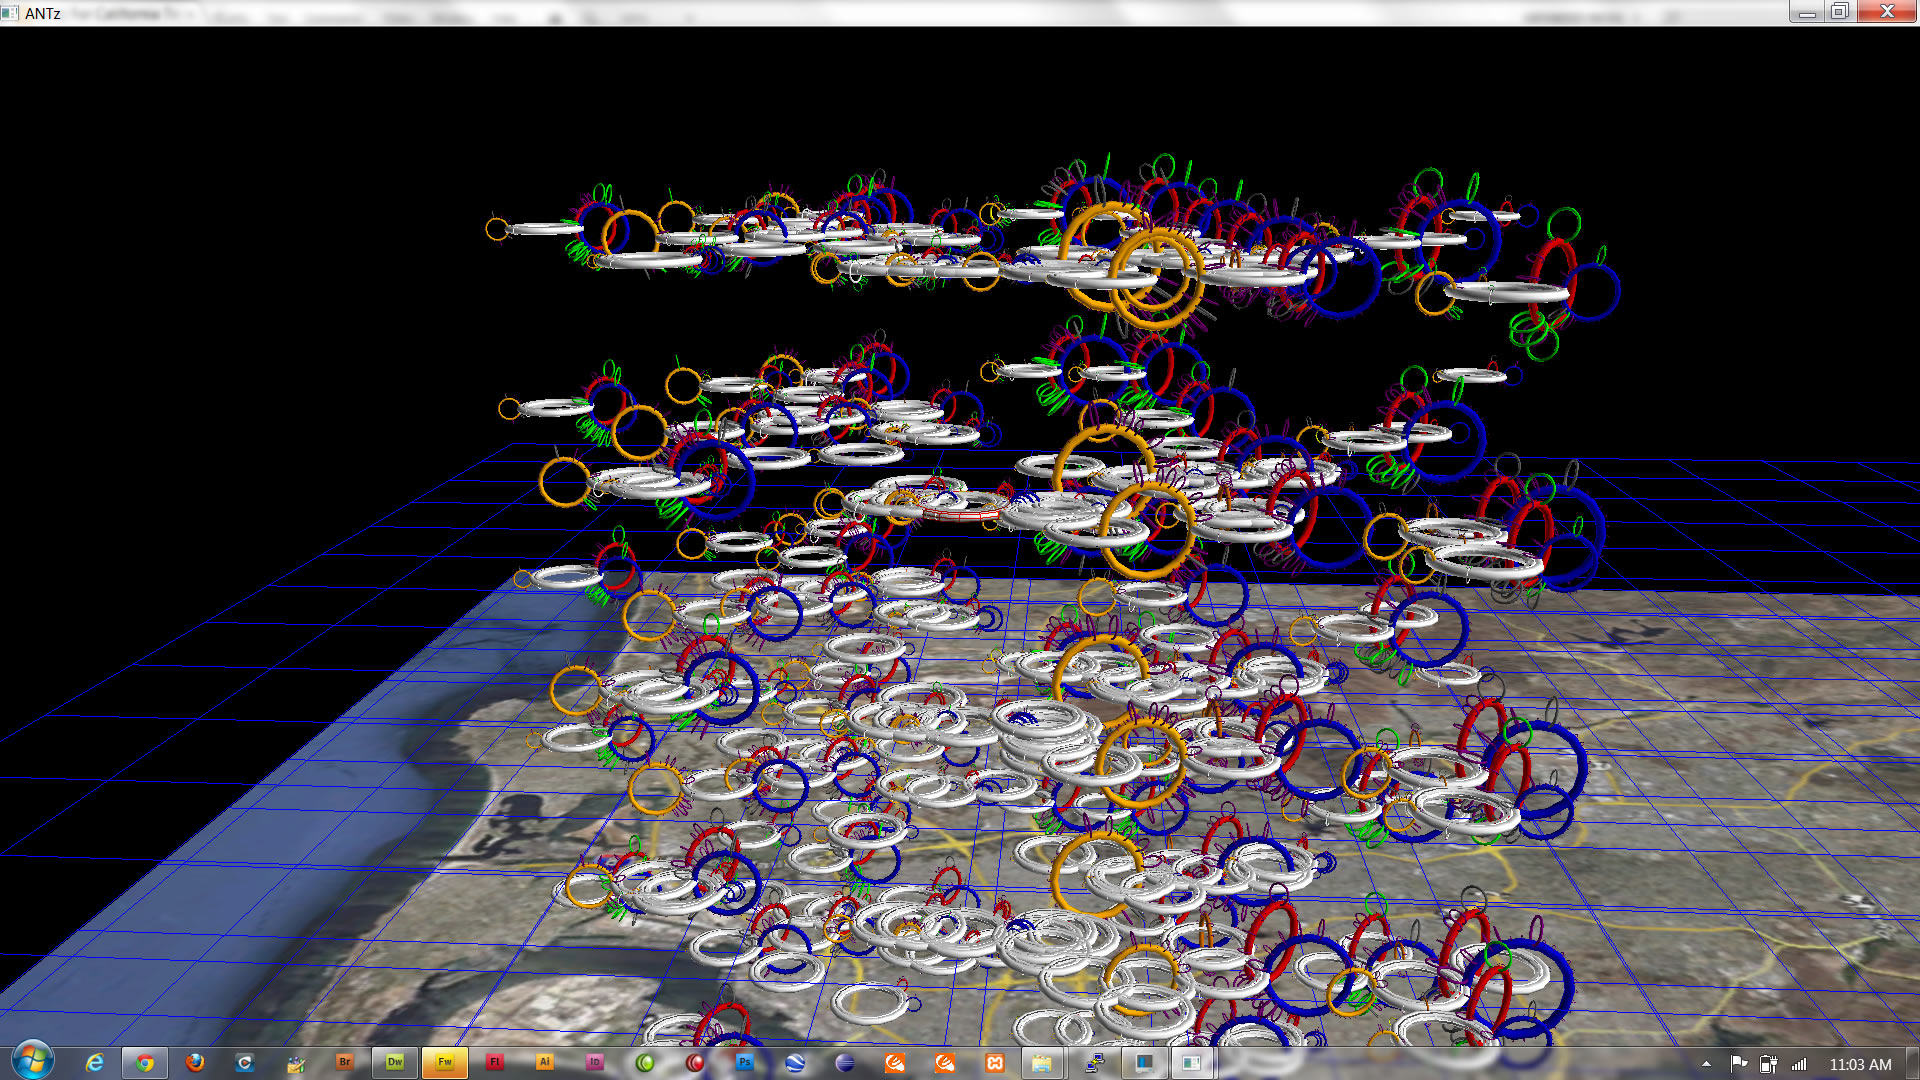
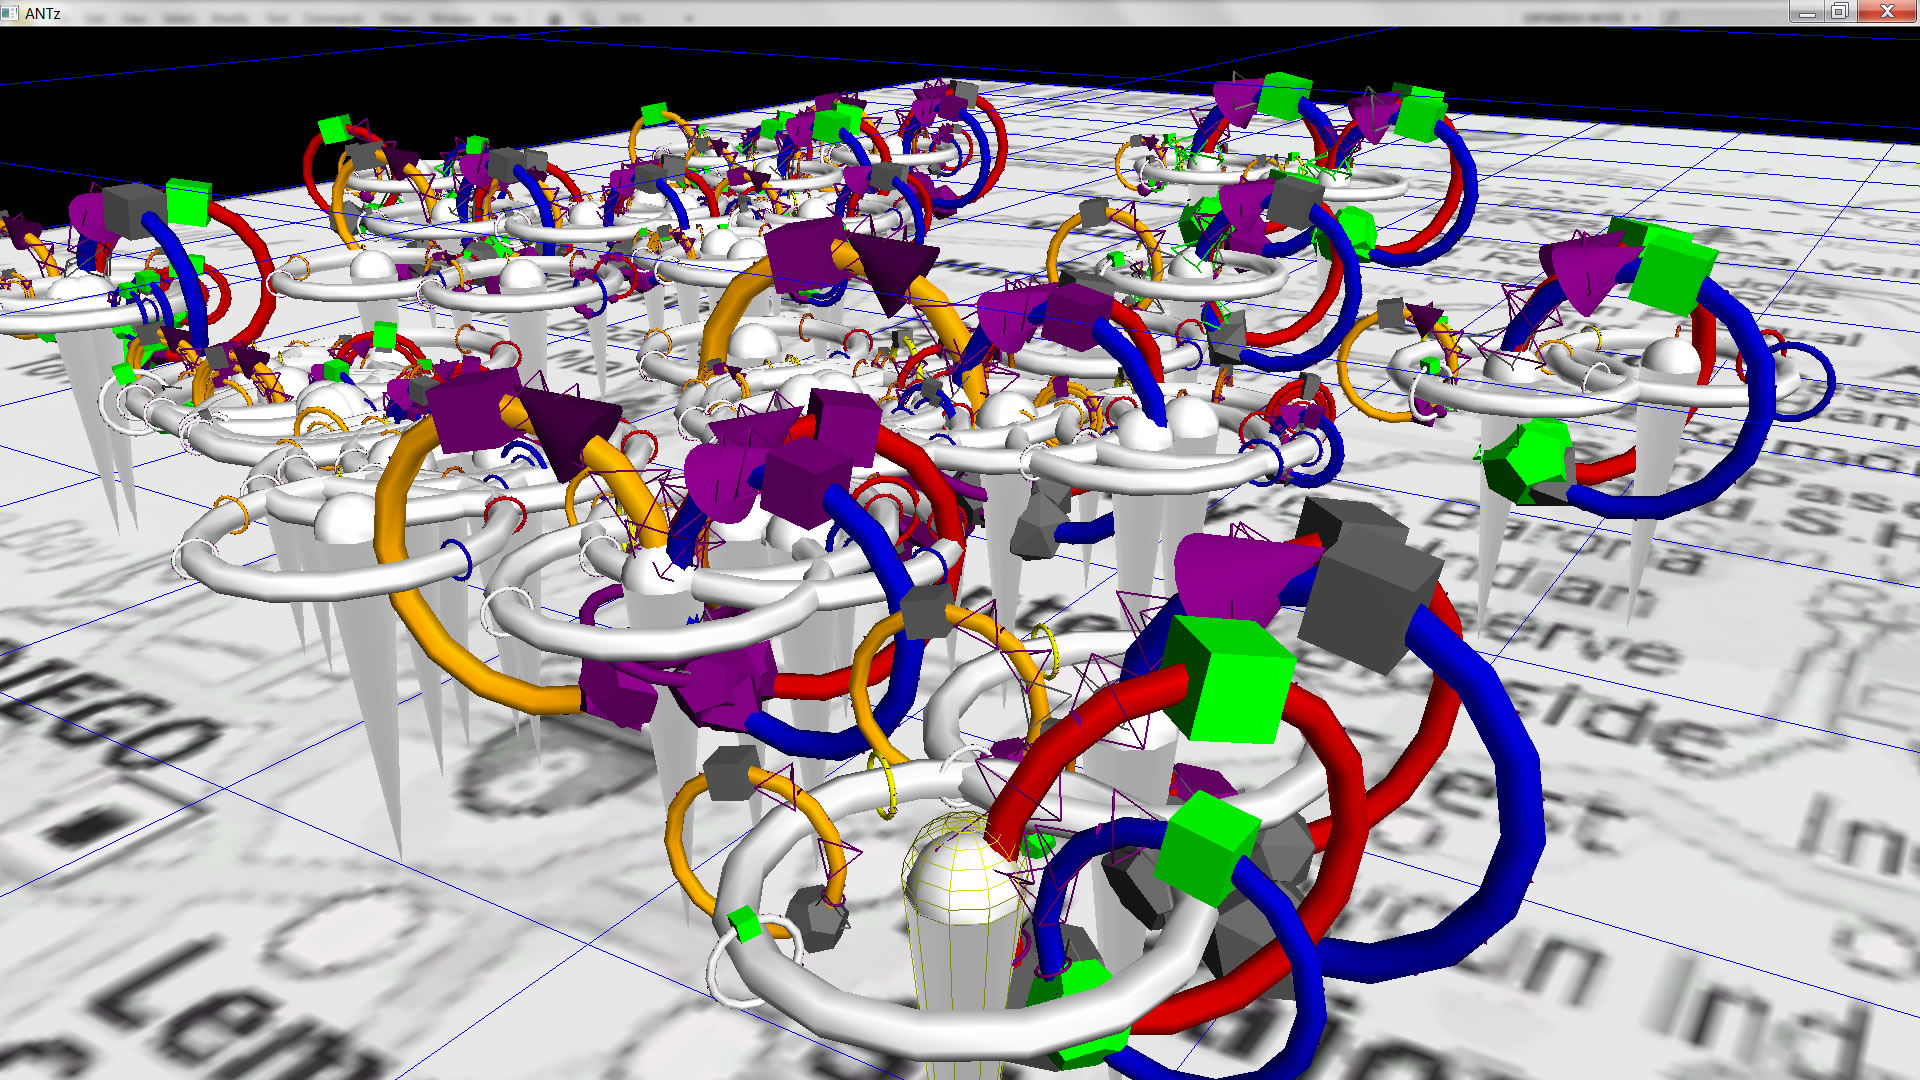
First Order Toroid: the first order toroid is constant size and colored white to remain neutral across all schools.
Second Order Toroids: the second order toroids are colored based on ethnic subgroup group (see image below). We have chosen six groups out of dozens of possible ethnic groups to keep the visualizations relatively uncluttered and easier to interpret. The size of the 2nd order toroids corresponds to the number of students tested in in that school for that subgroup.
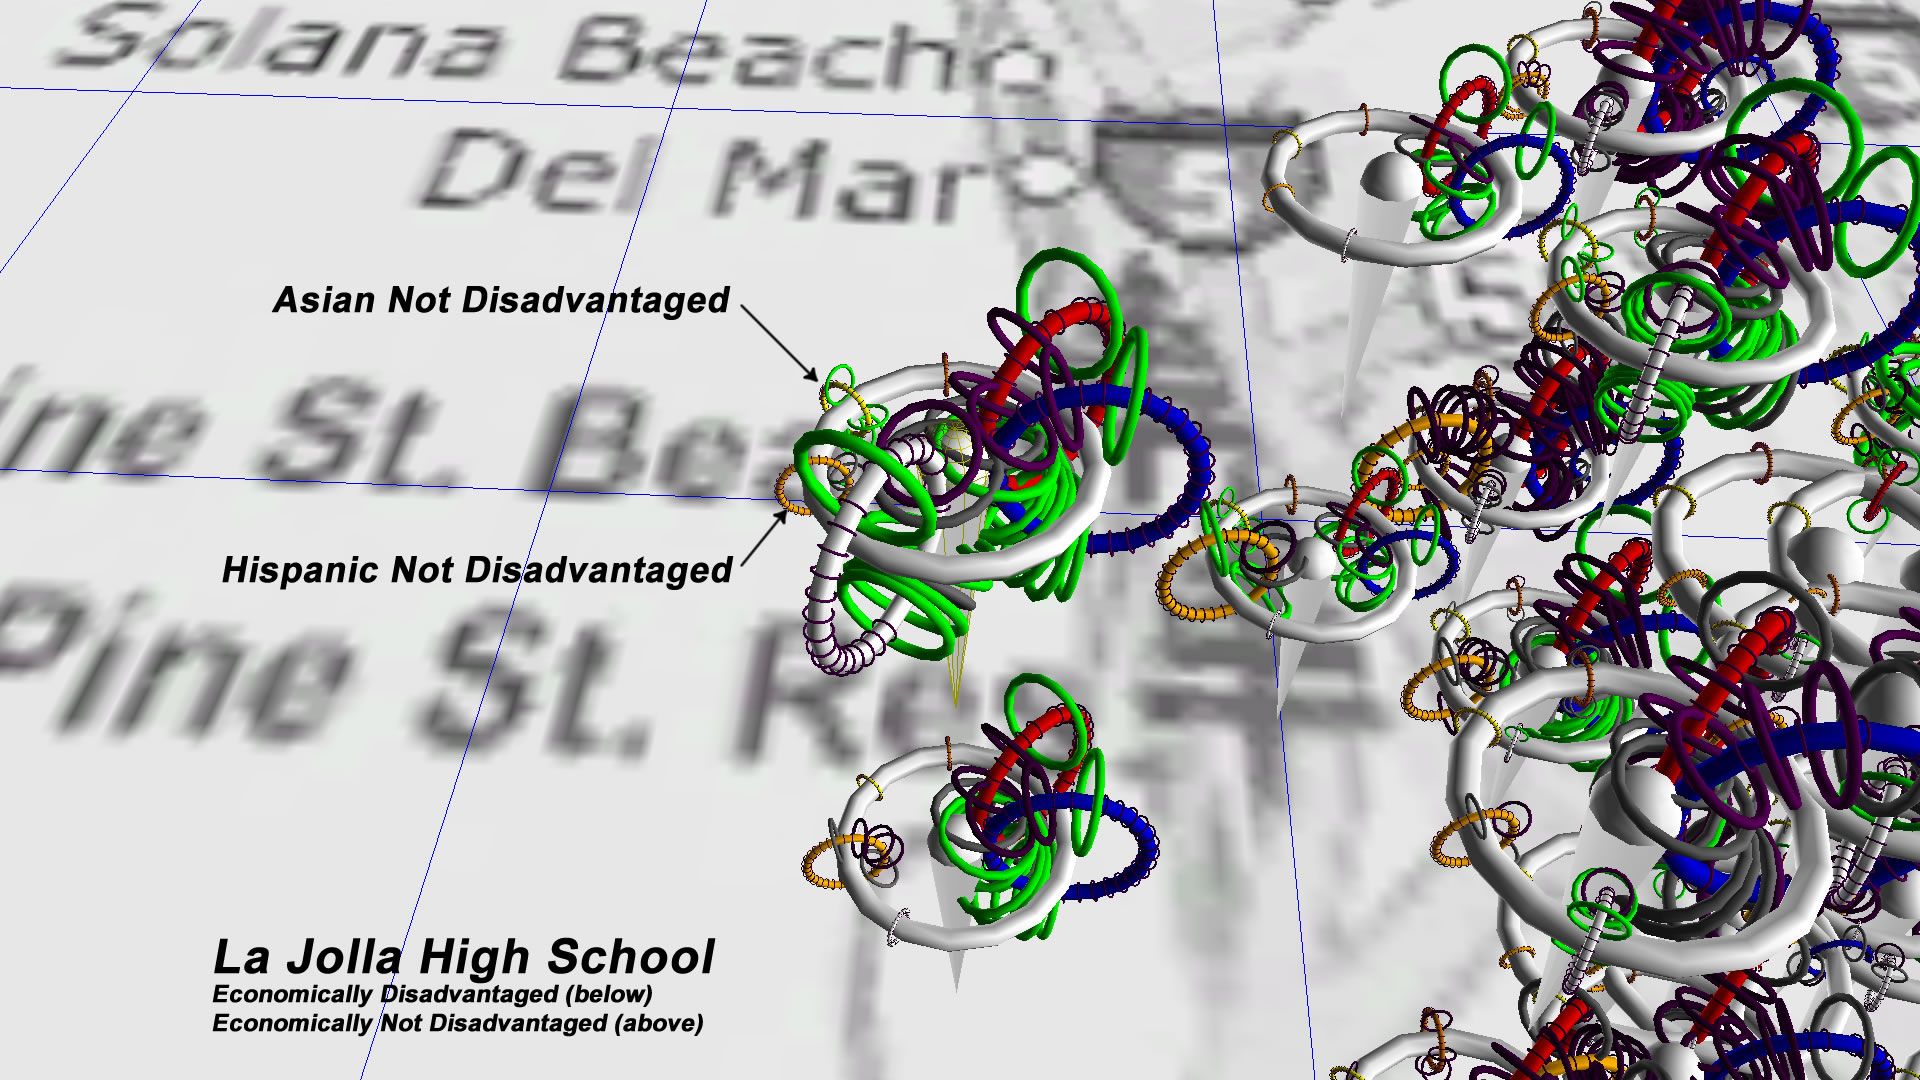
Third Order Toroids: the third order toroids represent test type. The size of the third order toroid represents the actual mean test score within the ethnic subgroup. The colors (green, gray, deep purple) represent percent proficiency within the ethnic subgroup. These groups are either economically disadvantaged or not disadvantaged, as specified in the images.
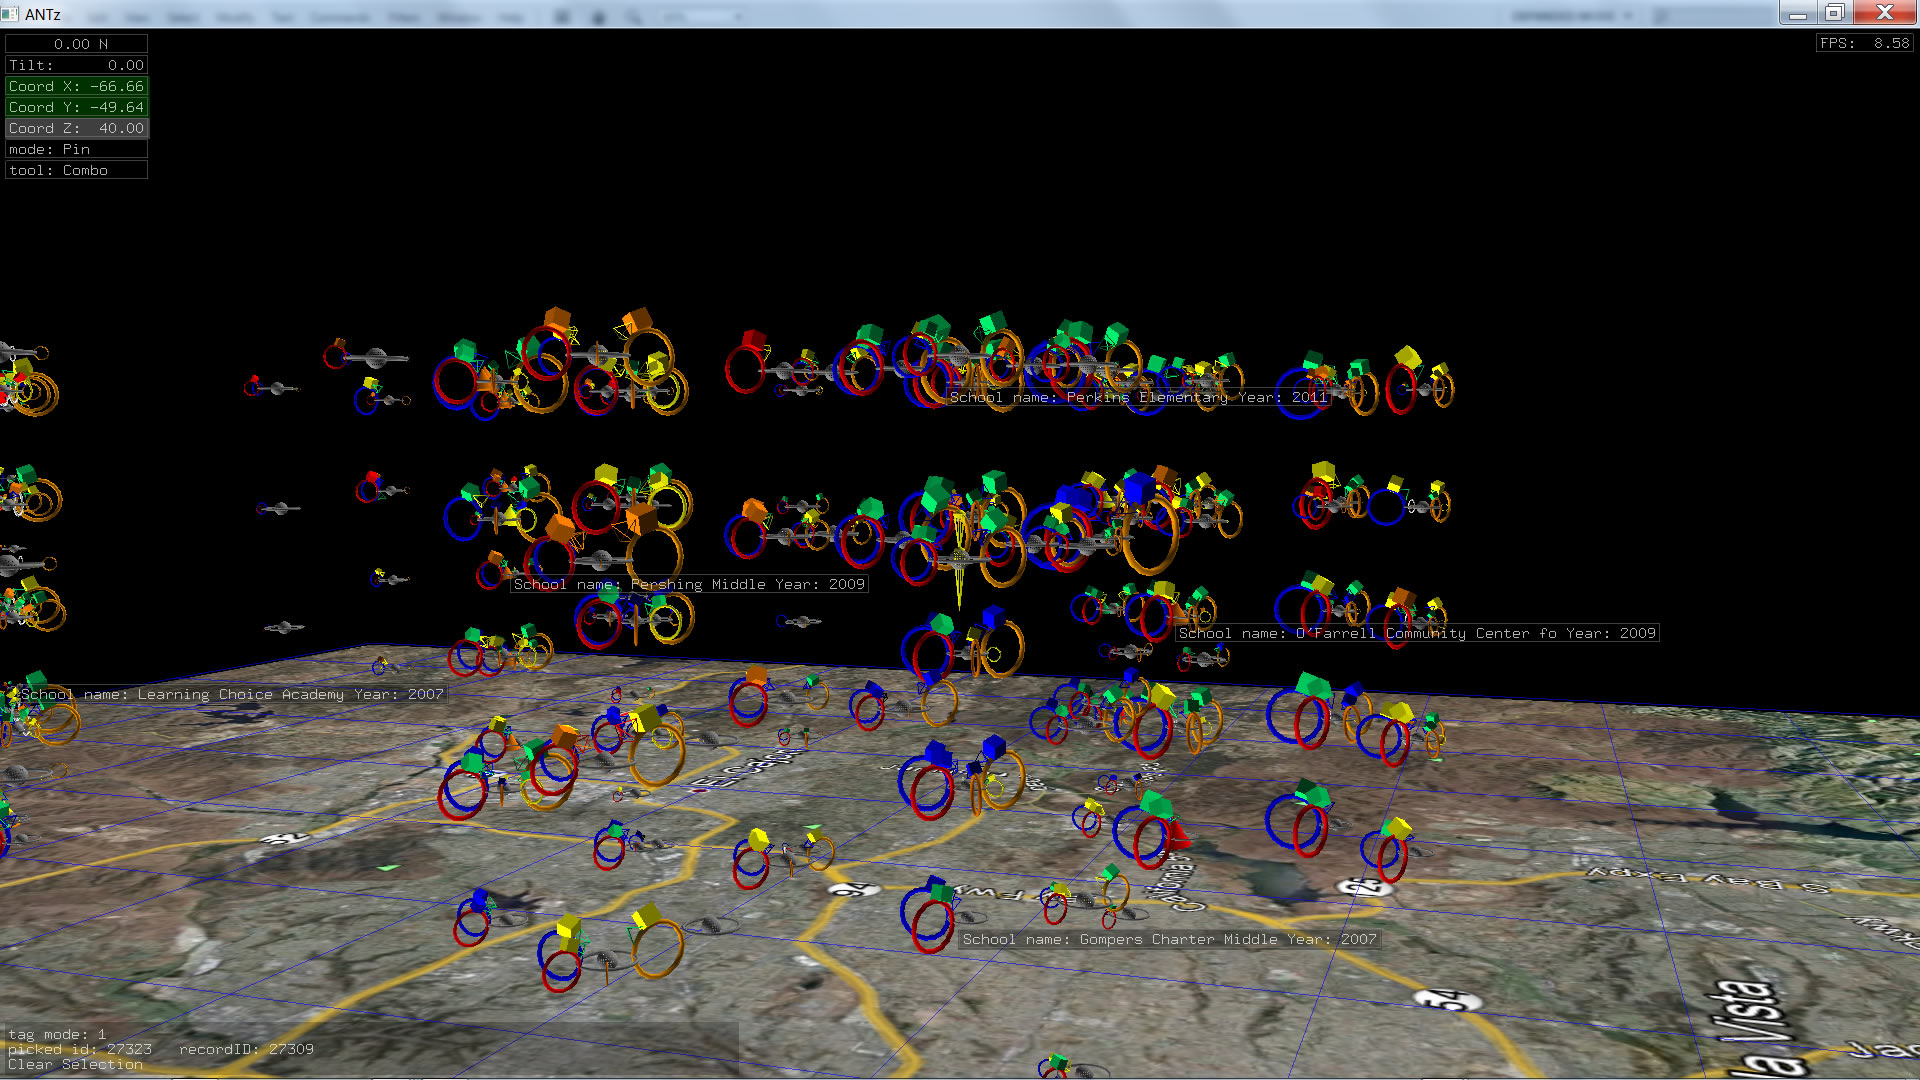
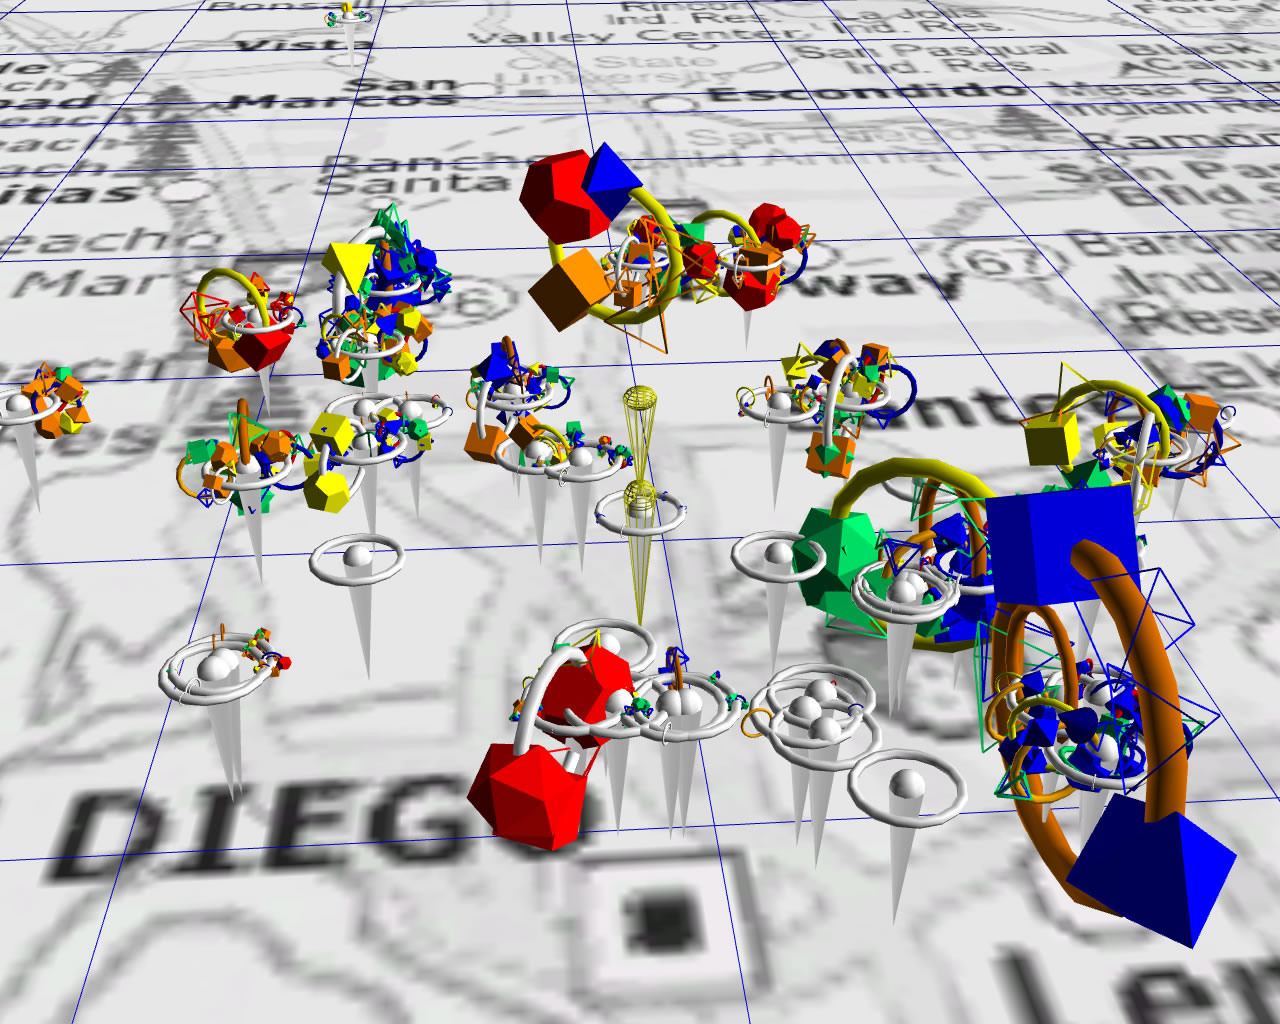
The image below shows data for SDUSD 2010 Grade 11 with three significant variations:
1) The scale for hispanic (orange) and asian (yellow) subgroups is exaggerrated
2) The proficiency scale color scheme has been modified to a more prismatic scale, and the number of divisions has increased from 3 to 5. In this example, the following scale applies:
- red: greater than 80% above proficiency
- orange:greater than 60% above proficiency
- yellow:greater than 40% above proficiency
- green: greater than 20% above proficiency
- blue: greater than 0% above proficiency
3) Not apparent from the static image, 3rd order geometries are rotating around their 2nd order toroids at a rotation rate corresponding to their proficiency scale values. This is a continuous scale, not a discrete scale such as color. Therefore this is a more accurate comparative measure than color. These datasets are identified by the term "rot" in their filename on the data downloads page.
The preceding images serve to help us identify variations among ethnic groups and economic status. However, it is difficult to interpret the third level of data since all test id's are represented as toroids. The best we can do is get an overall sense of performance. It would be useful to identify exactly which test (e.g. english arts, math, history, geography, etc.) corresponds with which 3rd order geometry. One possible solution would be to use different geometries to correspond to different tests.
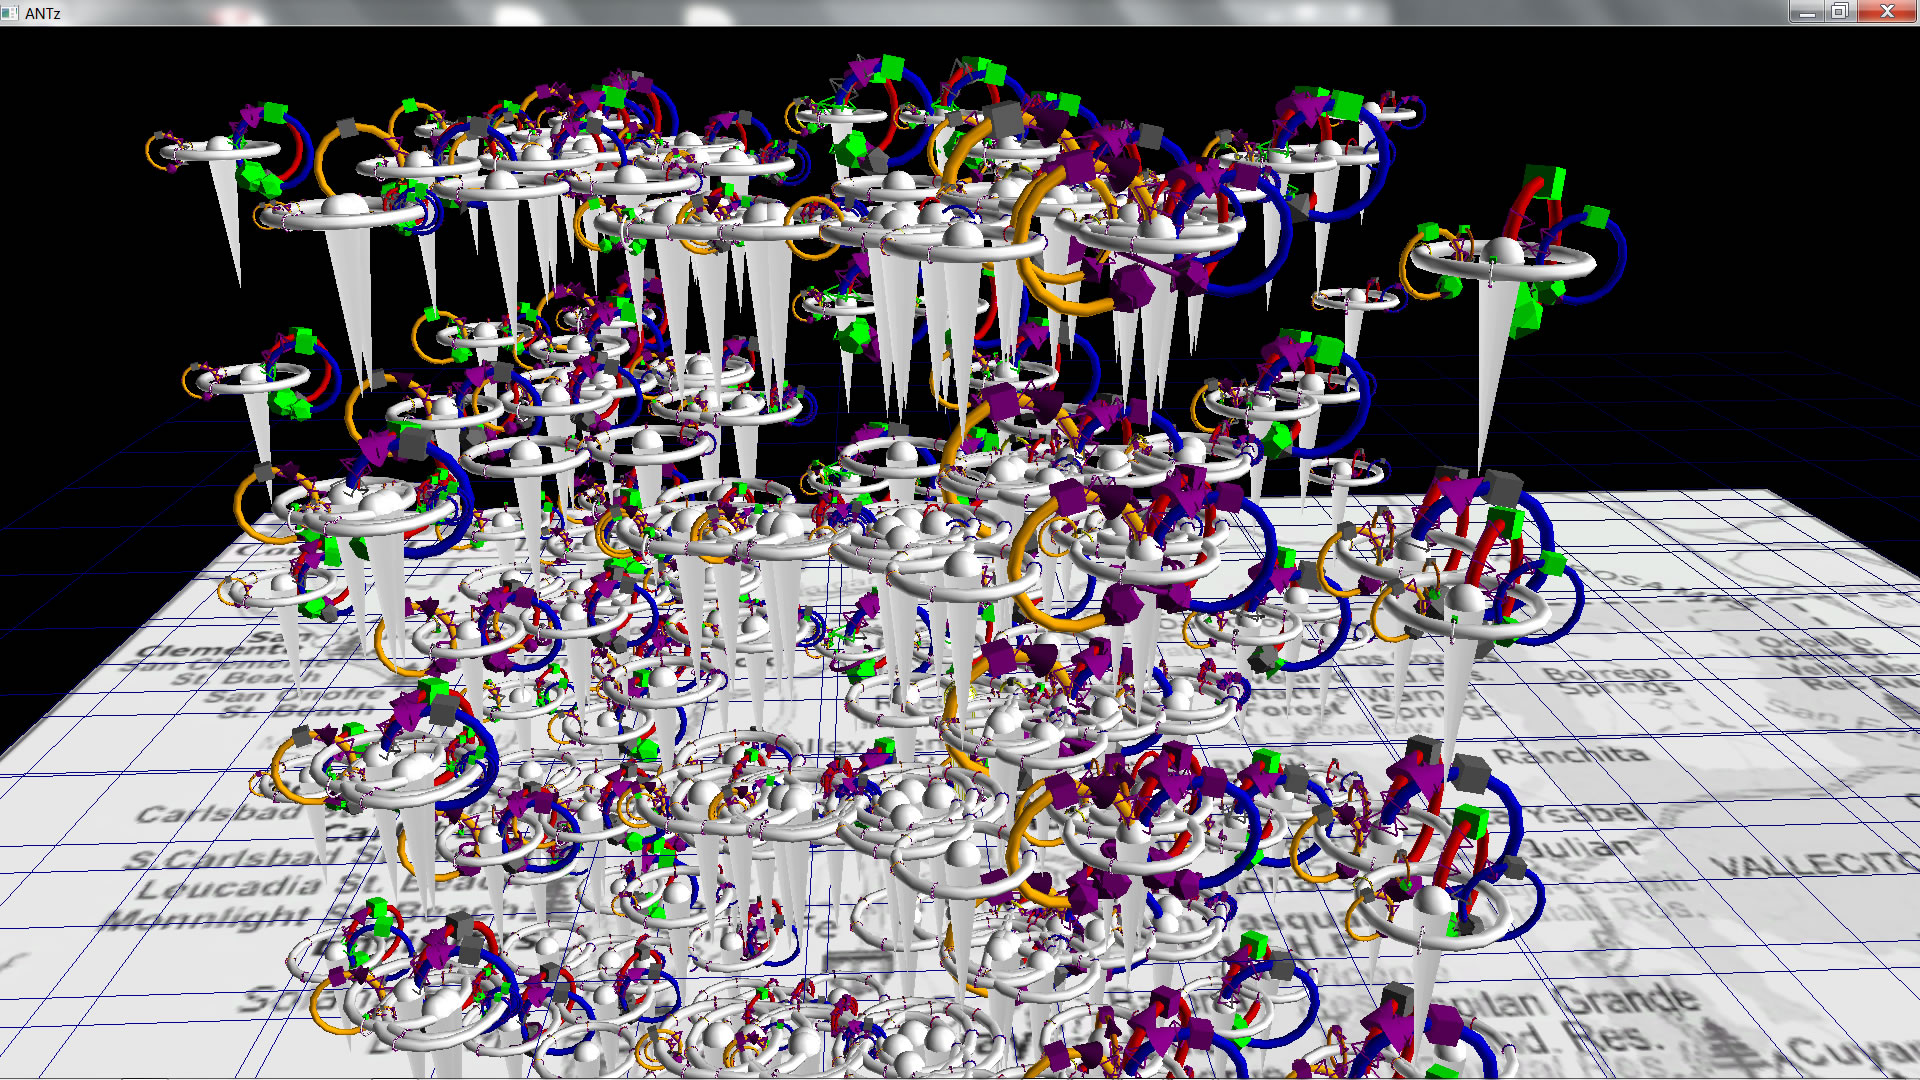
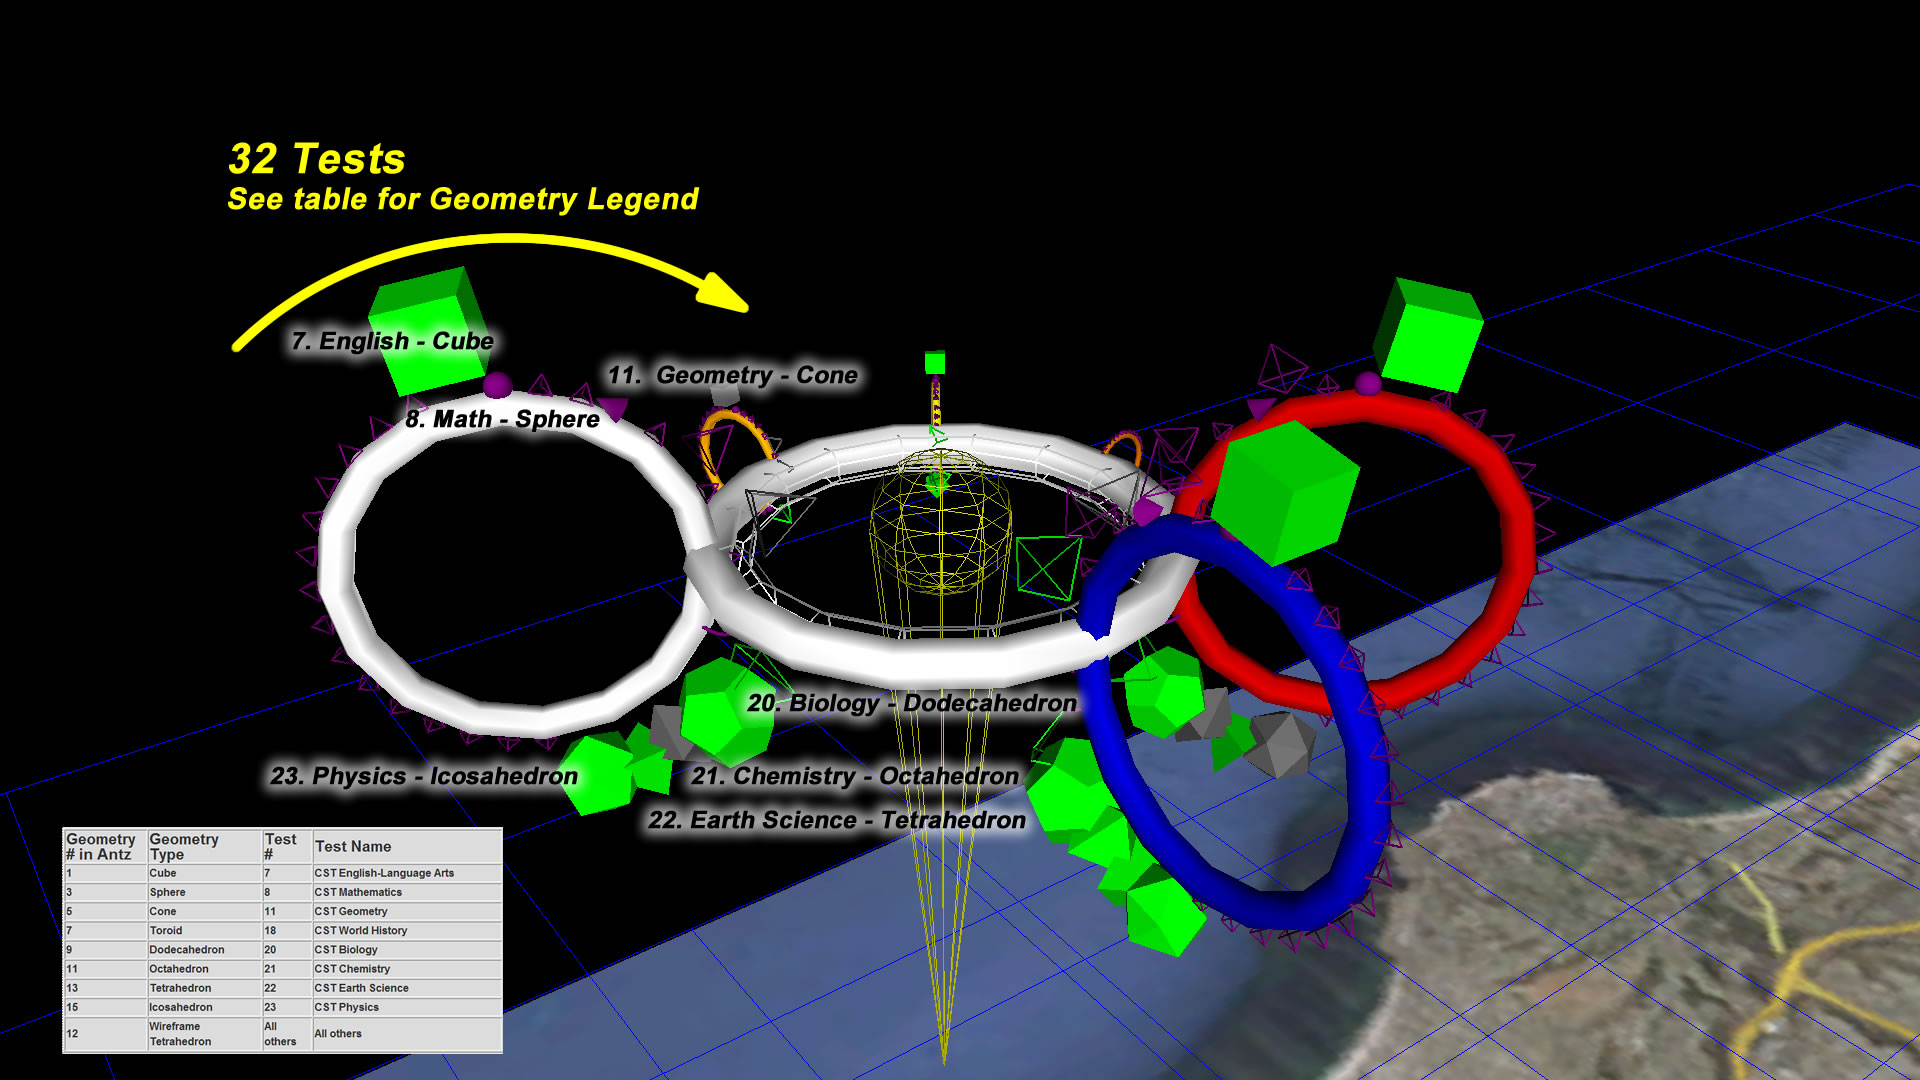
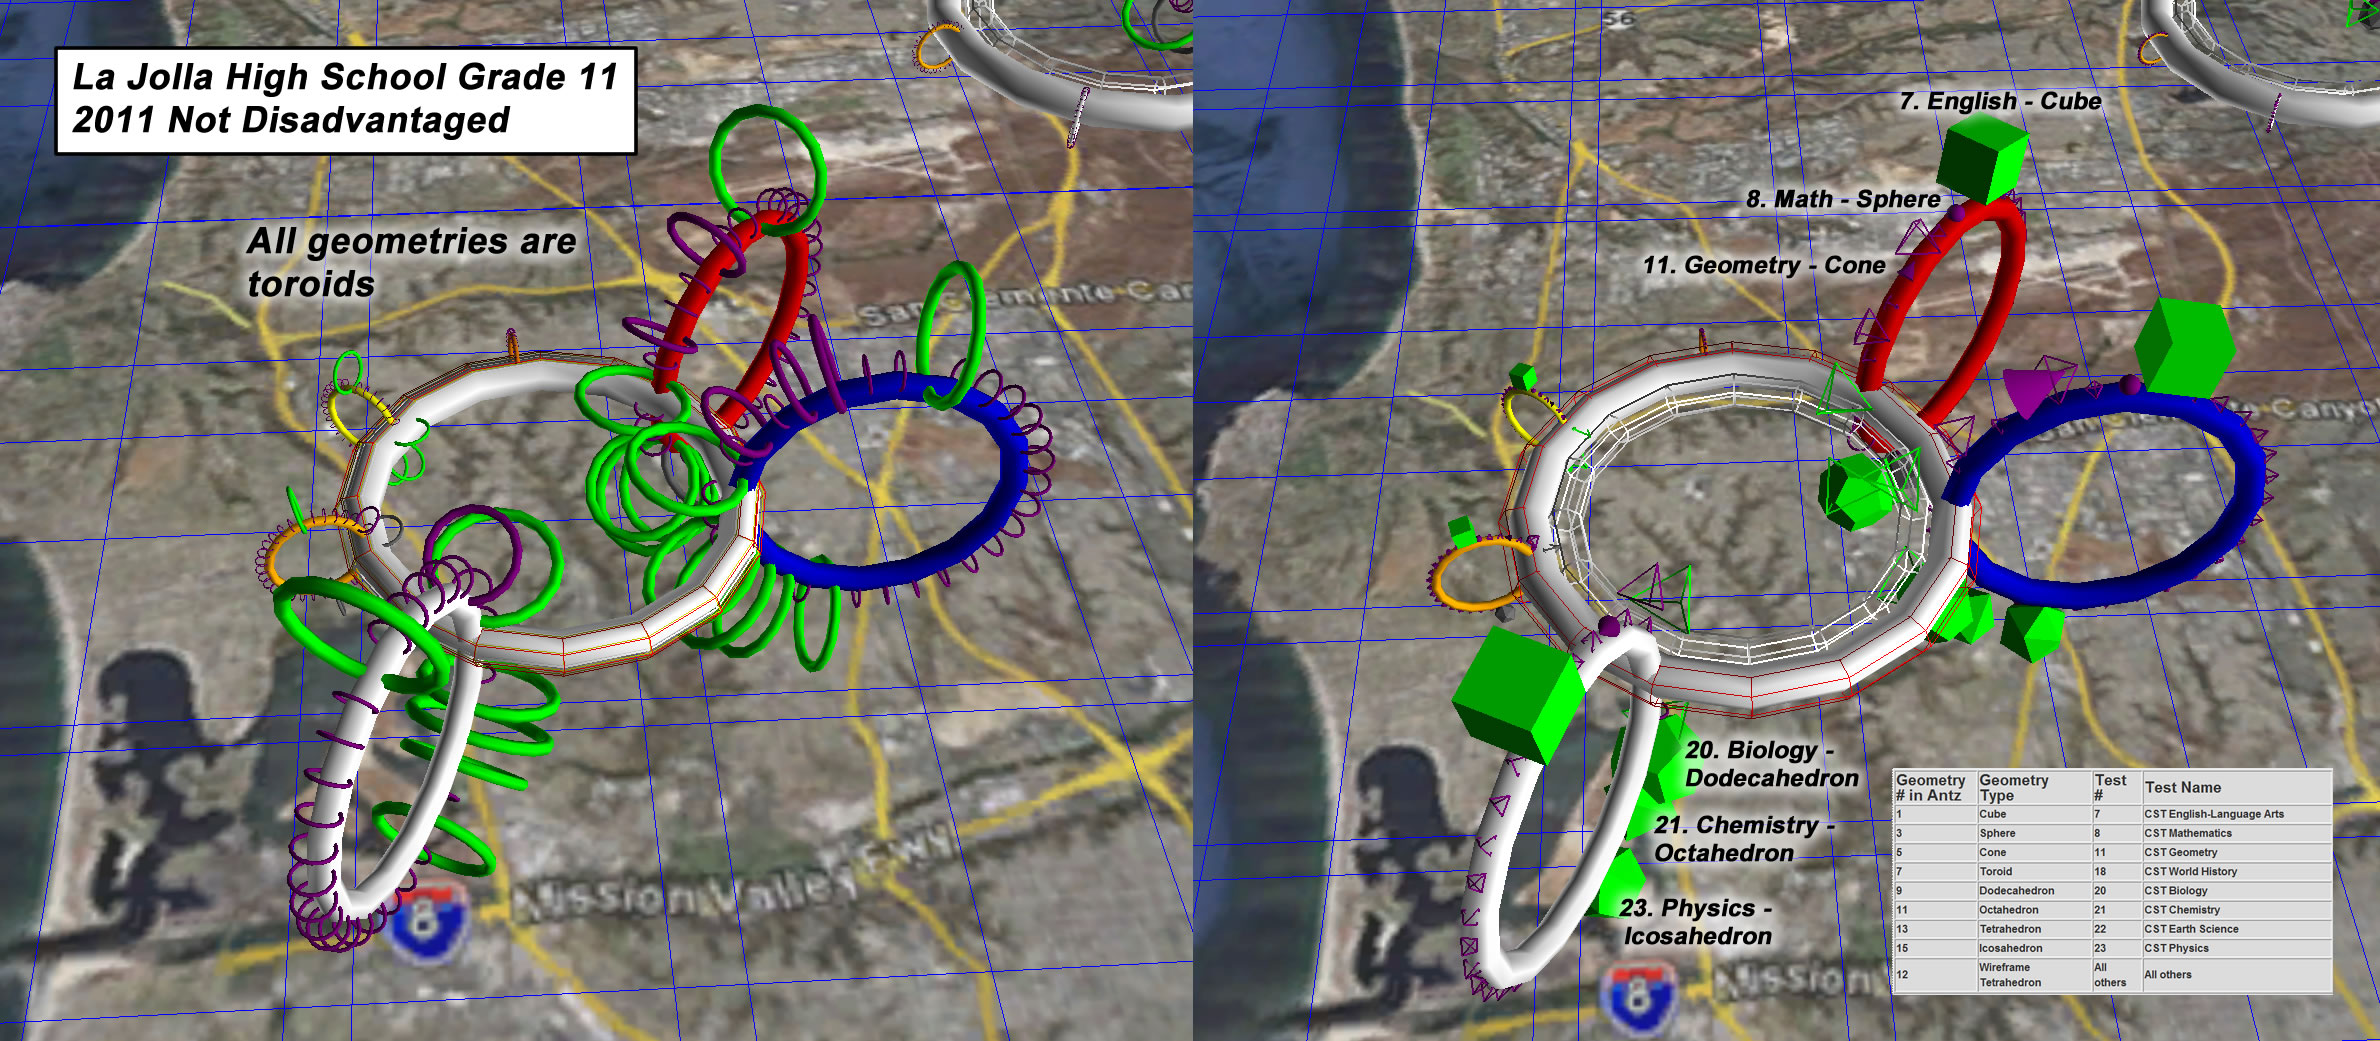
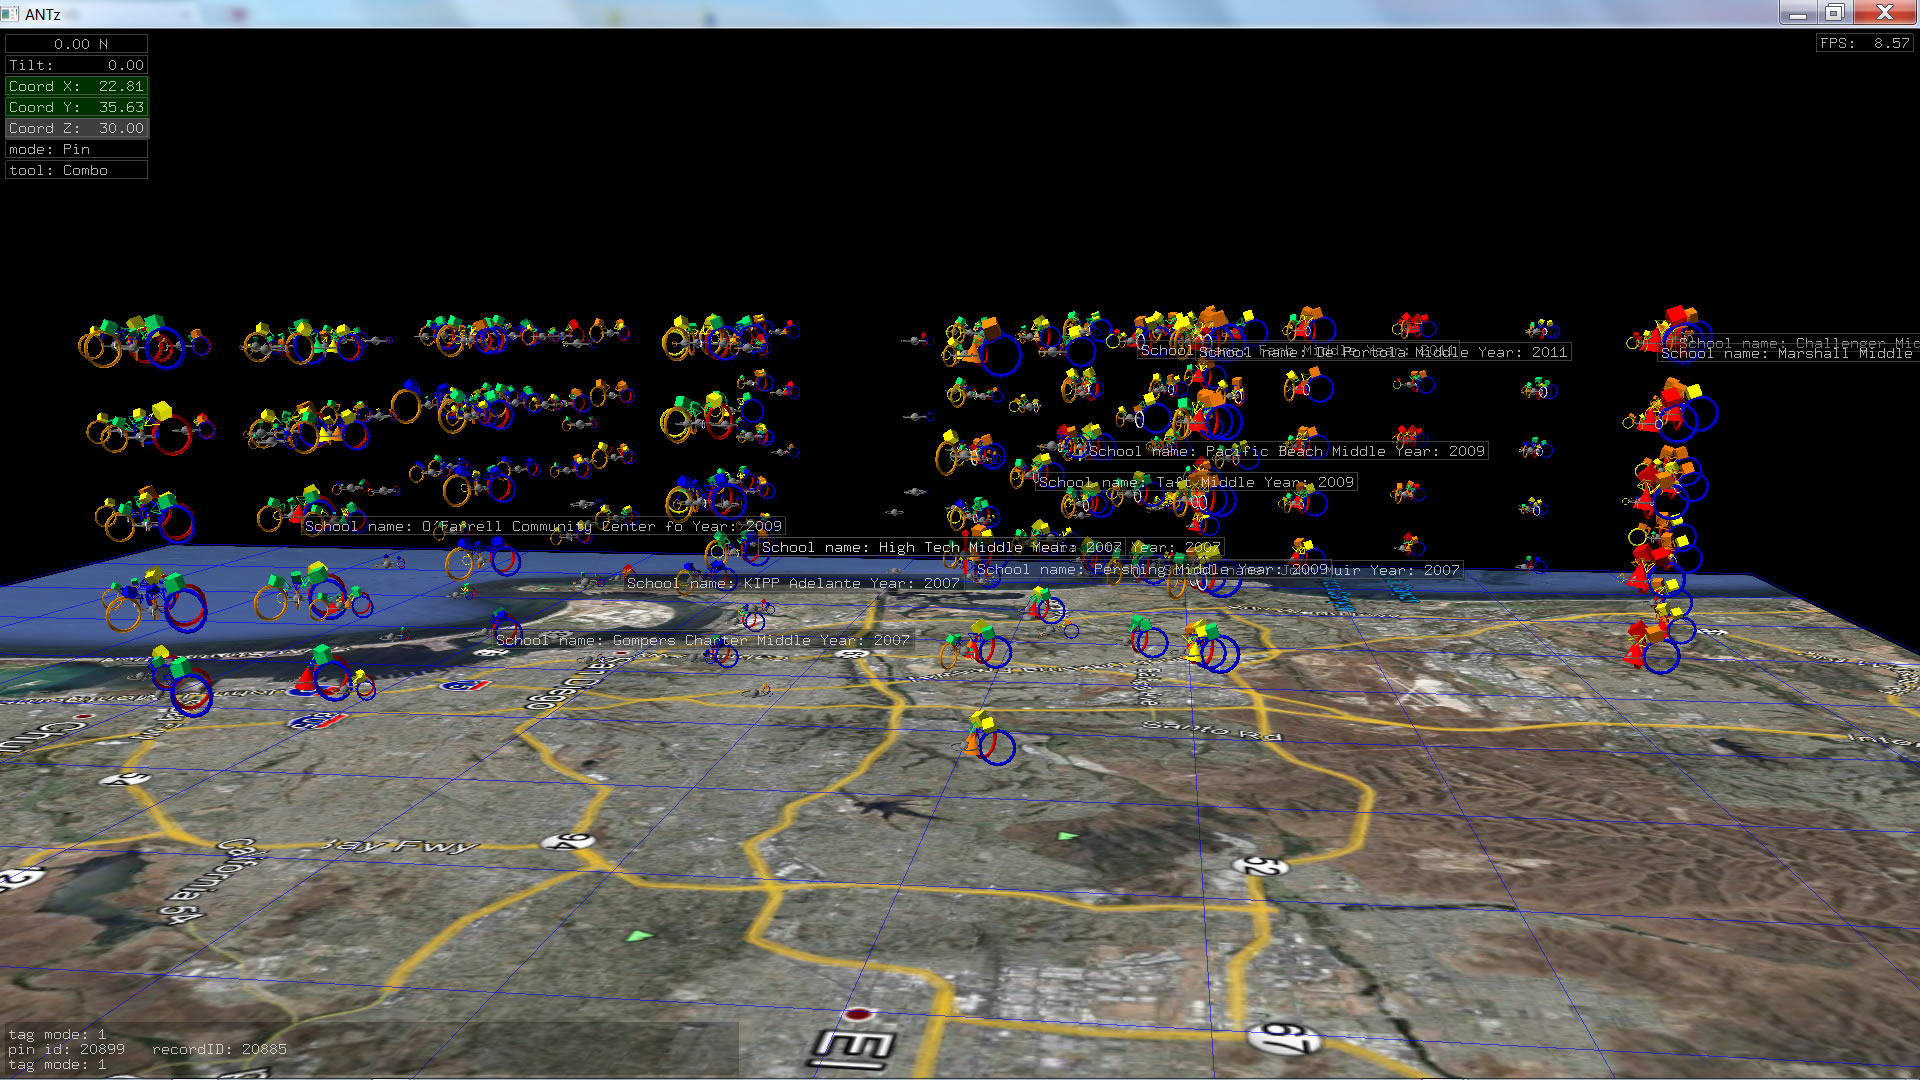
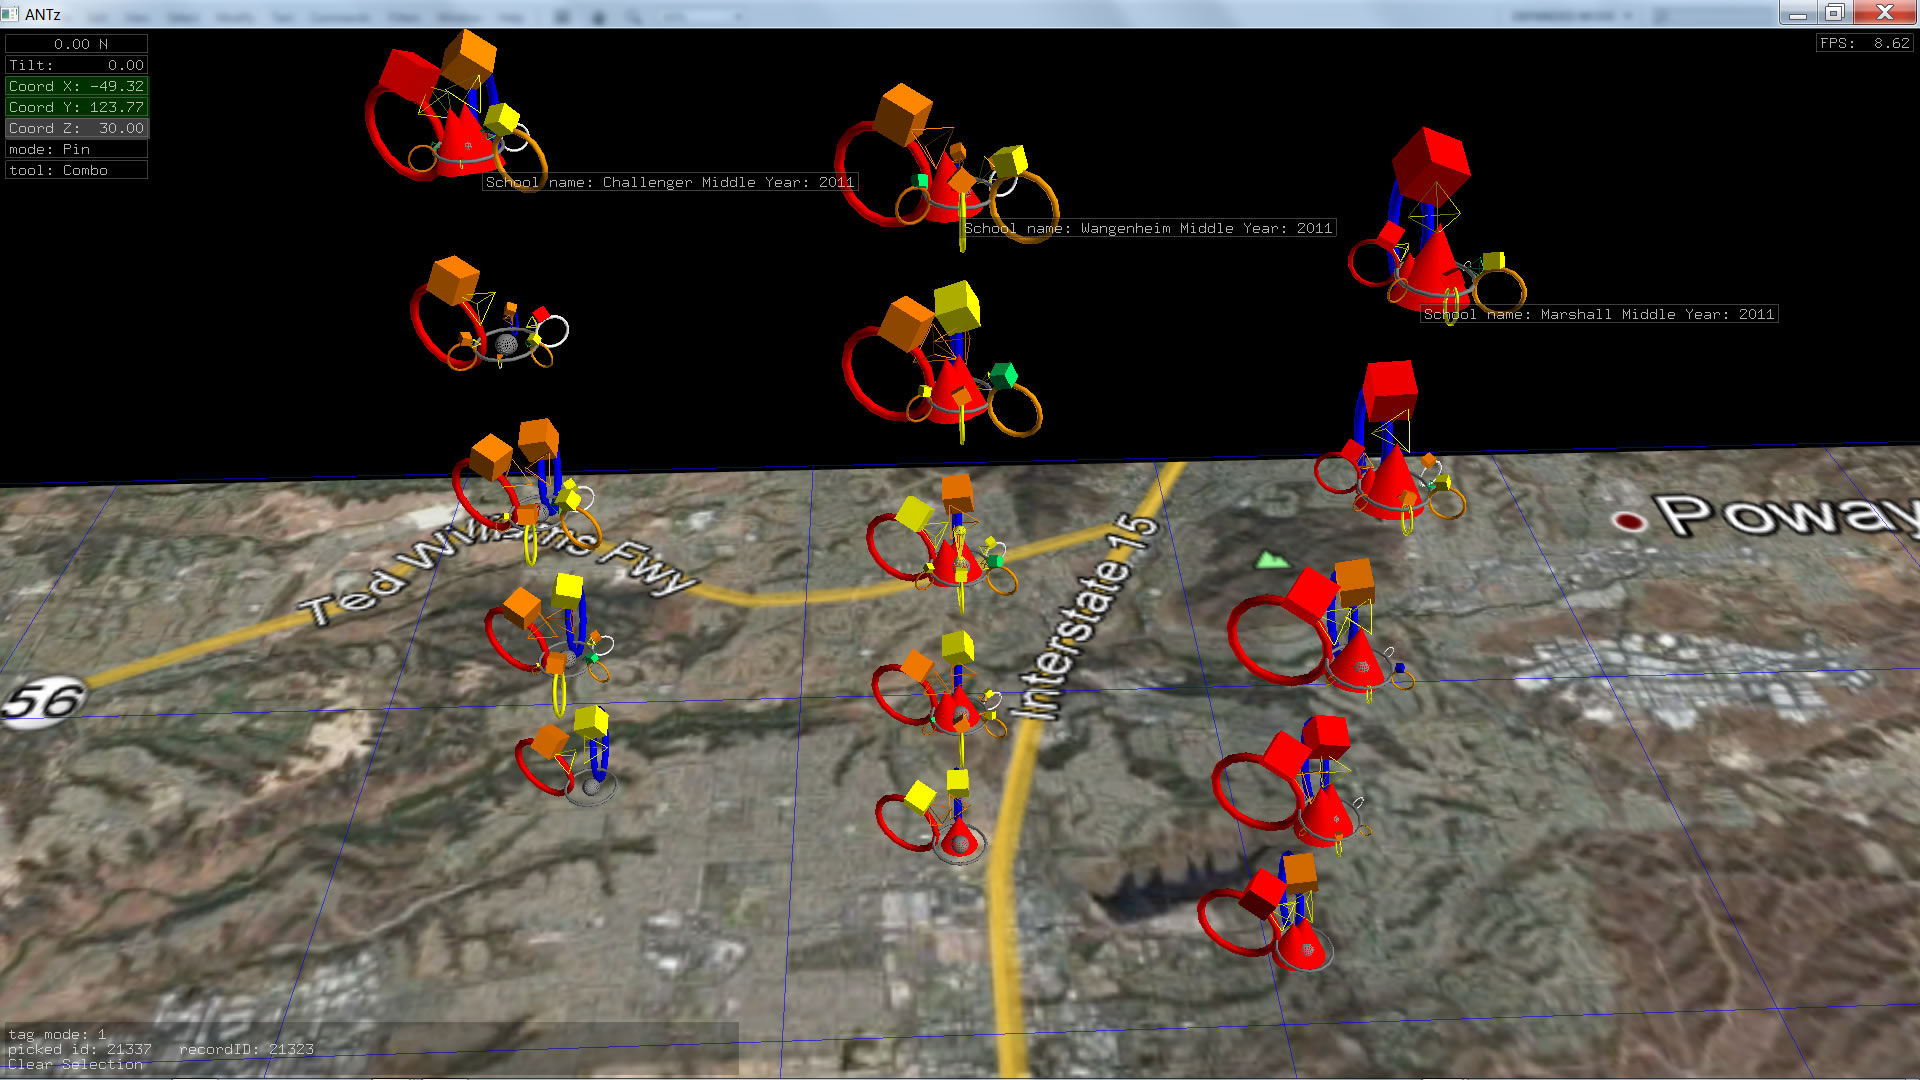
In the images below, instead of toroids alone, we use different geometries to correspond to tests according to the table below.
Geometry - Test Correspondence
Geometry # in Antz |
Geometry Type |
Test # |
Test Name |
1 |
Cube |
7 |
CST English-Language Arts |
3 |
Sphere |
8 |
CST Mathematics |
5 |
Cone |
11 |
CST Geometry |
7 |
Toroid |
18 |
CST World History |
9 |
Dodecahedron |
20 |
CST Biology |
11 |
Octahedron |
21 |
CST Chemistry |
13 |
Tetrahedron |
22 |
CST Earth Science |
15 |
Icosahedron |
23 |
CST Physics |
12 |
Wireframe Tetrahedron |
All others |
All others |
We can easily identify which geometries correspond to which tests in the image below. However, there are still issues with this particular visualization. Our selection of which geometry solids correspond with which tests could use some modification. The scale of some geometries might be obscuring other geometries. With a more interactive interface we could proceed to refine our visualizaiton in real time and drill down to find more subtle features.
Still, some noteworthy features include:
1) English Arts scores (cube) appear to be comparatively higher around the periphery of the district, with lower scores dominating in the south central region.
2) Rarely if at all do boys score higher than girls in english, often it is girls who score higher.
3) Geometry scores (cone) are overall very low, with no obvious exceptions*. This is where improved querying and interactivity would significantly improve clarification of these uncertainties.
4) History (toroid) was not tested at many schools.
5) There are numerous comparatively large wireframe tetrahedra, suggesting we should include those tests in our choice of geometric solids.
*Since mastery of geometry appears to be in question for SDUSD students, an alternative method of differentiation may be more appropriate, such as using textures rather than geometries. Antz recently added support for textures. We are working on a demonstration of this feature, to be done soon)
Old Version (for reference only)
Single Year for Grade 8
Grade 8, 2007, rotation enabled, geometry mode, disadvantaged.
Grade 8, 2008, rotation enabled, geometry mode, disadvantaged.
Grade 8, 2009, rotation enabled, geometry mode, disadvantaged.
Grade 8, 2010, rotation enabled, geometry mode, disadvantaged.
Grade 8, 2011, rotation enabled, geometry mode, disadvantaged.
Grade 8 All Years, rotation enabled, geometry mode, disadvantaged.
Grade 8 All Years, rotation enabled, geometry mode, NOT disadvantaged.