What You Need to Prepare for this Tutorial
It is important to get your 'hands dirty' with some practical experience. To do this, we need to select an application which supports many of the features of hyperglyphs discussed during the introduction. Many 3D modeling and animation programs support parent-child object relationships. You can create complex hyperglyph designs with tools such as Blender, 3D Studio Max, Maya, or Unity. For this tutorial we will be using an open source 3D visualization tool called ANTz. So before we can build some hyperglyphs we will need to learn a little about ANTz.
Coding Tool
Also, you will need a way to write code to read data in and generate a hyperglyph node and tag output file automatically. Step 1 addresses this below. I have provided examples in Python, C, and PHP. If you have an IDE for one of these languages then you are good to go. If you write code in some other language, like Java, for example, the C code is similar enough that you should be able to adapt it with minimal effort.
ANTz Visualization Tool
You will also need a version of the ANTz hyperglyph visualization tool. Currently the Windows and OS X versions are the only versions with full functionality. The ANTz developers are working on a Linux version for CentOS. Step 2 addresses this below.
A Mouse
You really need a mouse to be able to use the full navigational and creative features of ANTz. If you do not have a mouse, you still have options. We will provide details in 'Step 5: Navigating the Space' below.
At this point you should be able to create hyperglyph visualizations. My usual workflow is:
- Run code to read data and output node and tag files, antz0001node.csv and antz0001tag.csv.
- Run ANTz executable.
- Hit the '1' key to load the node and tag files.
- Use screen capture software to capture relevant images and video.
Step 1: Install Software for Code Development
If you want to use Python to generate ANTz CSV files, I recommend installing Anaconda and using Spyder for Python coding and Jupyter Notebooks for sharing and instruction.
If you want to use C, download and install Visual Studio 2013. It is free and it is the most recent version of Visual Studio which can be used to develop using the ANTz source code.
If you want to use PHP to create forms for others to access, and you don't have access to an Apache server and PHP for development, download and install a LAMPP (Linux, Apache, MySQL, Perl, PHP) application such as XAMPP or WAMP or MAMP and run an Apache server locally for development.
Step 2: Download ANTz
You can download ANTz, including the source, with the link below.
Download the latest version of ANTz for Windows
Download the latest (compact) version of ANTz for Mac OS X (12 Mb)
Download the full version of ANTz for Mac OS X (122 Mb)
ANTz is developed for Windows, OS X, and Linux, but only the Windows and Mac OS X versions have been updated to the most recent version. The application is currently under active development and we are seeking funding for the developers to update all versions. We apologize to Linux users. This will not impact this tutorial for Windows or OS X users.
Step 3: Run ANTz
Once you have downloaded ANTz and extracted the contents of the zip, open the folder and double-click the antz.exe executable. for Windows or the antz standalone executable for Mac OS X. This will launch ANTz. You can run multiple instances of the ANTz executable making it possible to open multiple datasets and compare them side-by-side.
The default ANTz world consists of a simple blue grid representing the world cartesian coordinate system with values for the X axis of -180 to 180 and values for the y-axis from -90 to 90, with grid lines every 30 degrees.
Step 4: Load a File
The simplest way to open an ANTz file is to hit the '1' key. This loads the default ANTz 'node' file, antz0001node.csv located in the usr/csv/ folder. Also loaded is the ANTz 'tag' file containing metadata displayed when an object is selected and you hit the 'i' key. By default, ANTz loads a simple file containing a multi-level hyperglyph created by the developer of ANTz, Shane Saxon. The objects which make up this glyph include a useful feature of opening external documents and web urls by selecting them and hitting the 'u' key. Try this with one of the objects. Note that one of the links opens my own web page for ANTz visualizations at https://www.iluvdata.org/antz/toroids/.
ANTz includes additional demonstration files. Hit keys 2, 3, 5 (ANTz Directory Viz), 6 (GitViz), or 7 to see other examples. Key 7 in particular generates thousands of hyperglyphs, allowing you to test your frame rate and use the following tips to navigate the space.
Step 5: Navigating the Space
ANTz supports a type of interactivity not typically found in visualization apps. Here are a few suggestions for navigating the 3D space efficiently.
To Improve Performance, Press Backslash to Downsample
In the upper right corner the frame rate is displayed. Use this as a guide to performance. Anything above 5 seems manageable for getting things done. However, when you are trying to visualize massive amounts of data (which is why we're doing this in the first place), the frame rate can drop below 1 frame per second productivity can bog down. It can be very helpful to reduce the polygon count to improve frame rate while still being able to visualize a significant number of objects. To do this, hit the "\" (backslash) key to cut the number of objects in half. Repeated presses continue to downsample. To upsample and restore objects, hit Shift-\.
Click an Object to Move to That Location
The fastest way to move from one location to another is to click and select an object. The ANTz icamera immediately jumps to view that object. If the objects are too far away, use the "Select Region" option to display their tags (select a rectangular region containing the objects and hit the "I" key to display their tags, then select the tag).
If you right-click and drag the mouse, the mode changes to Camera view and you will begin to move forward/backward/left/right. However, if there is a low frame rate then the camera movement can be very slow.
Use the "TAB" Key to Jump From One Branch Level Object to Another
The "TAB" key can be useful for stepping through a dataset if you have selected a Branch Level 0 object. It is also useful to step through all objects in a specific branch level.
Use the Up and Down Arrows to Move Up and Down Branch Levels
When working with a specific glyph, you can step up or down a branch level with the up or down arrow keys.
If You Do NOT Have a Mouse
Navigation without a mouse is possible and for the most part intuitive except for zooming in and out on an object. Normally, with a mouse, you will hold down both the left and right mouse buttons and drag forward/backward to zoom in/out. To zoom without a mouse, first select an object on which to zoom.. Then hit the 'C' key to enter 'Camera' mode. Then press the 'Q' key to zoom in and the 'E' key to zoom out. Hold the Shift key down to zoom faster.
Step 6: Let's Learn About ANTz
ANTz is a visualization tool designed by Dr. Dave Warner (with a little input from myself and others over the years) and has been through a few development iterations over the years, the latest version of ANTz being developed by Shane Saxon. Previous iterations included Neatview.
About the Name
ANTz got its name from having been used initially for a researcher interested in trends in citation indices such as Scopus or Web of Science looking for trends in ant social behavior and the bigger picture of complex social behavior in other organisms including humans. It is not the best name for a viz tool when relying on search engines to find it. We like to consider this a test of the tool's popularity. There may come a turning point when our tool overtakes the movie for the #1 spot in a Google or what the heck, Bing, search result.
Understanding ANTz
ANTz uses the OpenGL 3D graphics libraries glut32 and freeglut. Thus it has a very simple GUI. It is designed to render large numbers of objects and retain decent interactive exploratory capabilities. It also uses a unique cell-like structure called a hyperglyph to support nested parent-child object relationships.
ANTz Geometries
ANTz uses a static collection of 20 geometric objects consisting of basic 3D primitives and Platonic solids and their wireframe versions.
Download Windows sample file containing ANTz geometries.
Download Mac OS X sample file containing ANTz geometries.
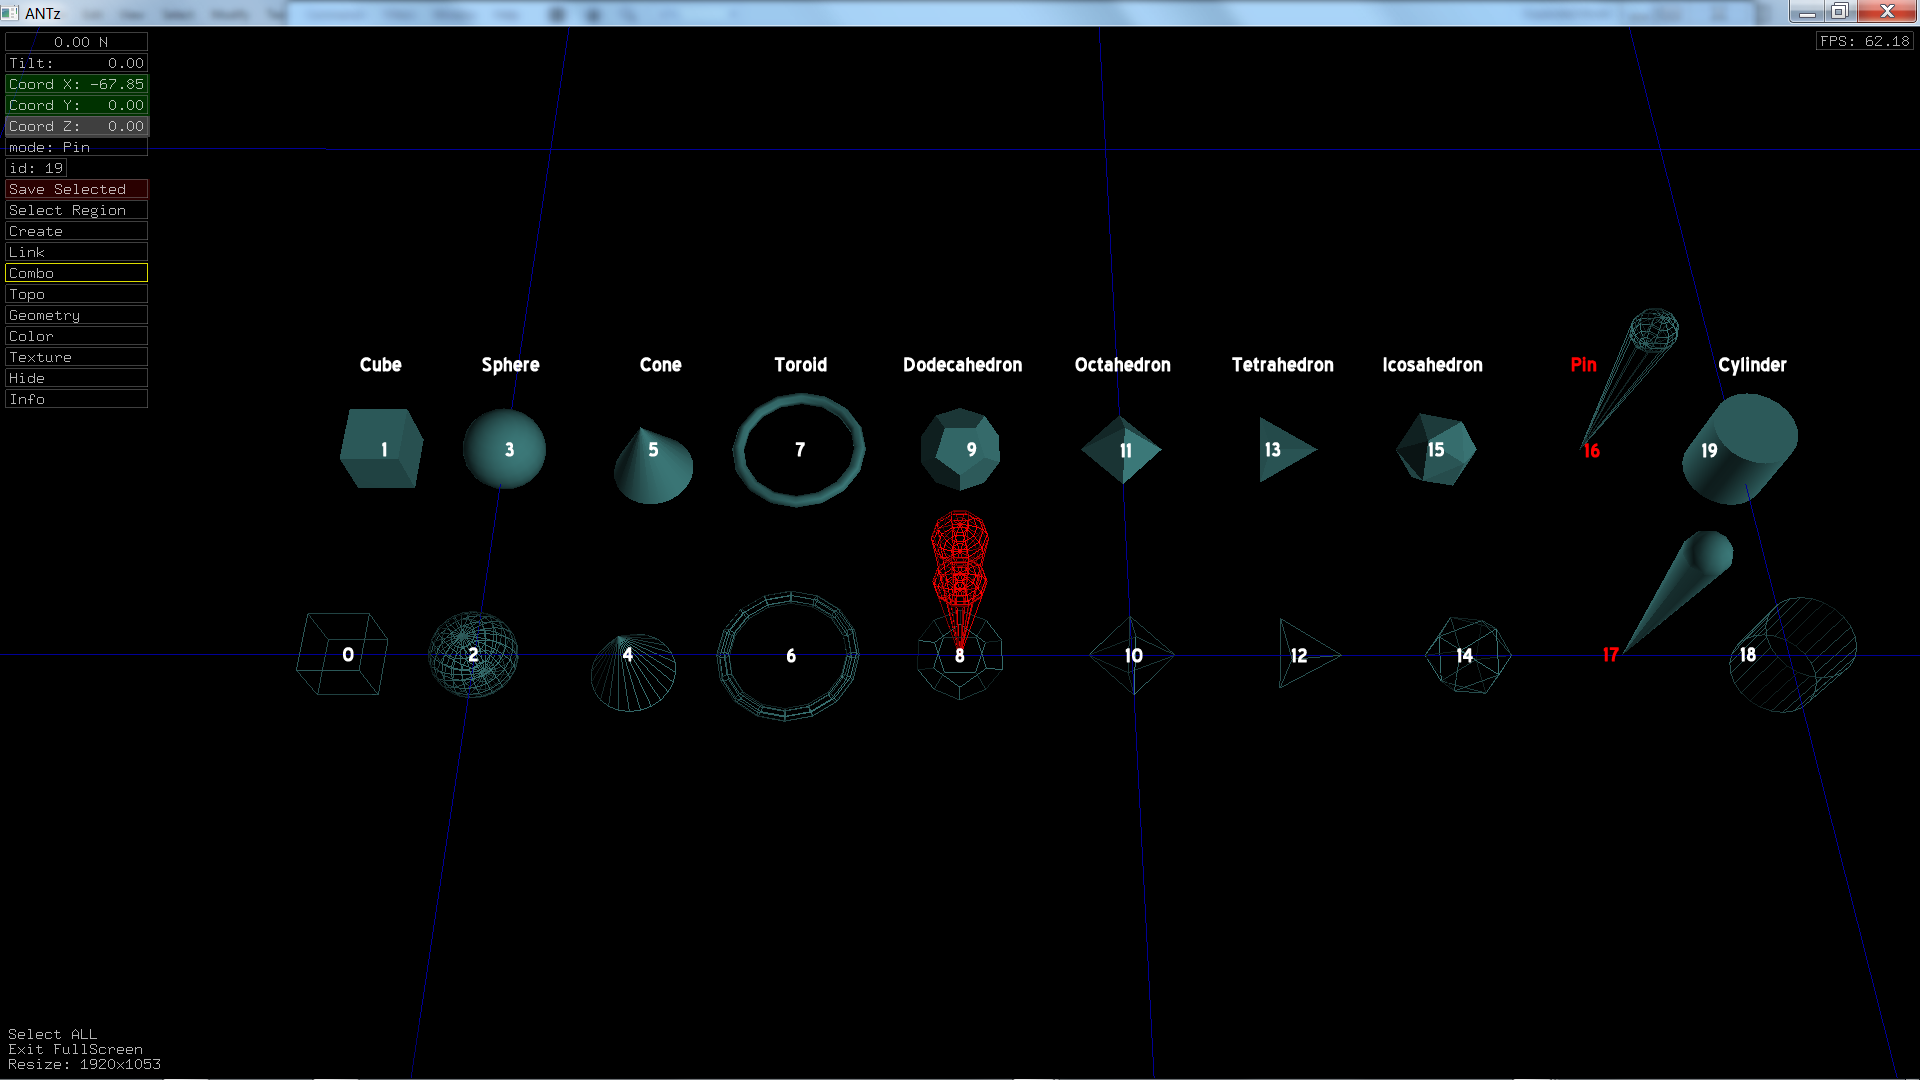
Here is a list of geometries and their corresponding geometry id number in ANTz. Note that for all geometries except the Pin, the solid is an odd number and the wireframe is an even number.*
| Ceometry | ANTz geometry id |
| Cube (wireframe) | 0 |
| Cube | 1 |
| Sphere (wireframe) | 2 |
| Sphere | 3 |
| Cone (wireframe) | 4 |
| Cone | 5 |
| Toroid (wireframe) | 6 |
| Toroid | 7 |
| Dodecahedron (wireframe) | 8 |
| Dodecahedron | 9 |
| Octahedron (wireframe) | 10 |
| Octahedron | 11 |
| Tetrahedron (wireframe) | 12 |
| Tetrahedron | 13 |
| Icosahedron (wireframe) | 14 |
| Icosahedron | 15 |
| Pin | 16 |
| Pin (wireframe) | 17 |
| Cylinder (wireframe) | 18 |
| Cylinder | 19 |
*ANTz now supports 3D model import in multiple formats including .3ds, .stl, and .obj. However, we will not be demonstrating that in this tutorial.
ANTz Grids
When you first launch ANTz the only visible object is the default grid. Grids are different than other geometries. They are by default a Cartesian coordinate system based on the KML format of x values from -180 to 180, y values from -90 to 90. Techically grids do not display any default z values since the grid is a 2D object.
You can select grids with the "G" key. This puts you in "Grid" mode. When in Grid mode you can create additional grids with the "N" key. Give it a try. You can step through the grids by pressing "G" repeatedly.
About the ANTz Hyperglyph
ANTz uses the geometries to build a complex cell-like 3D geometric structure called a hyperglyph. The ANTz hyperglyph uses a parent-child relationship between geometries and supports up to 32 generations by default, depending on which version you are using. The latest version supports 28 by default, but this parameter can be modified in the source, kNPnodeChildMax. I have successfully increased it to 4560. It crashed at 5012, so the practical max is somewhere between those two numbers.
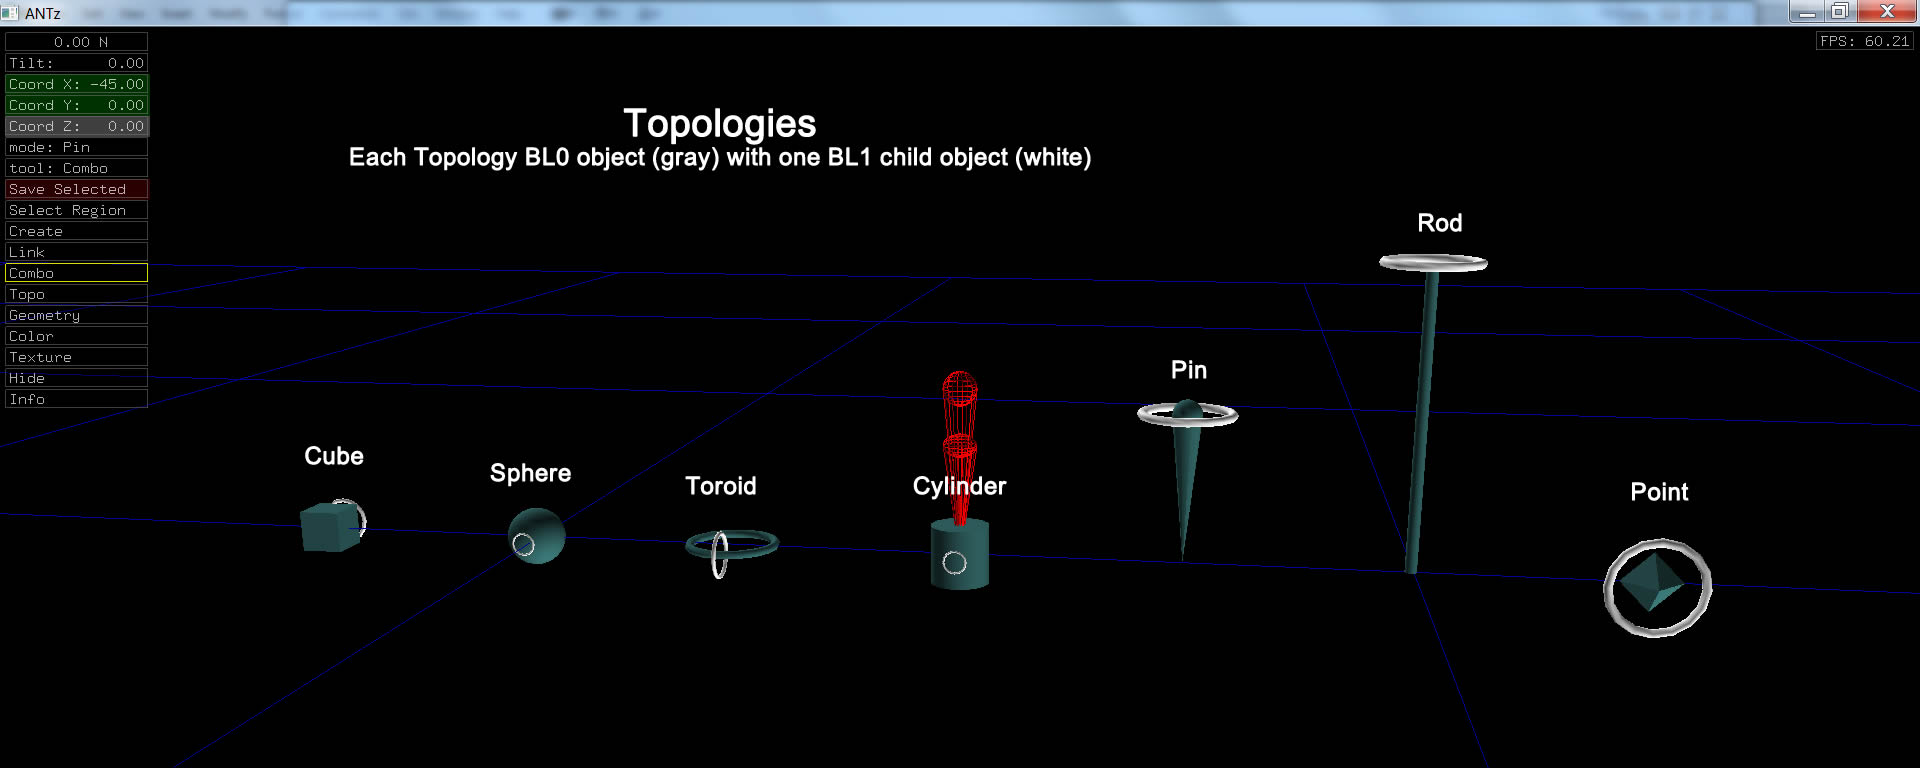
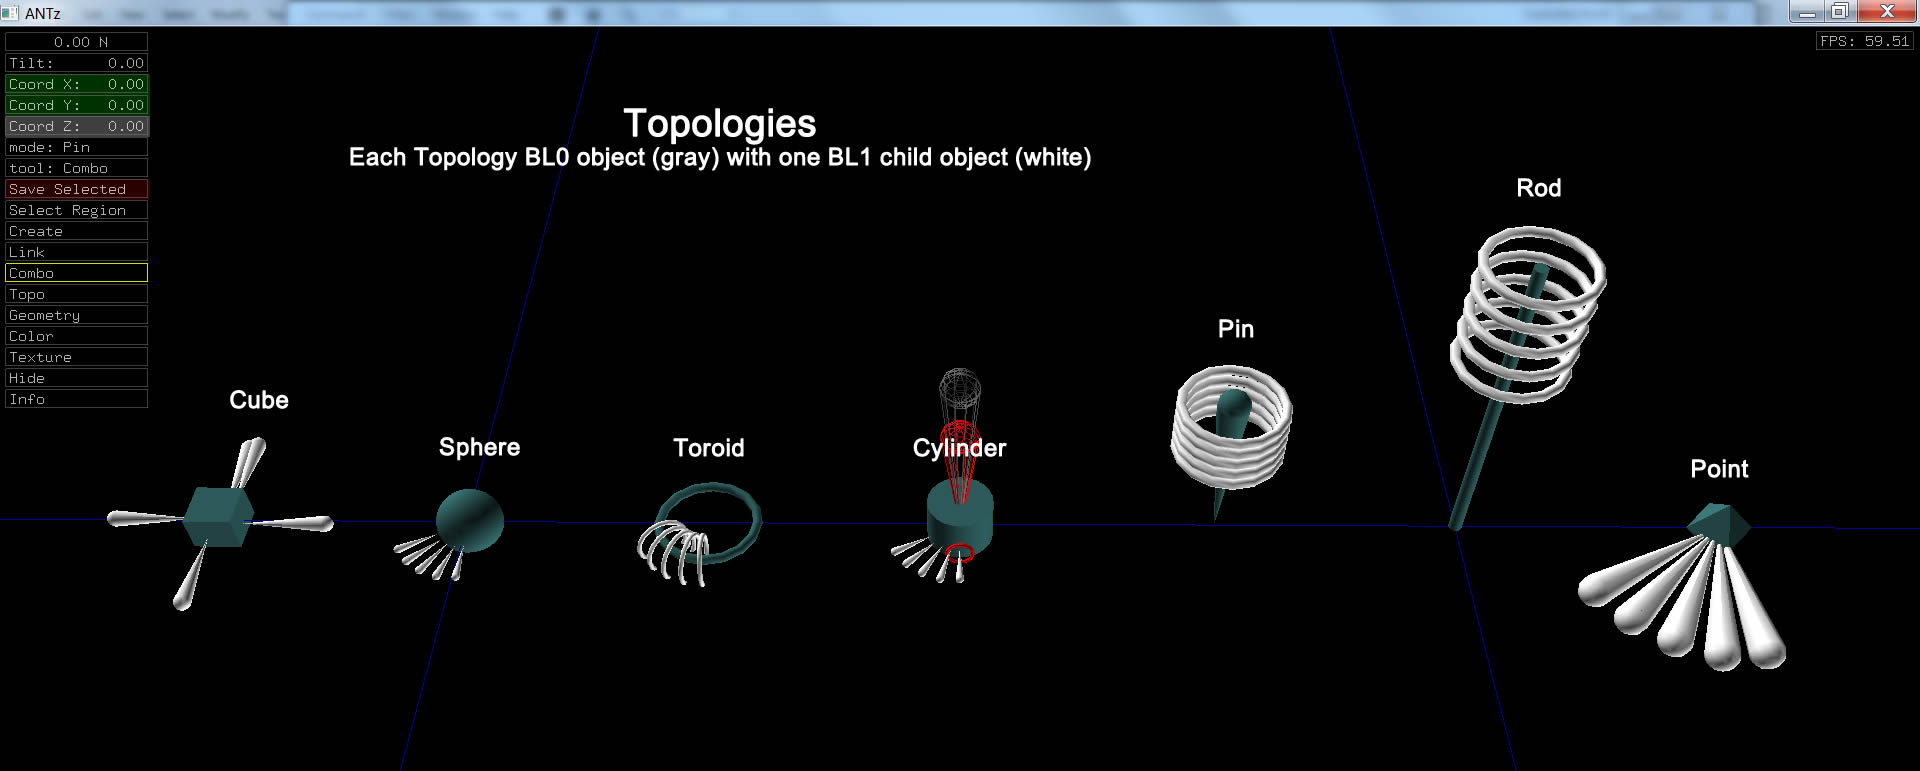
ANTz Topologies
ANTz uses a set of 12 'topologies' to provide a diverse but consistent set of coordinate systems which constrain how we can distribute objects around their parent. ANTz topologies use the Google Earth (formerly Keyhole) Keyhole Markup Language (KML) spatial coordinate system for all 7 topologies. This means by default objects are distributed in ANTz and around their parents using a longitude-latitude-elevation convention for x-y-z spatial distribution by default.
Topologies 1 through 8 represent the following:
- Cube
- Sphere
- Toroid
- Cylinder
- Pin
- Rod
- Point
- Grid
Topologies 9 through 12 are similar to topologies 1 through 4 but with the translate_z value located at the center of the geometry instead of the surface.
9. zCube
10. zSphere
11. zTorus
12. zCylinder
To better understand ANTz topologies, download either the Mac or Windows versions of a simple example below:
Download Windows sample file containing ANTz topologies with one parent and a single child.
Download Mac OS X sample file containing ANTz topologies with one parent and a single child.
Download Windows sample file containing ANTz topologies with one parent and a five children.
Download Mac OS X sample file containing ANTz topologies with one parent and a five children.
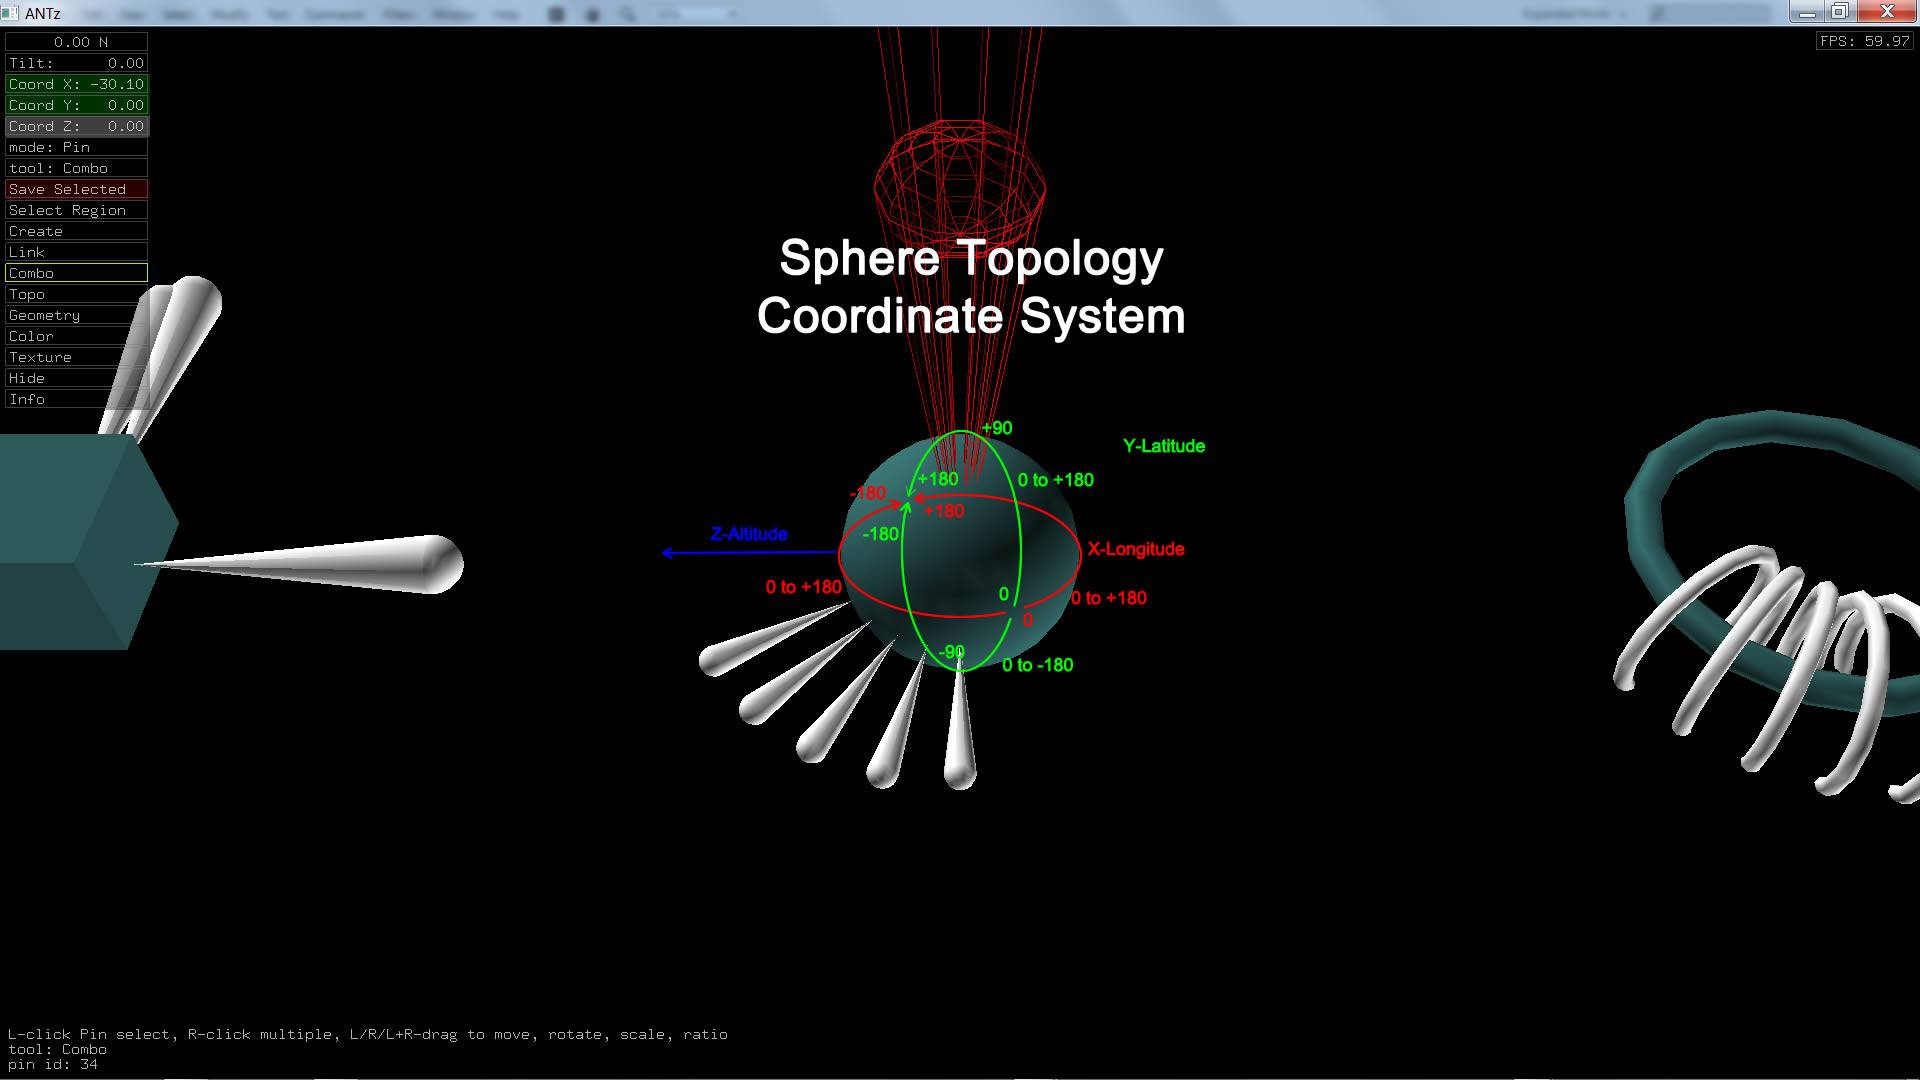
Basic Sphere Topology Coordinate System
The coordinate system for the sphere is the simplest example of how the KML format is used. Child objects translate_x, translate_y, and translate_z parameters correspond to longitude, latitude, and elevation respectively.
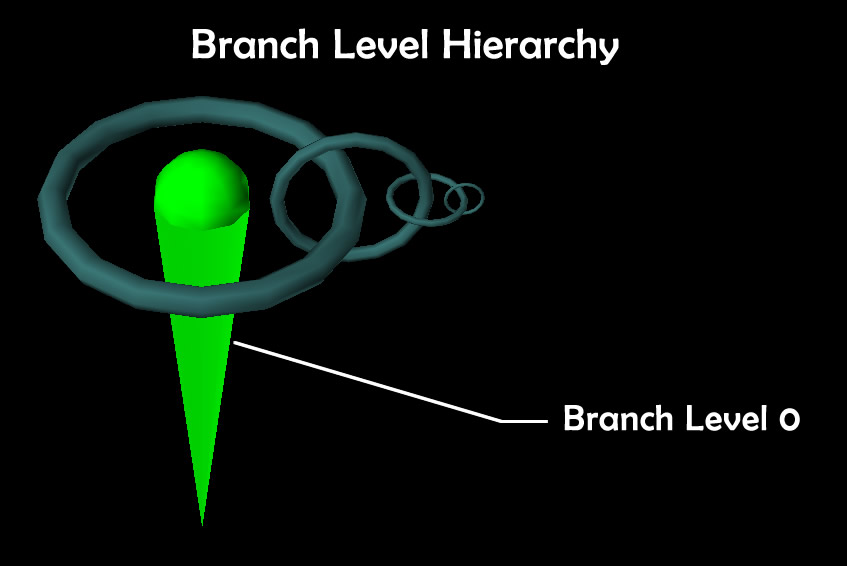
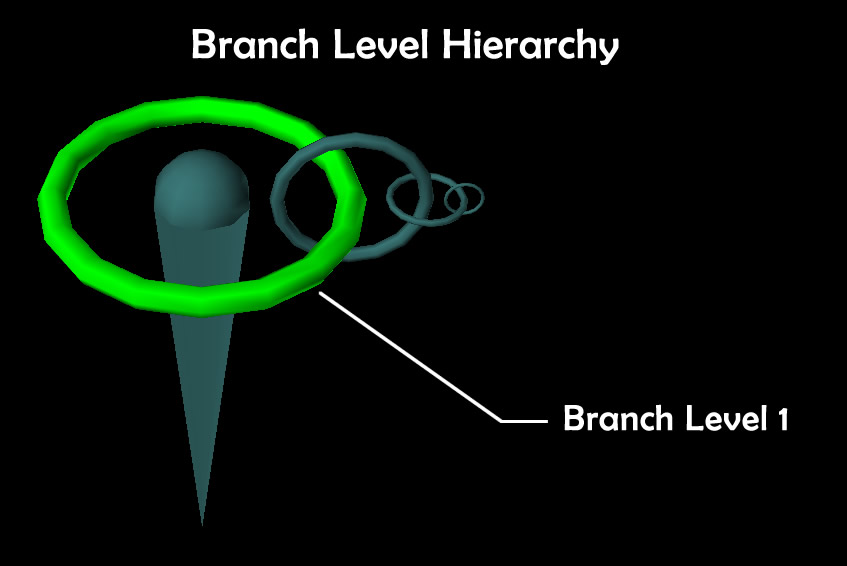
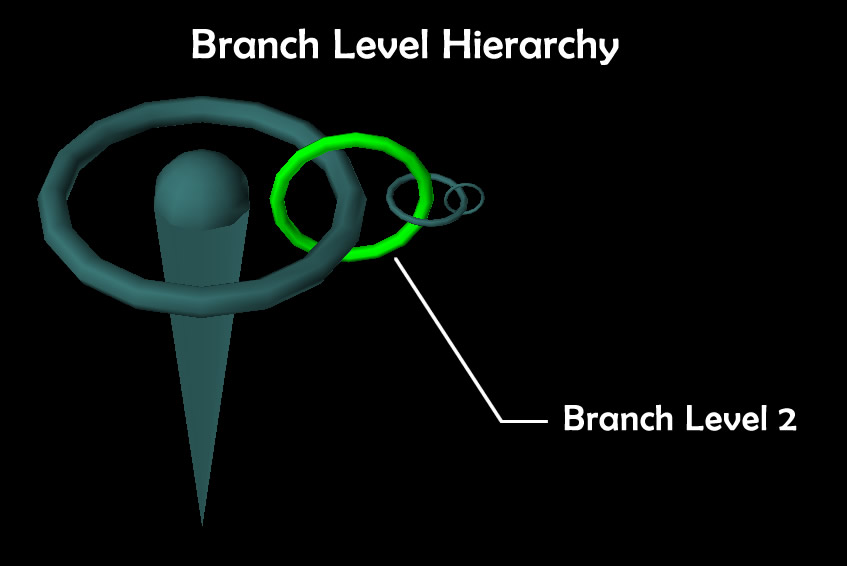
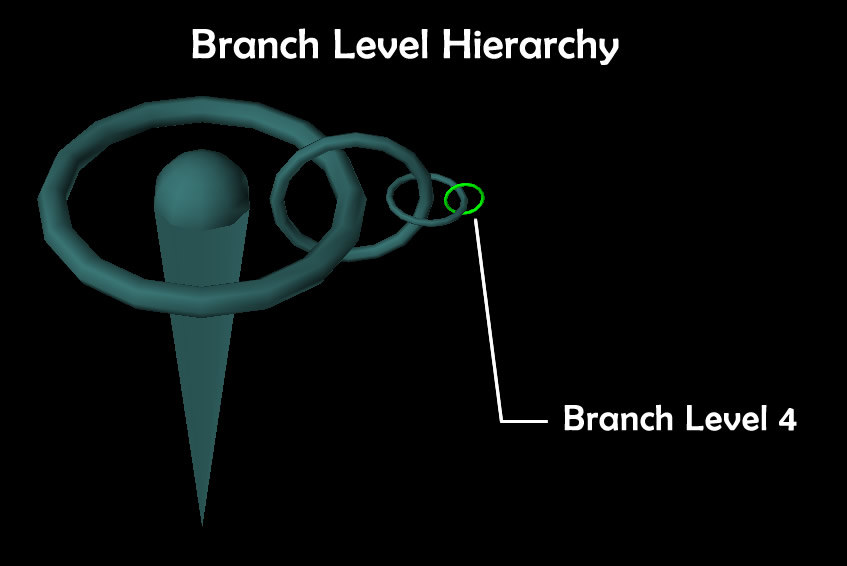
ANTz Branch Levels
ANTz supports up to 32 Branch Levels. Objects on one Branch Level are Parents to the objects on the Branch Level 'below' (above?) it. Below are examples of objects on Branch Levels 0 through 4.

How to use Branch Levels
If data is inherently categorical, especially in a nested hierarchical structure, consider multiple branch levels.
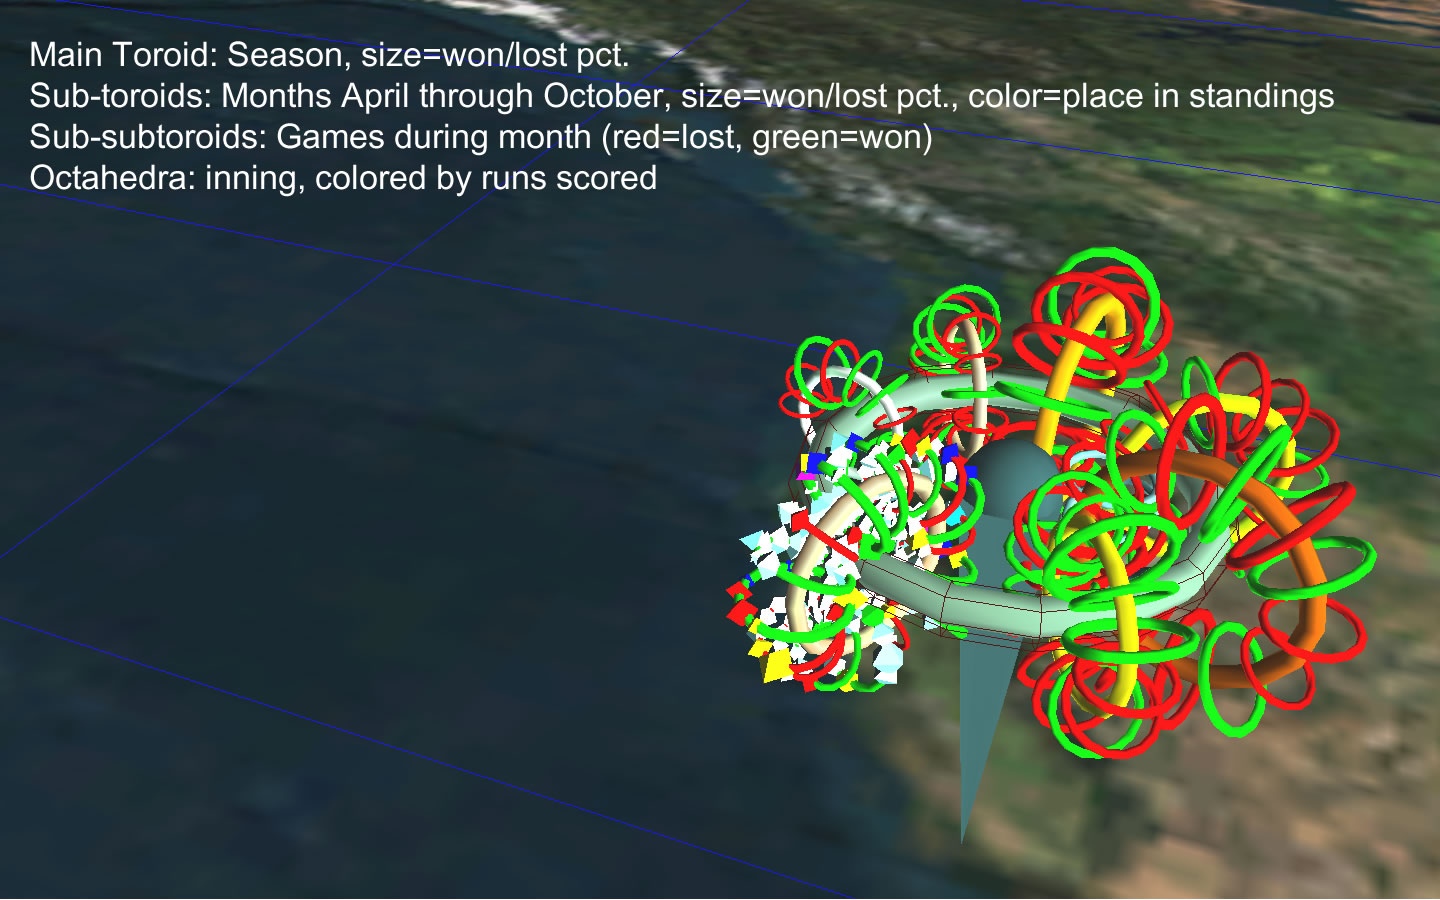
For example, one season of a baseball team can be divided into multiple levels in several different ways. I chose the following:
- Branch Level 0 & 1: central pin and binding toroid, references & label information
- Branch Level 2: “Month”,
- Size = won/lost pct.
- Color: position in standings
- Branch Level 3: “Game”
- Color: red=lost, green=won
- Branch Level 4: “Inning”
- Size = runs scored
- Color: runs scored
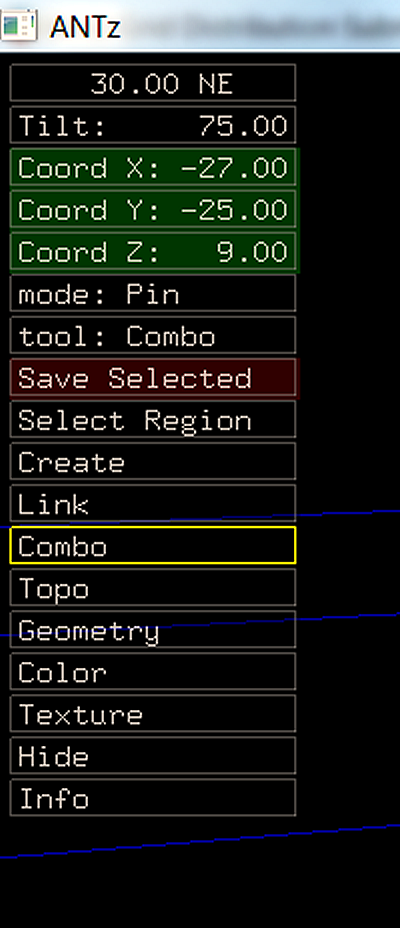
The ANTz Control Panel
ANTz uses a simple 2D control panel to modify objects in the space. This control panel is very limited. Do not expect anything like a standard GUI. This is probably the biggest limitation of the tool, and is the highest priority for improvement.
Given its limitations, you can still accomplish much by using the control panel effectively. The middle mouse scroll wheel scrolls quickly through the options. I use Move, Scale, and Rotate frequently and since they are not on the default panel list, I have become used to scrolling quickly to find them.
The ANTz CSV File Format Descriptions
ANTz currently uses four different CSV formats for input. However, ANTz will load any file if it conforms to the Node CSV file format. In fact, when you save an ANTz visualization by pressing the "K" key, the filename will contain a time stamp instead of the "0001". If you want to reload the file and its tags, you will need to rename it to "antz0001node.csv" and "antz0001tag.csv". This will be improved to accept any file name in a future release.
| File | Default Name | # Rows | # Columns | Description |
| Node State File | antz0001node.csv | Limited only by memory | 94 | Primary input file when the "1" key is pressed. It contains all data needed to render an ANTz visualization. |
| Tag/Label File | antz0001tag.csv | Limited by # of objects in Node State File | 5 | Contains text information to display when the I key is pressed in ANTz. Uses record_id as key parameter. |
| Channels File | antz0001ch.csv | Limited only by memory | 1000 by default, can be increased in source code | Contains data for animation playback when the P key is pressed. |
| Channel Map File | antz0001chmap.csv | Limited by number of channels in Channels File | 7 | Contains details to match channel with object and parameter to be animated. |
| Globals File | antzglobals.csv | 22 | 9 | Contains default settings for various global parameters including username and pwd for mysql, default window size, url for http queries, and more. |
The Single Most Important Step: Build a Prototype Glyph in ANTz Manually
When you have an idea for your glyph structure, prior to writing your code I recommend going through the process of creating a prototype of your glyph in ANTz, saving it (K key), and reverse-engineering the CSV to identify key values for parameters of interest such as geometry, topology, texture, translate, scale, rotate, type, parent, child, branch_level.
Tips for Writing Code to Output an ANTz CSV File
The process for working with code to generate ANTz is similar to most analytical programming tasks.
- Keep It Simple
- Keep your code simple at first. Output a small number of glyphs to validate your code structure.
- Modularize
- Use a modular approach, define and re-use functions.
- Iterate
I did most of my early work in PHP. I use xampp to host my own Apache localhost web server and MySQL database. I write my code in Dreamweaver and save my outputs in the usr/csv/ subfolder to the default ANTz CSV file ANTz0001.CSV. I save it, shuffle to Firefox, browse to the script, run it, shuffle to Windows, run antz.exe, hit 1 to load the output, shuffle back to Dreamweaver and iterate as needed.
For Python development, I have been using the Anaconda environment with Spyder for working with Python scripts and Jupyter Notebooks on occasion.
Supplemental Demonstration Datasets
Physiometric Data Integration and Animation
Lahman Baseball Database and NCAA Football
SDSC SmartGrid Energy Use Data (EBU3) (SDSC)
Global Database of Events, Language, and Tone
California STAR Test Score Data
Fukushima Nuclear Reactor Radiation Data
Principles of Neural Science DAG (download latest for Windows)
Bing Search Results (Why Bing and not Google? Google is too restrictive for large amounts of data)