In this lesson you become familiar with the most efficient method I have found for getting data into a hyperglyph format. The goal of this lesson is to familiarize you with how to write code to convert a tabular (row and column) dataset into the node file CSV format of ANTz.
Our Data: The Lahman Baseball Statistics Database
The source of our data for this visualization is the Lahman Baseball Statistics Database.
The database is available to freely download as either a MySQL database , MS Access database, or a CSV file. However, we will be working with a subset of the database in the form of a 9-column dataset specially prepared for this tutorial. We extracted just a few statistical parameters from the comprehensive database and output to a CSV format.
Download the batting statistics dataset in CSV format.
Download C code to convert the batting statistics dataset into the ANTz node CSV file format.
Download Python code to convert the batting statistics dataset into the ANTz node CSV file format.
The columns for the batting statistics dataset are defined below:
- Column 1: X coordinate representing player id sorted alphabetically
- Column 2: Y coordinate representing team on which player played, sorted alphabetically
- Column 3: Z coordinate representing year played, sorted by year
- Column 4: Player batting average
- Column 5: # of doubles
- Column 6: # of triples
- Column 7: # of home runs
- Column 8: runs batted in (RBI)
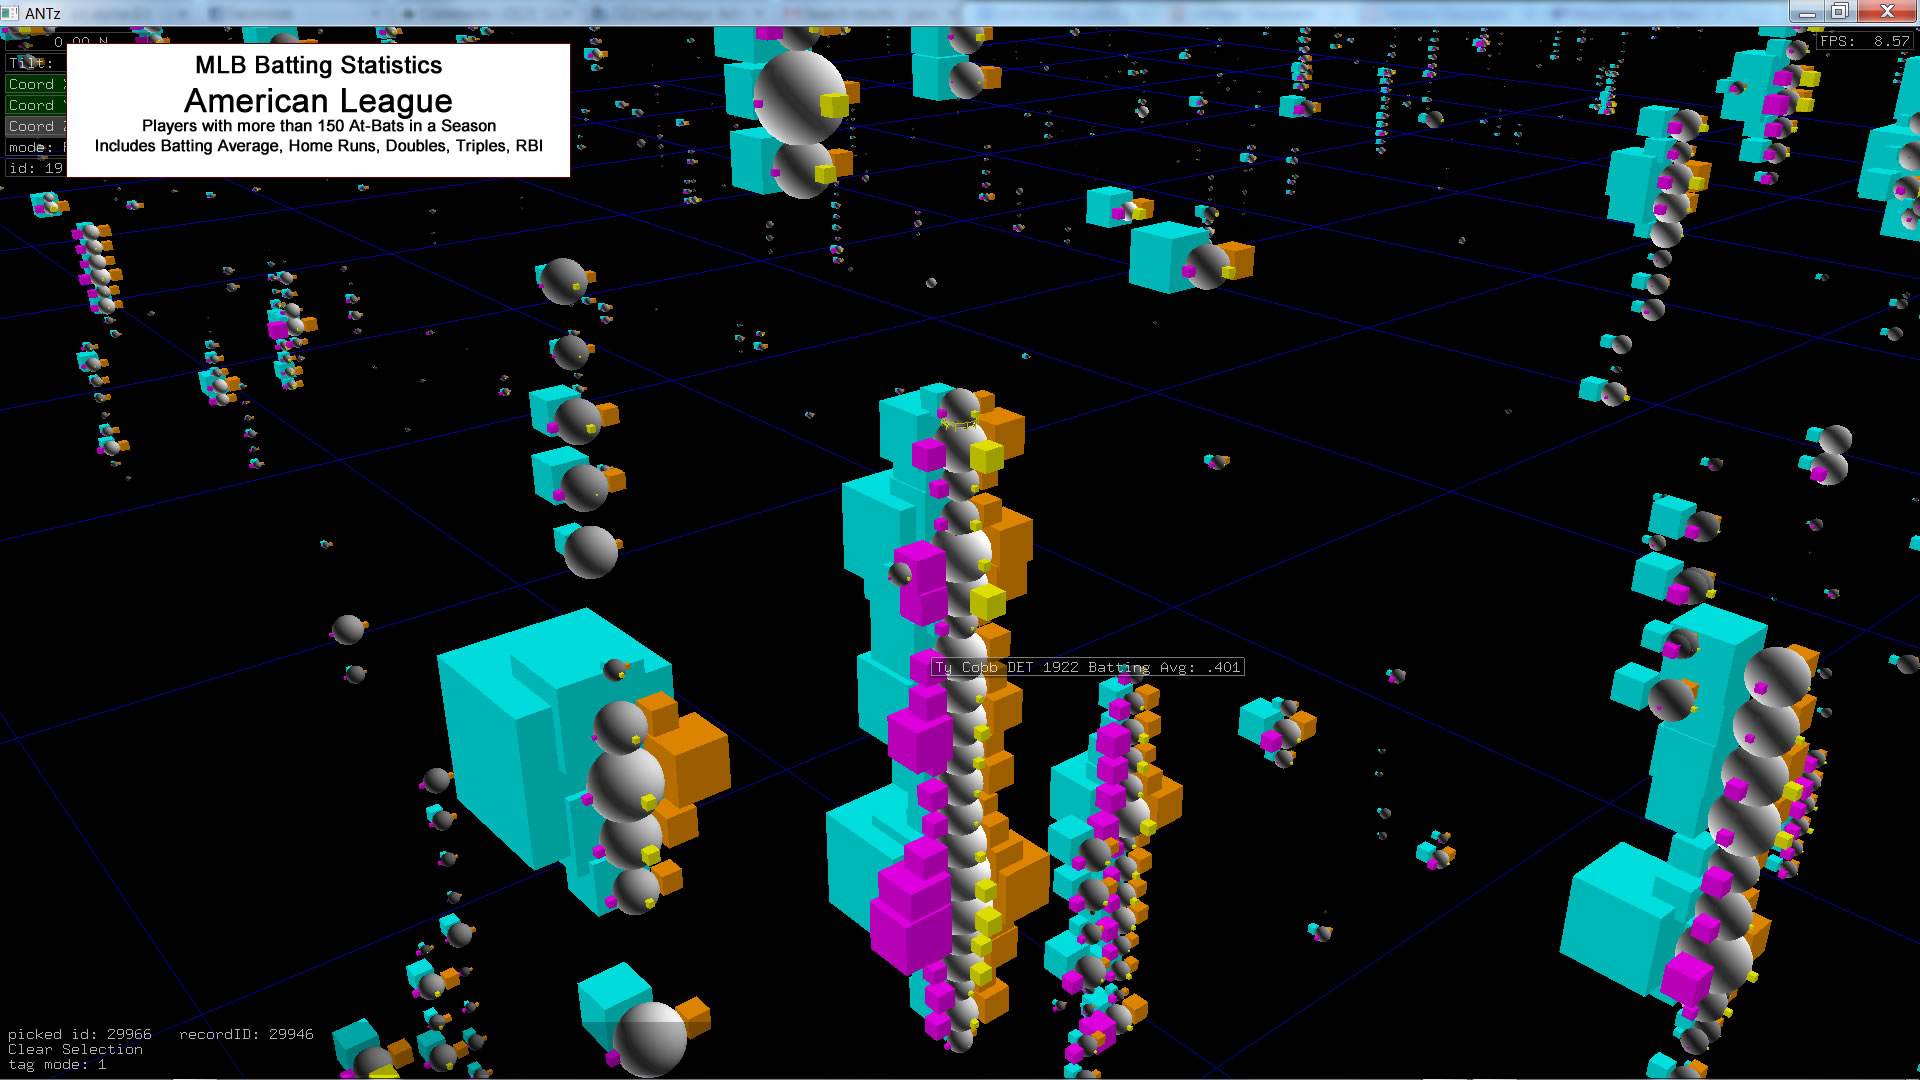
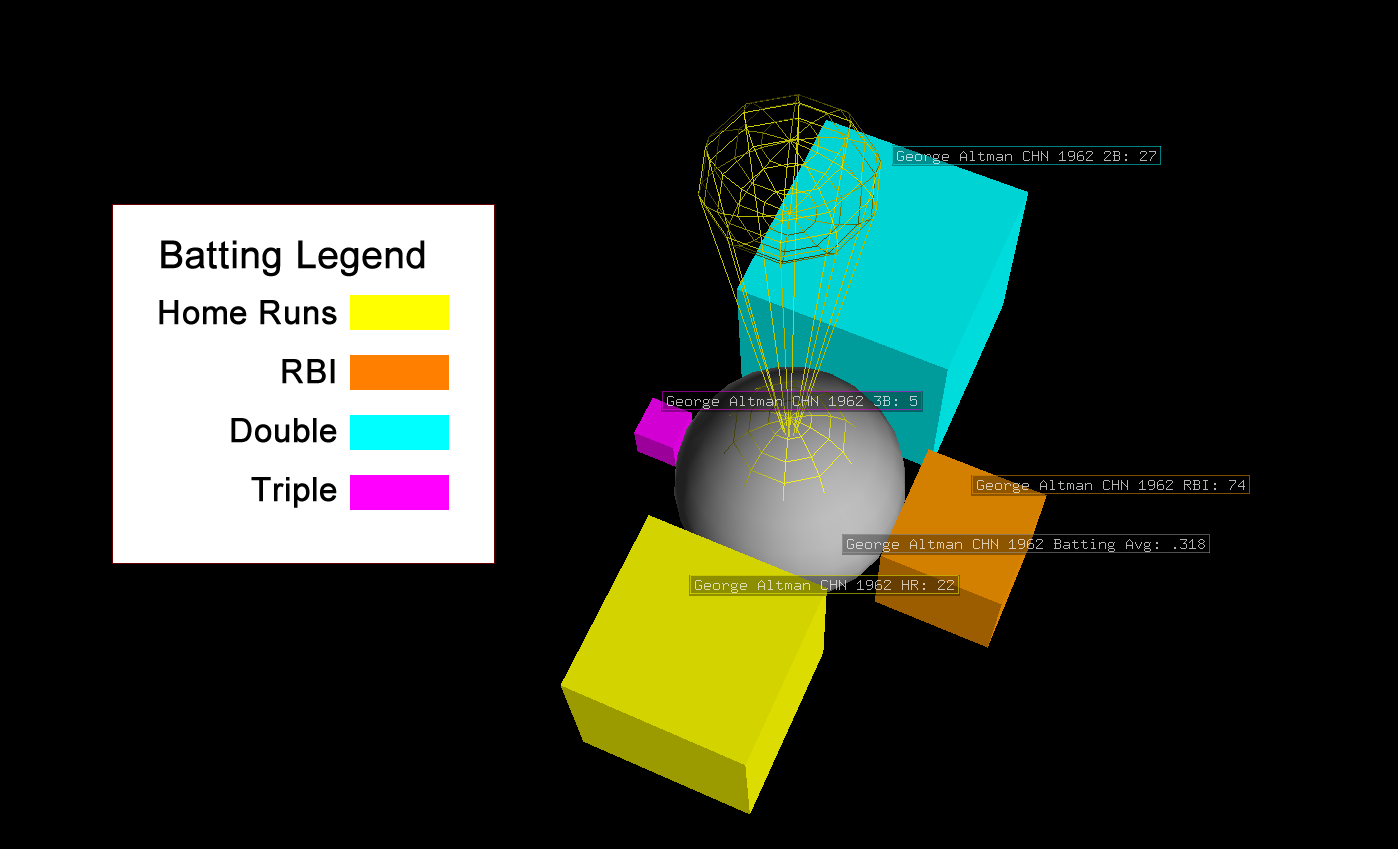
MLB Batting Glyph Design
Our glyph design is relatively simple, consisting of only two branch levels, 1) A branch level 0 sphere colored a neutral gray and scaled to match batting average, and 2)Four branch level 1 cubes, color-coded to represent four different batting stats, scaled according to their numeric values. See the image below.
To code this, we need to read data into an array and then transform the data into a Node and Tag file.
Let's Review the Python Code in a Jupyter Notebook
The main difference between this code and the simple link example is the file import. We are using a CSV format file for data input which is very common and very simple to understand and parse.
Below is the Python code:
file_in = open('mlb_batting.csv', 'r')

xcoord = {}
ycoord = {}
zcoord = {}
batting_avg = {}
doubles = {}
triples = {}
home_runs = {}
rbi = {}
player_data = {}
inc = 0
for line in file_in:
    print(str(inc) + " " + line)
    line_array = line.split(",")
    xcoord[inc] = line_array[0]
    ycoord[inc] = line_array[1]
    zcoord[inc] = line_array[2]
    batting_avg[inc] = line_array[3]
    doubles[inc] = line_array[4]
    triples[inc] = line_array[5]
    home_runs[inc] = line_array[6]
    rbi[inc] = line_array[7]
    player_data[inc] = line_array[8].strip()
    inc += 1
total_players = inc
First we open the file for reading. Then we initialize our arrays (or dictionaries). Then we define a variable 'inc' to increment for the array indices.
We read in one line at a time. We split the line using a comma delimiter and pass it to another array, 'line_array'. Then we assign the values from each line to their respective arrays. Finally, we assign the final value of the increment to the 'total_players' variable, which is equal to the size of the arrays.
The remaining code includes initializing all ANTz parameters. Then opening the Node and Tag files for writing. Then writing the requisite header rows for each file.
Then we write the default rows for the world, cameras, and grid.
Then we loop through the count of 'total_players' and generate the rows for the branch level 0 objects. For each branch level 0 object there are 4 branch level 1 objects, so once we write the rows for an BL0 object we need to loop through BL1 objects 4 times. Thus, the 'numlevel1toroids' variable is equal to 4.
In this nested for loop, we use an if statement to output different colors, scales, and tag text for each of the BL1 objects.
Then we repeat this for all rows in the data, and finally close the file.
The C code contains similar structure and should output something similar. The Python code is identical to the Jupyter Notebook code.
Initialize the ANTz variables
The next section sets all 92 of the ANTz parameters to an initial value. Only a small subset of these will actually be modified for the visualization.
# Initialize all ANTz Node variables
id = 0
type = 5
data = id
selected = 0
parent_id = 0
branch_level = 0
child_id = id
child_index = 0
child_count = 0
ch_input_id = 0
ch_output_id = 0
ch_last_updated = 0
average = 0
interval = 1
aux_a_x = 0
aux_a_y = 0
aux_a_z = 0
aux_b_x = 0
aux_b_y = 0
aux_b_z = 0
color_shift = 0
rotate_vec_x = 0
rotate_vec_y = 0
rotate_vec_z = 0
rotate_vec_s = 1
scale_x = 0
scale_y = 0
scale_z = 0
translate_x = 0
translate_y = 0
translate_z = 0
tag_offset_x = 0
tag_offset_y = 0
tag_offset_z = 0
rotate_rate_x = 0
rotate_rate_y = 0
rotate_rate_z = 0
rotate_x = 0
rotate_y = 0
rotate_z = 0
scale_rate_x = 0
scale_rate_y = 0
scale_rate_z = 0
translate_rate_x = 0
translate_rate_y = 0
translate_rate_z = 0
translate_vec_x = 0
translate_vec_y = 0
translate_vec_z = 0
shader = 0
geometry = 3
line_width = 1
point_size = 0
ratio = 0.1
color_index = 0
color_r = 110
color_g = 110
color_b = 110
color_a = 255
color_fade = 0
texture_id = 0
hide = 0
freeze = 0
topo = 2
facet = 0
auto_zoom_x = 0
auto_zoom_y = 0
auto_zoom_z = 0
trigger_hi_x = 0
trigger_hi_y = 0
trigger_hi_z = 0
trigger_lo_x = 0
trigger_lo_y = 0
trigger_lo_z = 1
set_hi_x = 0
set_hi_y = 0
set_hi_z = 0
set_lo_x = 0
set_lo_y = 0
set_lo_z = 0
proximity_x = 0
proximity_y = 0
proximity_z = 0
proximity_mode_x = 0
proximity_mode_y = 0
proximity_mode_z = 0
segments_x = 16
segments_y = 16
segments_z = 0
tag_mode = 0
format_id = 0
table_id = 0
record_id = id
size = 420
Next, we open two files for output, the ANTz node file, antz0001node.csv, and the ANTz tag file, antz0001tag.csv, and we write the first few lines to the node file for the world, camera, and grid parameters, and we write the header row to the tag file.
# Open ANTz Node file for writing
fout = open("usr/csv/antz0001node.csv","w")
# Open the Tag file to add metadata to ANTz objects
  ftag = open("usr/csv/antz0001tag.csv","w")
  # Write the header string
  outputstring = "id,record_id,table_id,title,description\n"
  ftag.write(outputstring)
# Write rows for header, world, camera views (4), and grid to Node file
  outputstring = "id, ... \n"
  fout.write(outputstring)
# Row for world parameters
  outputstring = ... + "\n"
  fout.write(outputstring)
  # Row for first camera view
  outputstring = ... + "\n"
  fout.write(outputstring)
  # Row for second camera view
  outputstring = ... + "\n"
  fout.write(outputstring)
  # Third camera view
  outputstring = ... + "\n"
  fout.write(outputstring)
  # Fourth camera view
  outputstring = ... + "\n"
  fout.write(outputstring)
  # Default Grid
  outputstring = ... + "\n"
  fout.write(outputstring)
Next, we initialize a few more variables and start the loop for the branch level 0 geometries. We are setting the scale_x, scale_y, and scale_z parameters to be equal to the baseball player's batting average, and we are positioning the translate_x, translate_y, and translate_z equal the baseball player's name listed alphabetically for the x axis, the player's team for the y axis, and the year for the z axis.
# Initialize increments
  taginc = 0
id = 6
numlevel0toroids = total_players
  numlevel1toroids = 4
  numlevel2toroids = 0
i = 0
  # Loop Through Tweets of Most Common Users and Output to ANTz Node and Tag Files
  while i < numlevel0toroids:
      pprint("i:" + str(i))
      # Modify relevant ANTz parameters
      id += 1
      data = id
      type = 5
      parent_id = 0
      selected = 0
      branch_level = 0
      child_id = id
      child_count = numlevel1toroids
      translate_x = xcoord[i]
      translate_y = ycoord[i]
      translate_z = zcoord[i]
      scale_x = 2.0 * float(batting_avg[i])
      scale_y = scale_x
      scale_z = scale_x
      geometry = 1
      topo = 7
 # Determine if root object should be green for tweet or red for retweet
      color_index = 1
      color_r = 100
      color_g = 100
      color_b = 100
      record_id = id
      # Creat output string and write to ANTz Node File
      outputstring = str(id) + ... + " + str(size) + "\n"
      fout.write(outputstring)
 # Output to Tag file
      tagtext = player_data[i] + " Batting Avg." + batting_avg[i]
      tagstring = str(taginc) + "," + str(record_id) + ",0,\"" + tagtext + "\",\"\"\n"
      ftag.write(tagstring)
      taginc += 1
 # Get id for parent object of branch level 1 objects created below
      level0objectid = id
Next, we loop through the branch level 1 geometries. There are four cube geometries color-coded differently and scaled to represent the player's # of doubles, triples, home runs, and runs-batted-in (RBIs). We write this line to the node output file, and we write the relevant tag text to the output tag file. Then we close both files and we have a visualization.
 # Branch level 1 includes a single rod geometry with
 # scale_z proportional to followers count since Sept. 1, 2017
 # Colored cyan for increase in followers_count, white for decrease
 j = 0
 while j < numlevel1toroids:
     id += 1
     data = id
     type = 5
     parent_id = level0objectid
     selected = 0
     branch_level = 1
     child_id = id
     child_count = numlevel2toroids
     translate_x = j * 360/numlevel1toroids
     translate_y = 0
     translate_z = 2
     if j == 0:
         scale_x = float(doubles[i])/40
         color_index = 3
         color_r = 0
         color_g = 255
         color_b = 255
         tagtext = "Doubles:" + doubles[i]
     elif j == 1:
         scale_x = float(triples[i])/20
         color_index = 4
         color_r = 255
         color_g = 0
         color_b = 255
         tagtext = "Triples:" + triples[i]
     elif j == 2:
         scale_x = float(home_runs[i])/20
         color_index = 5
         color_r = 255
         color_g = 255
         color_b = 0
         tagtext = "Home Runs:" + home_runs[i]
     else:
         scale_x = float(rbi[i])/100
         color_index = 6
         color_r = 255
         color_g = 125
         color_b = 0
         tagtext = "RBIs:" + rbi[i]

     scale_y = scale_x
     scale_z = scale_x
     geometry = 1
     topo = 7
     record_id = id
     outputstring = str(id) + ... + " + str(size) + "\n"
     fout.write(outputstring)
     ## Output to Tag file
     tagstring = str(taginc) + "," + str(record_id) + ",0,\"" + tagtext + "\",\"\"\n"
     ftag.write(tagstring)
     taginc += 1
     level1objectid = id

j += 1
i += 1
fout.close()
ftag.close()