In this lesson, we explore an simple example of hyperglyph visualization which demonstrates some of the main features of hyperglyph creation with code examples. We're going to run some code to generate the requisite Node CSV file and a Tag CSV file automatically using some random settings to keep things simple. The we will look at the resulting CSV files and get a sense of what it might be like to have to 'reverse-engineer' the file.
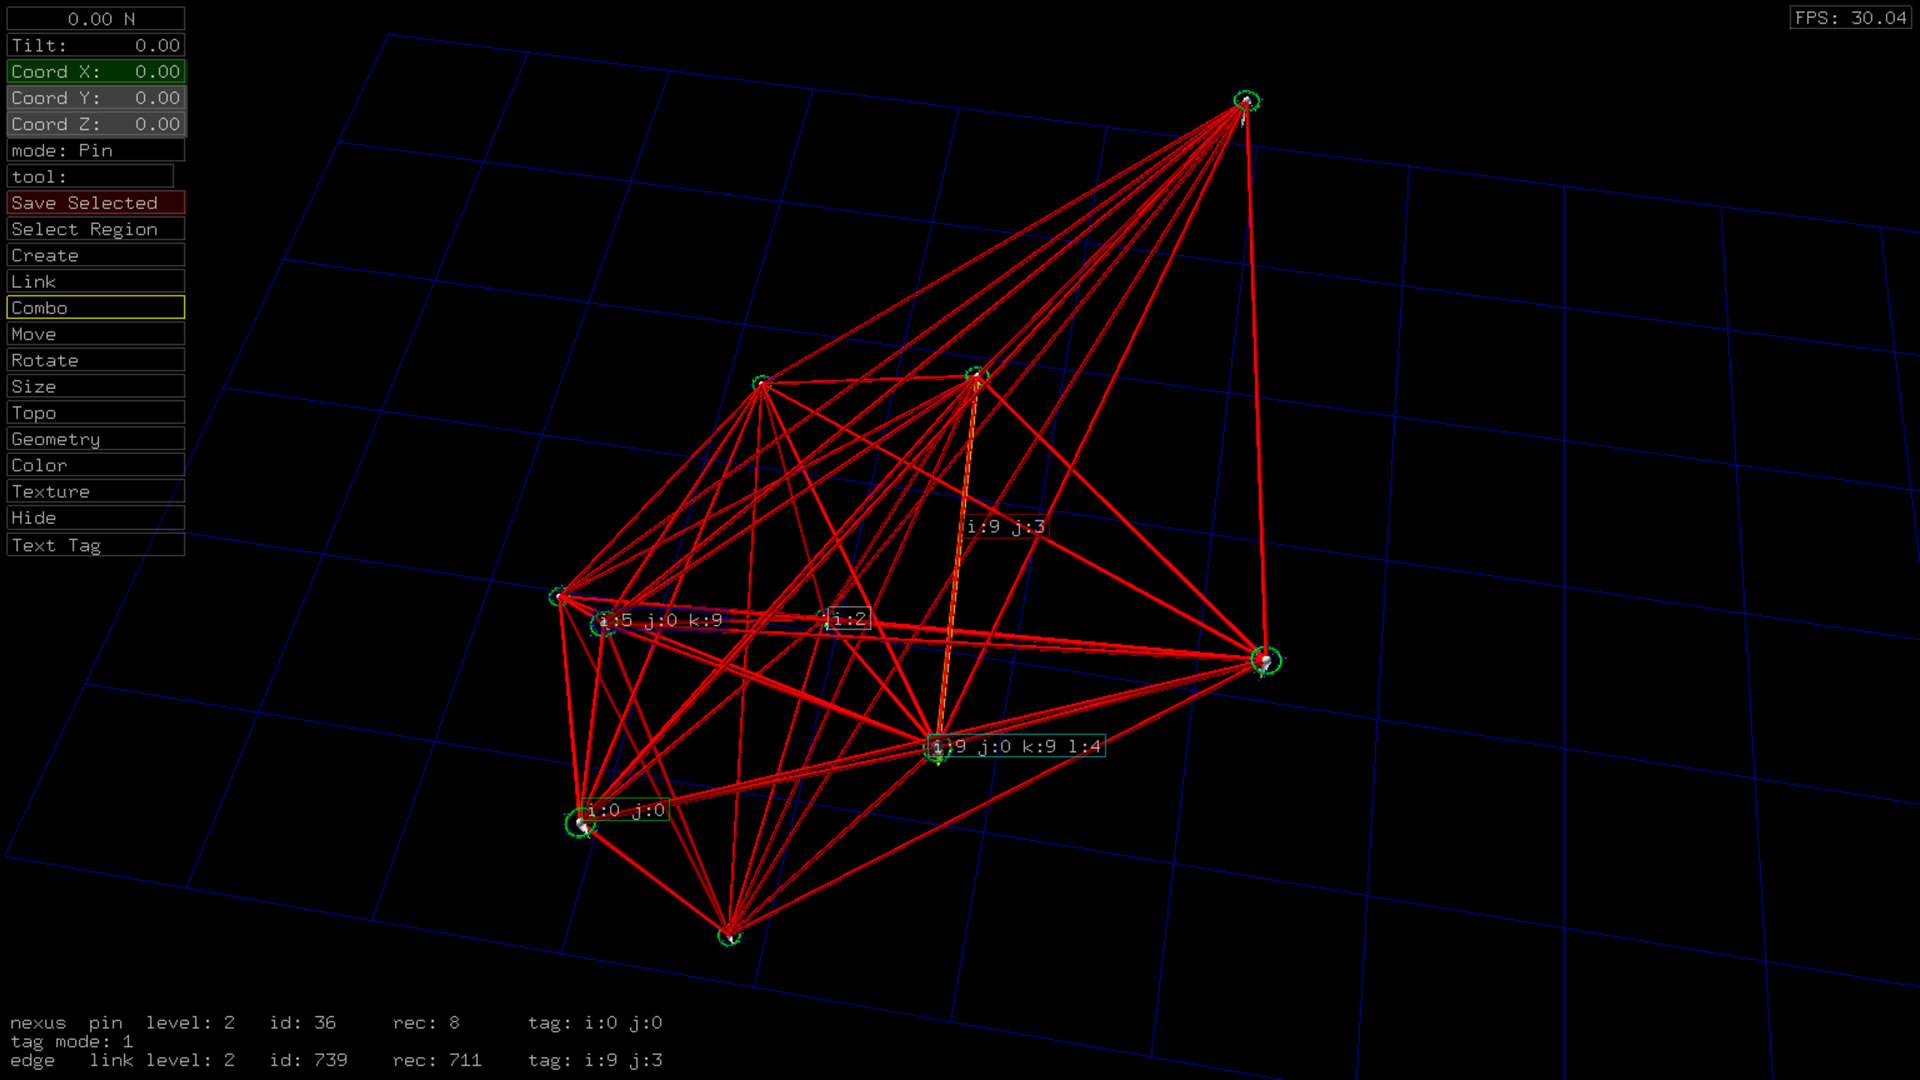
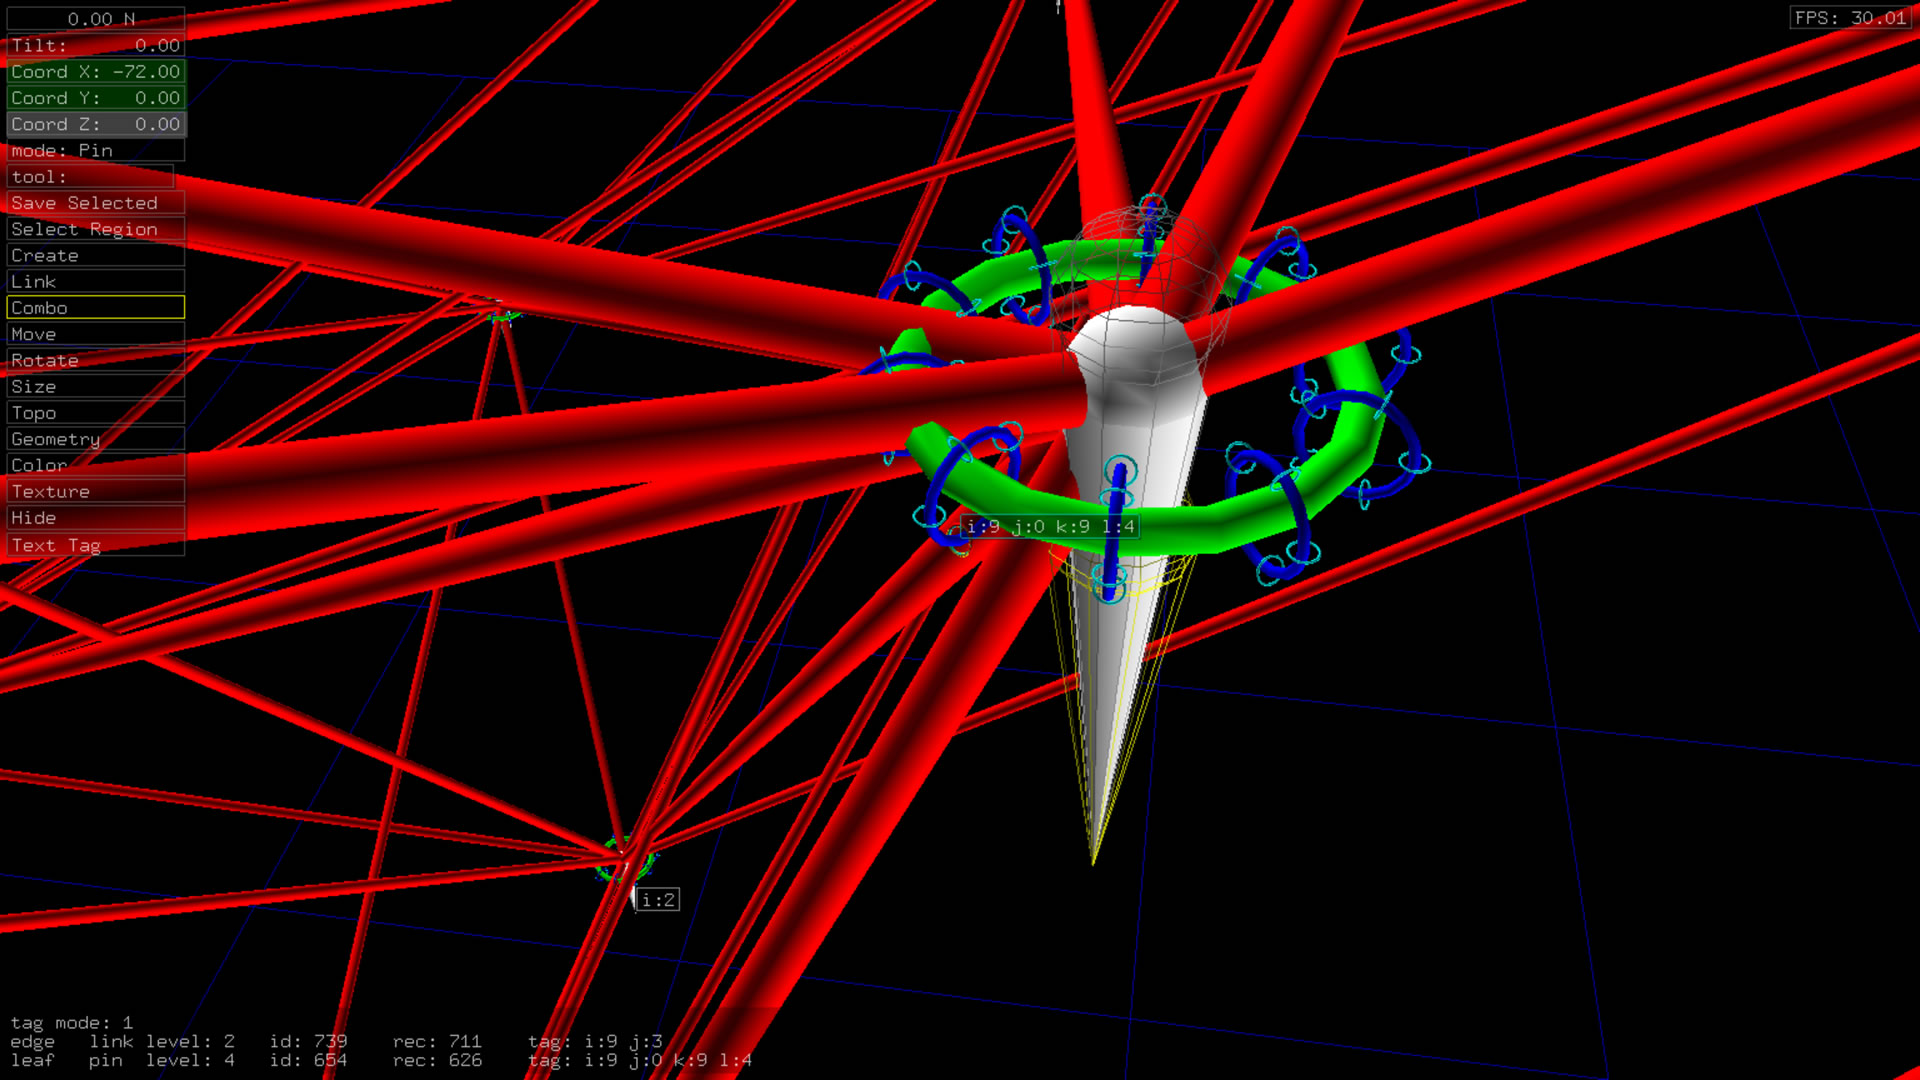
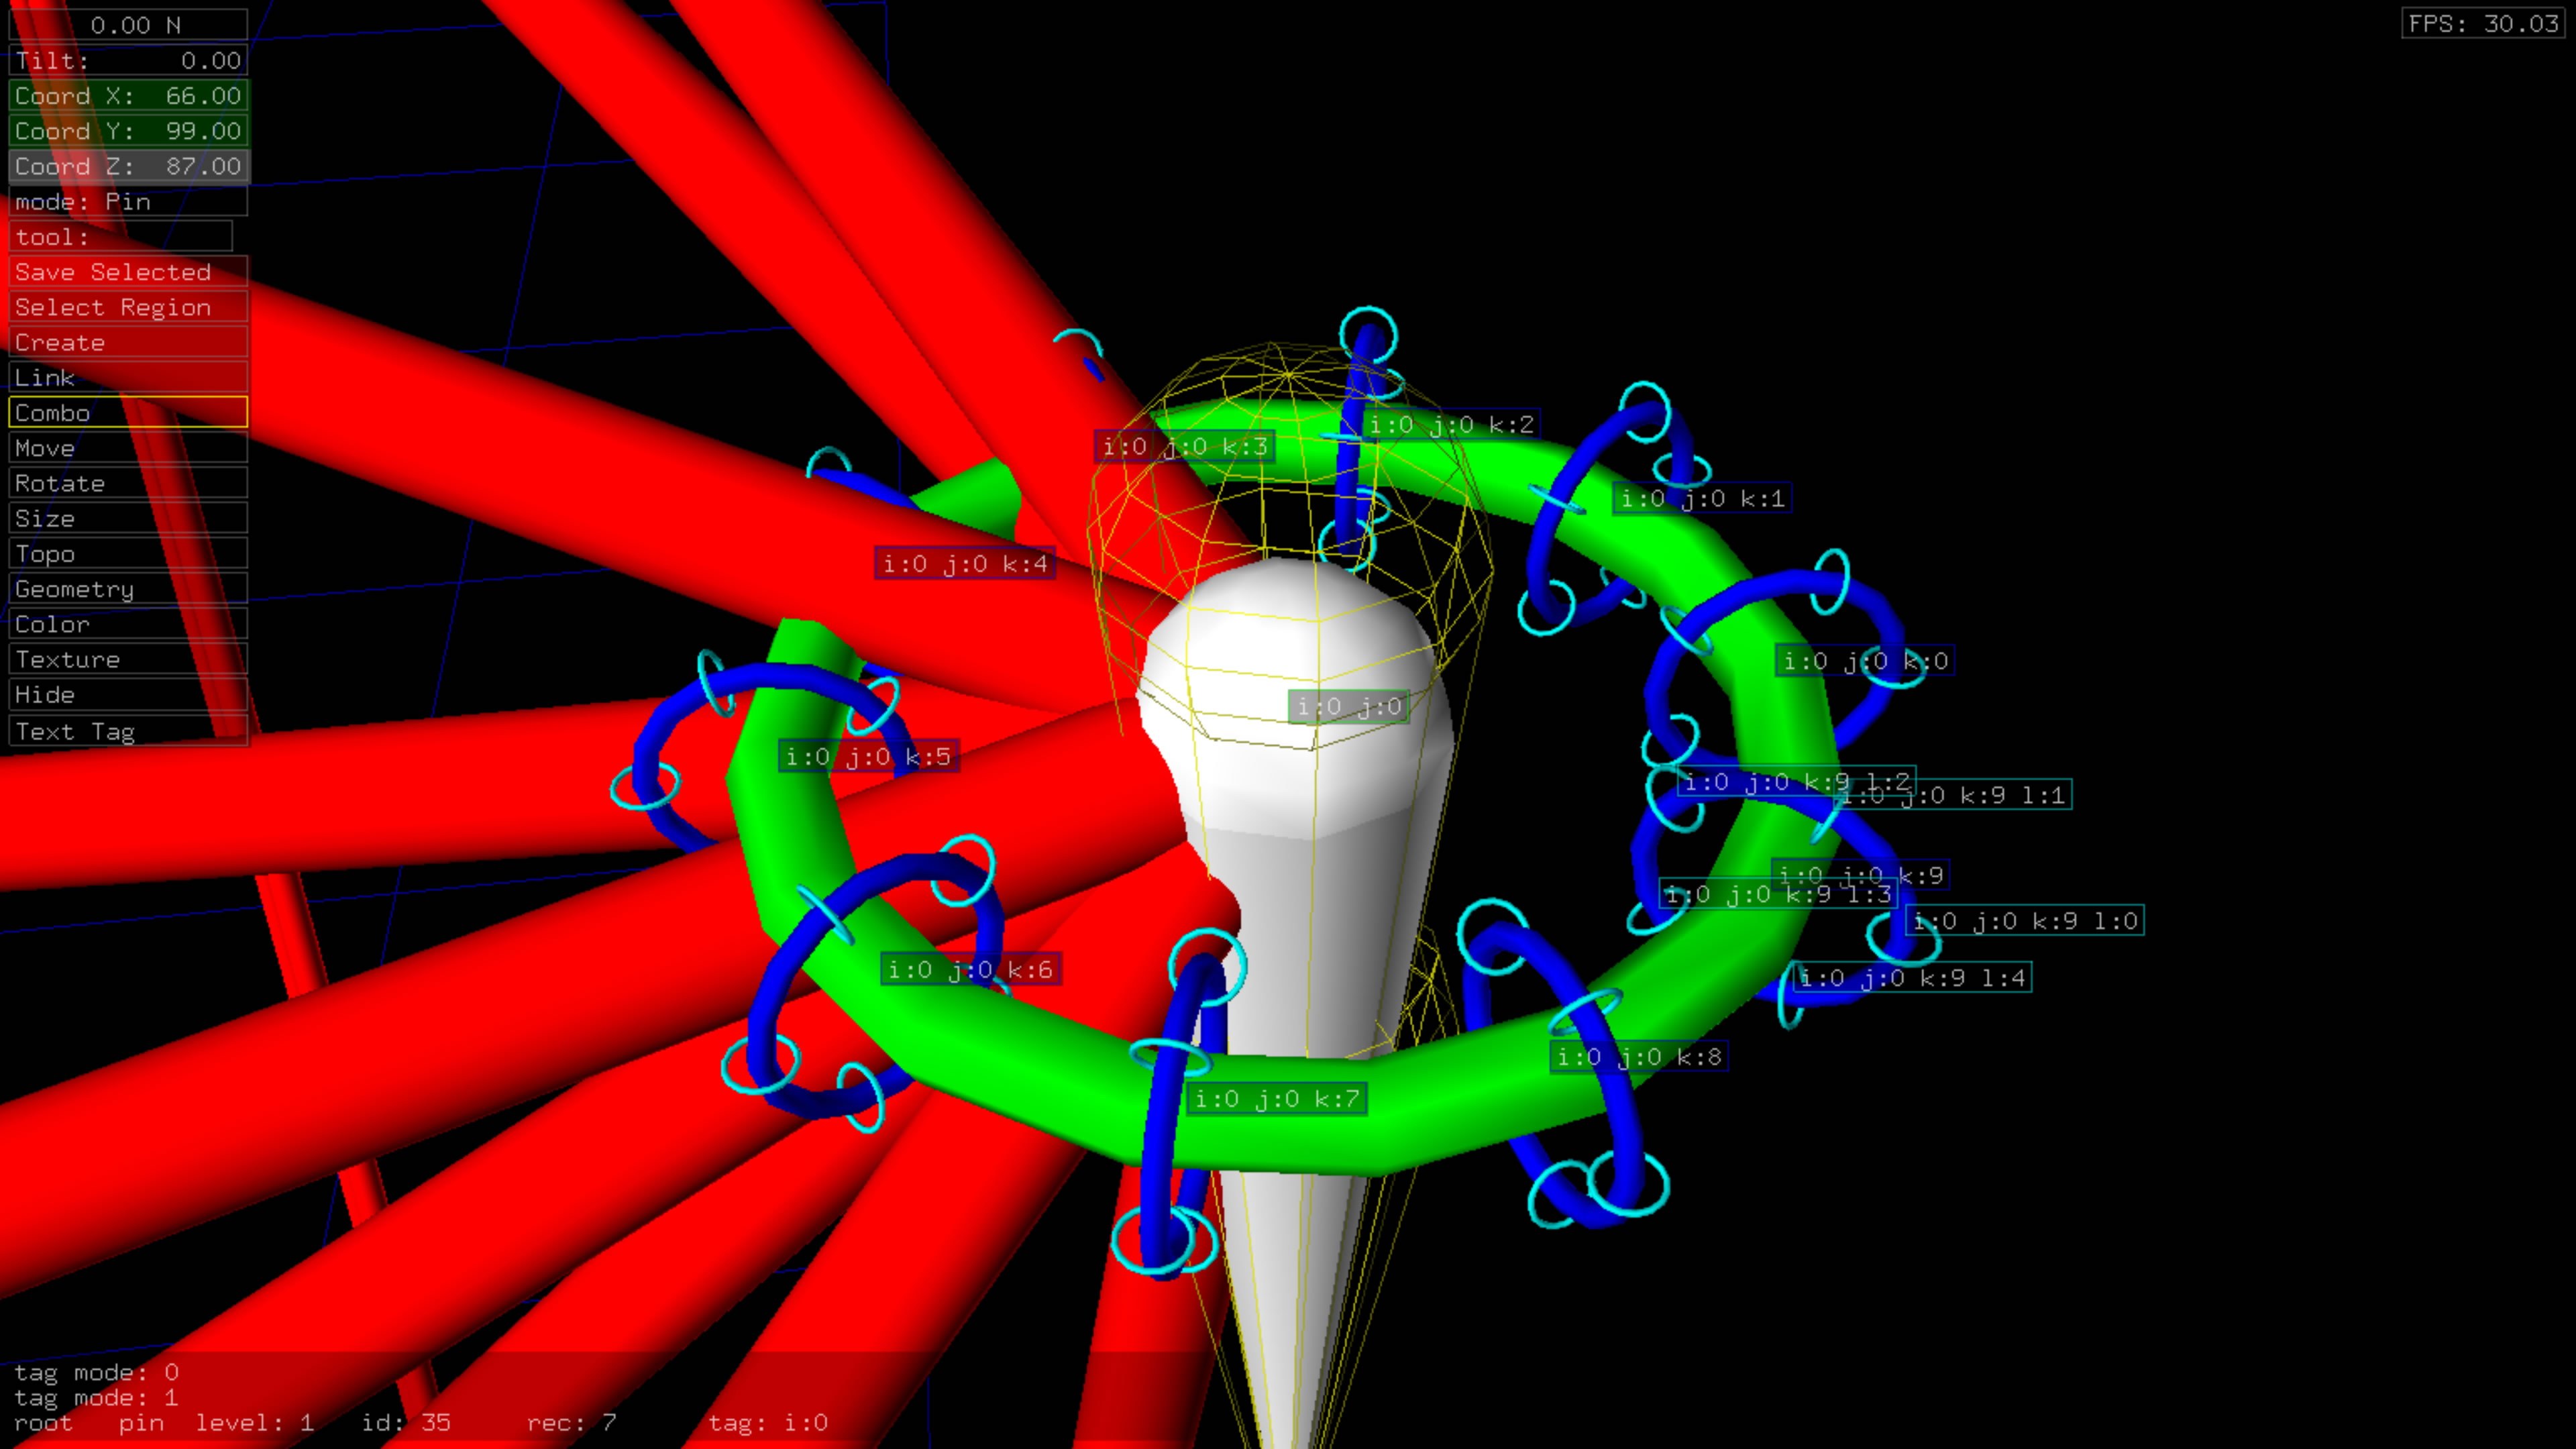
This code example generates 10 hyperglyphs with geometries across 4 branch levels. There are 10 objects in branch level 0, 1 in level 1, 10, in level 2, and 5 in level 3. The The root objects are linked using the ANTz linking feature. These links are equivalent to edges in a graph network. Color-coding is based on branch level. Metadata tags include details for the id and branch levels.
Download the final visualization for Windows.
Download the final visualization for Mac OS X.
Download the C code to generate the ANTz node and tag CSV files.
Download the Python code to generate the ANTz node and tag CSV files.
Download the Jupyter Notebook to generate the ANTz node and tag CSV files.
Review the Node and Tag CSV Files
If you've already downloaded one of the zip archives above, then you can navigate to the Node and Tag files located in the usr/csv/ subfolder where you extracted the archive, or you can simply click the links below.
The ANTz Node file contains 94 columns corresponding to 94 ANTz node geometry parameters and as many rows as a dataset requires for an ANTz visualization. Most of the 94 columns do not typically get used. The primary columns of importance include:
- Type
- Branch Level
- Parent ID
- Child ID
- Scale x,y,z
- Translate x,y,z
- Rotate x,y,z
- Geometry
- Color (rgba)
- Topology
- Texture ID
The ANTz Tag file includes 5 columns and as many rows as needed for the number of geometries in the visualization. The Tag file contains metadata used to display within the visualization. this is an important feature that many viz tools are incorporating. The Tag file uses the record_id parameter from the Node file to specify which row in the Tag file corresponds to the Node file with the same record_id value.
Next, let's take a look at the code which was used to generate this simple link example. (see download links above)