Hyperglyph Design
In this lesson we familiarize ourselves with how to approach hyperglyph design given a particular dataset.
Many typical datasets don't necessarily call for a complex hyperglyph visualization. Which datasets are more appropriate than others is still a topic for discussion. One of the overarching motivating factors is the need or desire to explore a typically large amount of data without necessarily looking for anything in particular. This exploratory mode calls for a hyperglyph which not only provides visual cues but should also include support for metadata, interactivity, and animation.
Who is the user? Why do they care?
Foremost in hyperglyph design is the concept of user-centered design. Hyperglyph design depends directly on both the user, who is expected to interpret it, and the overarching purposeful activity they are expected to perform. Human-centered AND activity-centered design must work together in an iterative way using a successive approximation model that includes both the designer(s) and the user(s).
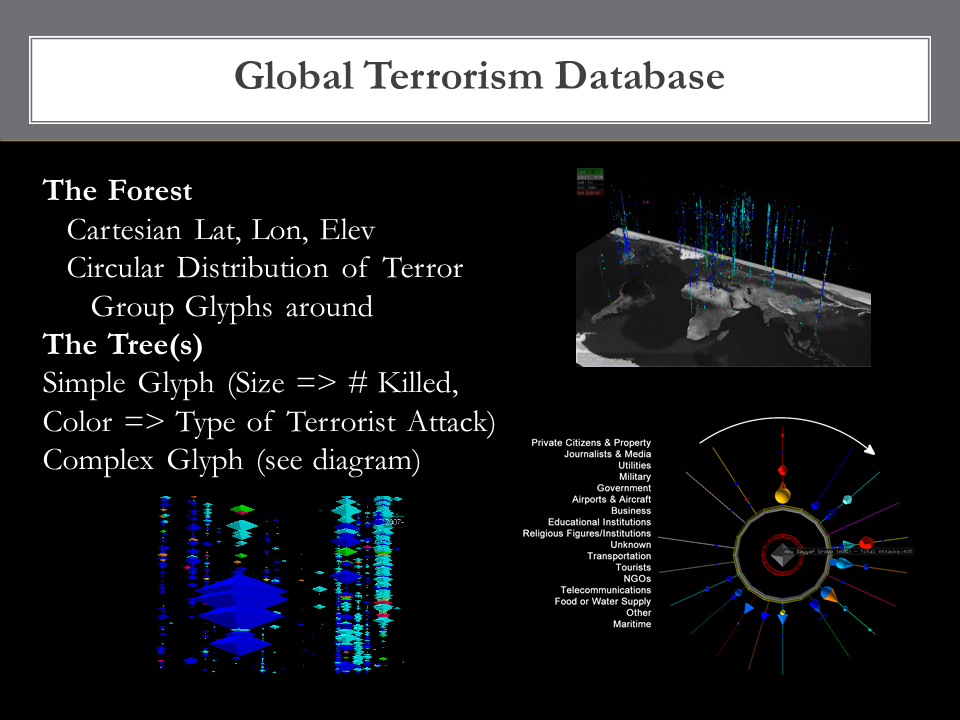
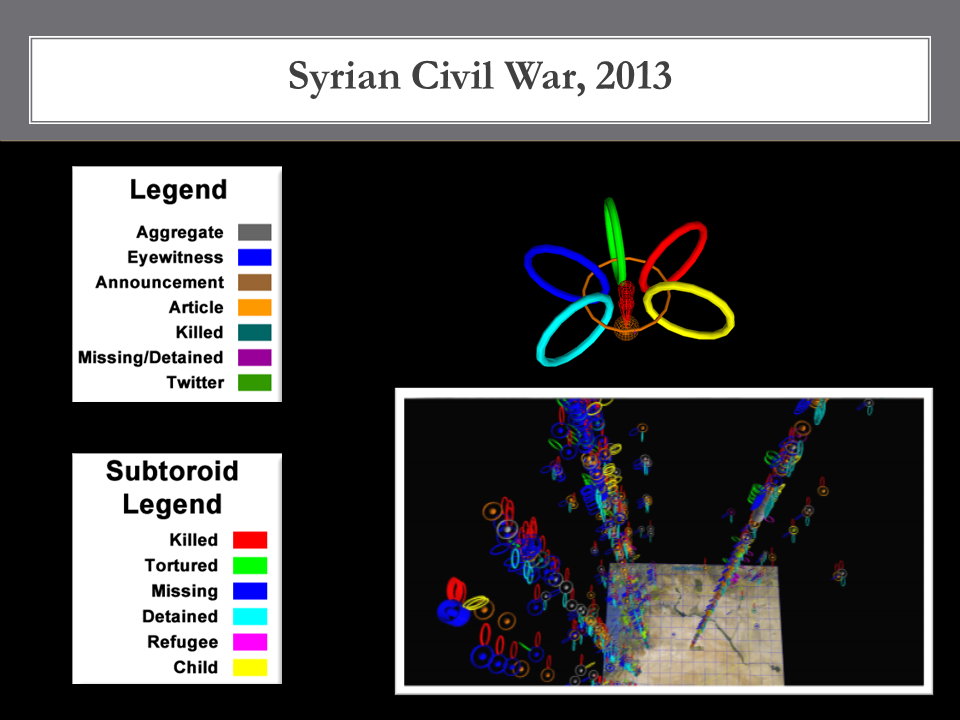
Many visualizations have been of interest to the client but not necessarily by the designers, so we need to develop a clear understanding of who the user is and why they want to explore their own data. With this in mind, there are a few datasets which I have a personal interest in from the perspective of an engaged and goal-directed user and, as a result, even though some of my glyph designs have been too complex for a general audience, they work for me. Two examples of complex glyphs which are arguably too much information are the Cal State STAR testing data for schools in the San Diego Unified School District [click to view], and the Global Terrorism Database glyph for terrorist group activity [click to view].
The California STAR test data glyph for the San Diego Unified School District is complex, but I like it. It is too complex for others to whom I have shown it, but when I look at it I get insights. The design is still not optimal, most likely because I am not the optimal user (my interest is mainly personal, I don't work for the district), but there is something about this glyph which I find compelling, at least in part because I have a strong interest in this data and I have questions to ask and answer more easily with ANTz.
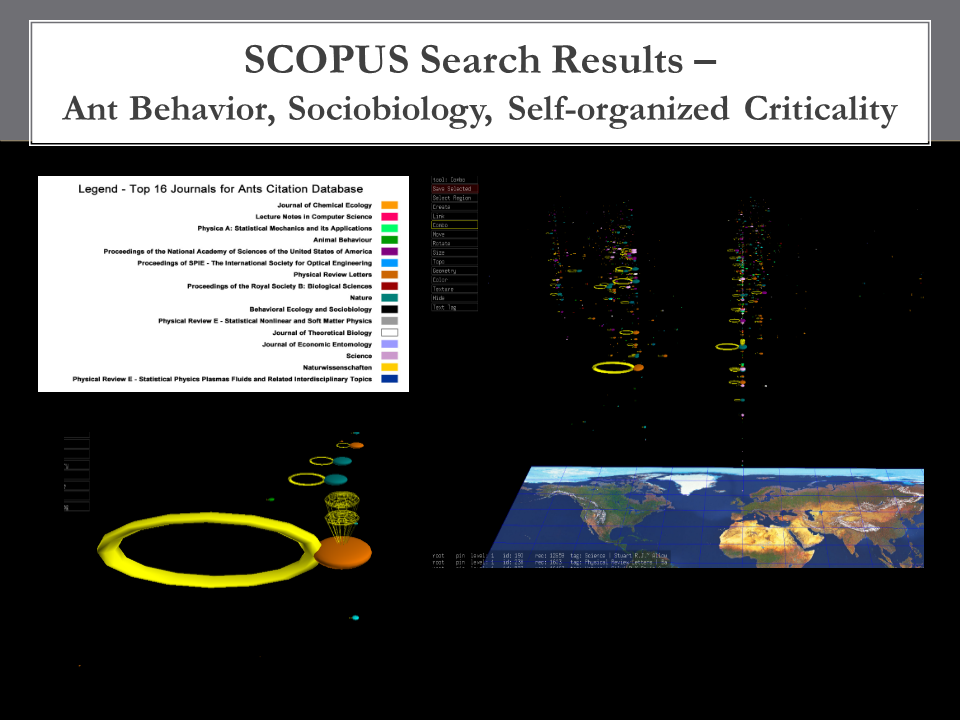
On the other hand, one of my poorer designs resulted from not having such a strong purposeful engagement with the data in order to drive exploration. I had no specific questions, this was purely exploratory, I was just trying to display as much info as possible (I do that alot). The glyph I designed was intended to represent all terrorist activities for a specific terrorist group using data from the Global Terrorism Database (GTD). This glyph does not work for me (or anyone else, so far). When I look at it I do not gain insight as easily as I do with the STAR test data even though the glyph design was of a similar complexity to the STAR test data glyph. There are other issues including choice of parameters, colors, geometries, topos, etc., but these are more symptomatic than causal.
Hyperglyph Design Factors to Consider
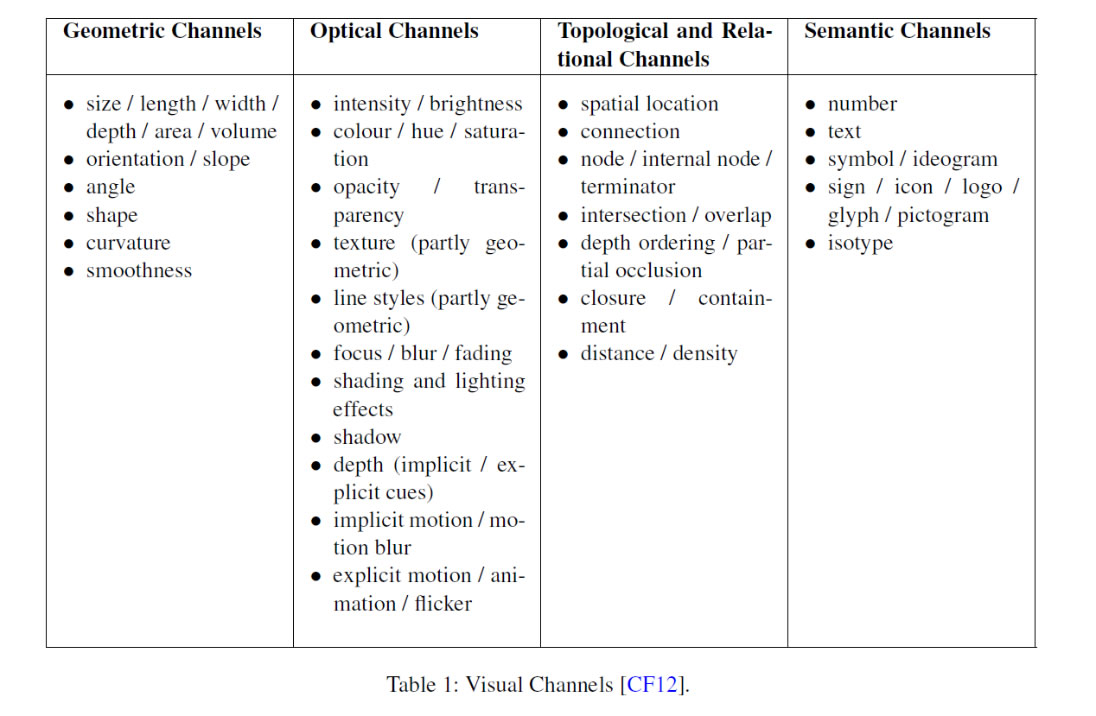
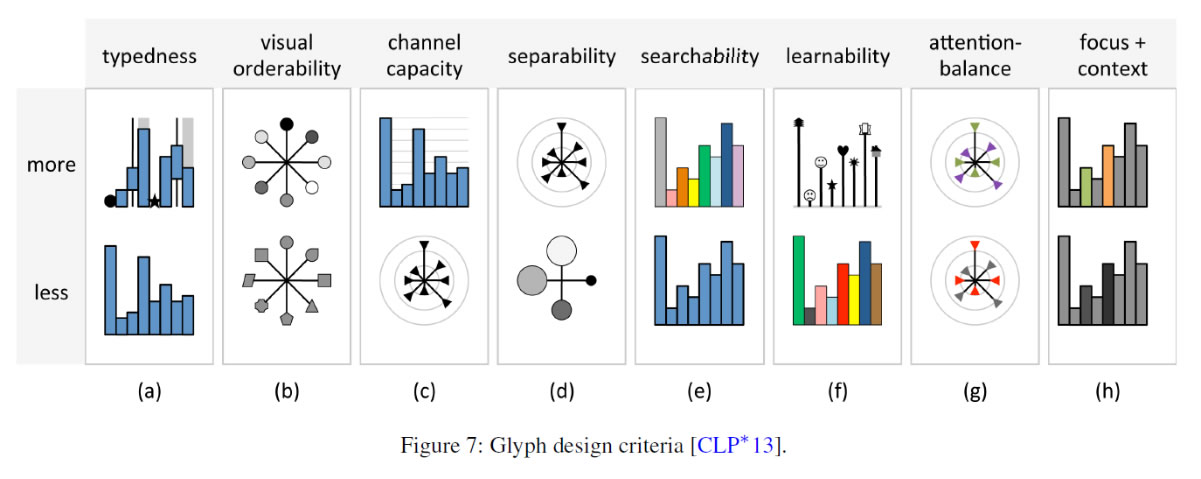
We learned from the introductory slides about visual channels and glyph design criteria.
Independent of the above work, below is a list of factors to consider which is just a variation on previous work:
- Grouping
- Repetition
- Point of view
- Scale
- Orientation
- Distribution
- Movement
- Contrast
- Color & Transparency
- Proximity
- Alignment
- Performance
- Complexity
Grouping
Within an individual hyperglyph, geometries such as toroids and rods may serve as a way to associate multiple objects as part of a category much like drawing a line to provide a visual connection between what we believe to be associated objects.
For large numbers of hyperglyphs grouping or clustering in various ways can help reveal differences or commonalities.
Repetition
Repetition is usually an important factor in any design process. Repetition in glyph design is no different. Repeating the use of the same geometry or the same color generally implies common information.
Point of View
Glyph design should consider the viewer’s point of view. POV issues share some considerations with Alignment and Proximity. When aligned in a linear way, variation across multiple complex glyphs can be more easily observed when the POV allows for a ‘stacked’ distribution in much the same way a bar chart makes it easier to observe variation than text.
Scale
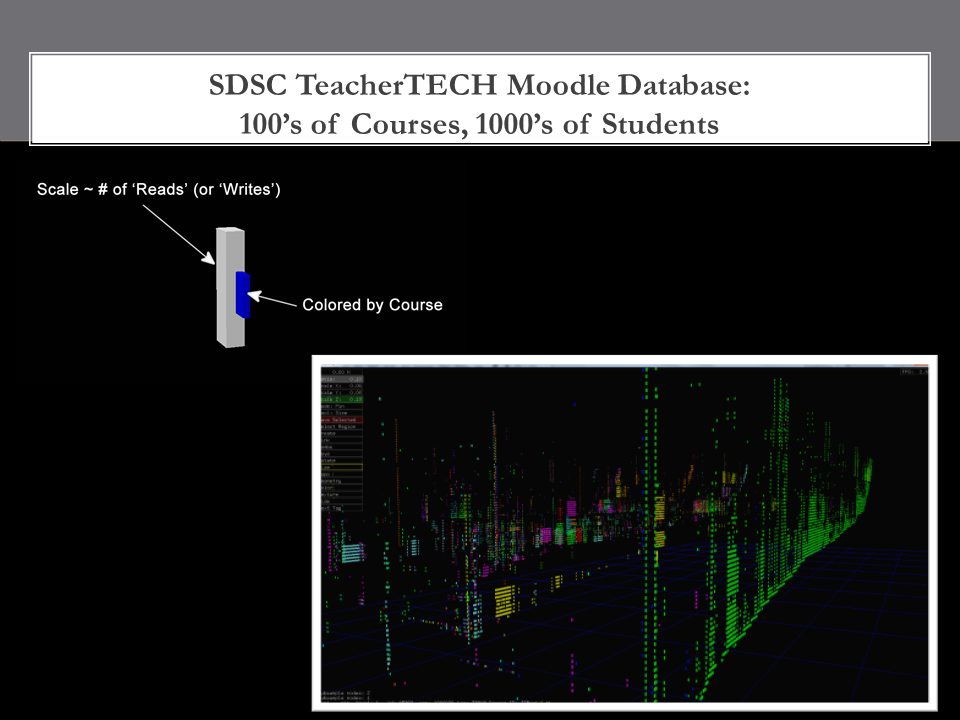
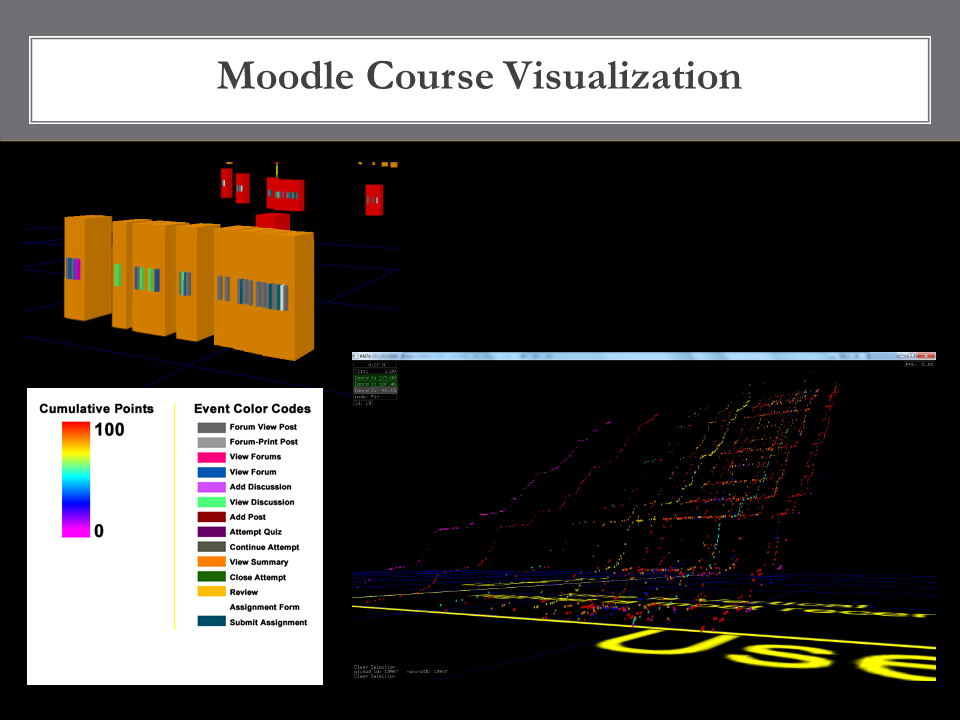
Scale can be used to take advantage of the variation in viewable content at varying zoom factors. Large differences in the scale between a parent and a child object facilitates viewing different information at different zoom factors. As an example, consider data from an online college course on any subject, in this case web design, delivered with the Moodle LMS [click to view]. Data for student activity over an entire semester can include grades, discussion forum activity, assignment submissions, etc. The root geometry can represent the student’s overall grade for the semester allowing the user to get a sense of student activity vs. final grade. The root geometry would be rendered at some scale such that, when zoomed out, the user can easily see this and notice many interesting features of the overall course activity as it progressed week by week.
At the same time, the child objects are scaled much smaller and displayed on only one side of the parent object such that they can be viewed only when zoomed in and from the correct direction. These objects can represent each student’s specific activity color coded for each possible type, allowing the user to simultaneously see the larger parent objects, thus still having a sense of overall student performance, but also see thousands of individual events which the students performed and which play out over time and space.
Orientation
Orientation in space generally depends on an object's rotation in one way or another. ANTz topologies support a variety of spatial distributions which allow the translation parameters to also be useful in orientation variation. Orientation often depends or goes hand-in-hand with alignment.
Distribution
Distribution is one of the most important factors to consider. Matrices and linear arrays are ubiquitous in visualization. Geographical distribution is another common method. Spherical yet another. One of the most enlightening capabilities of ANTz is the ability to cycle through topos to see how conventional distributions such as these might look in other less conventional distributions such as the toroid or the rod.
Movement
Animal perception has a natural tendency to attend to movement. Movement in ANTz can be useful in getting attention. However, differentiating rates of movment can be difficult unless objects are proximate.
Contrast
Contrast is a common factor to consider in all design processes. One of the most important and useful applications of contrast is manipulating contrast between objects and the background. Objects of similar color to the background can be deemphasized, allowing for easier perception of important information.
Color
Color is one of the top 2 or 3 characteristics to consider when designing your hyperglyph.
Transparency
ANTz uses transparency in a non-intuitive way. Each object’s transparency is dependent on when it was created. If an object is behind another (semi-)transparent object created earlier in a sequence, it will not be visible. This can be leveraged. One way is to use a central parent object as a way to block the view of specific child objects based on POV, thus enhancing other child objects. The Afghanistan public health data is one example of this.
Proximity
Proximity shares some aspects with Grouping, but it typically is most useful when considering just two or a few objects. Proximity is used to provide information based on how near or far objects are from eachother. This impacts not only hyperglyph design but also distribution in space.
Alignment
I have found alignment of objects to be particularly useful when visualizing temporal data. Hyperglyph design which includes the ability to 'sight' and long row of objects much like a bar chart can be useful in seeing changes over time.
Performance
Polygon count is usually the biggest factor in graphics performance. For this reason, geometries such as a cube or a tetrahedron allow the highest frame rates. However, they do not always offer the most satisfying visualization in terms of aesthetics.
Tetrahedra scaled very small are useful if one is trying to simulate massive amounts of point data such as LIDAR.
Below are a few examples of past work with hyperglyph design, some more successful than others.
Let's give It a Try!
Activity: Design Your Own Hyperglyph
The most straightforward way of creating a hyperglyph is manually in ANTz. Once your hyperglyph is built, you can save it and reverse-engineer it to figure out how to write code to generate the output for thousands of glyphs.
With this in mind, pick one of the following data schema and imagine how you might design a hyperglyph which visualizes all parameters simultaneously.
Water Use Data
Water use data for a large east coast community for a district observing anomalous water usage. Data includes the following:
- Latitude
- Longitude
- Date
- Six years of quarterly (every 3 months) data for four parameters:
- Excess water usage
- Excess cost
- Water consumption
- Total cost
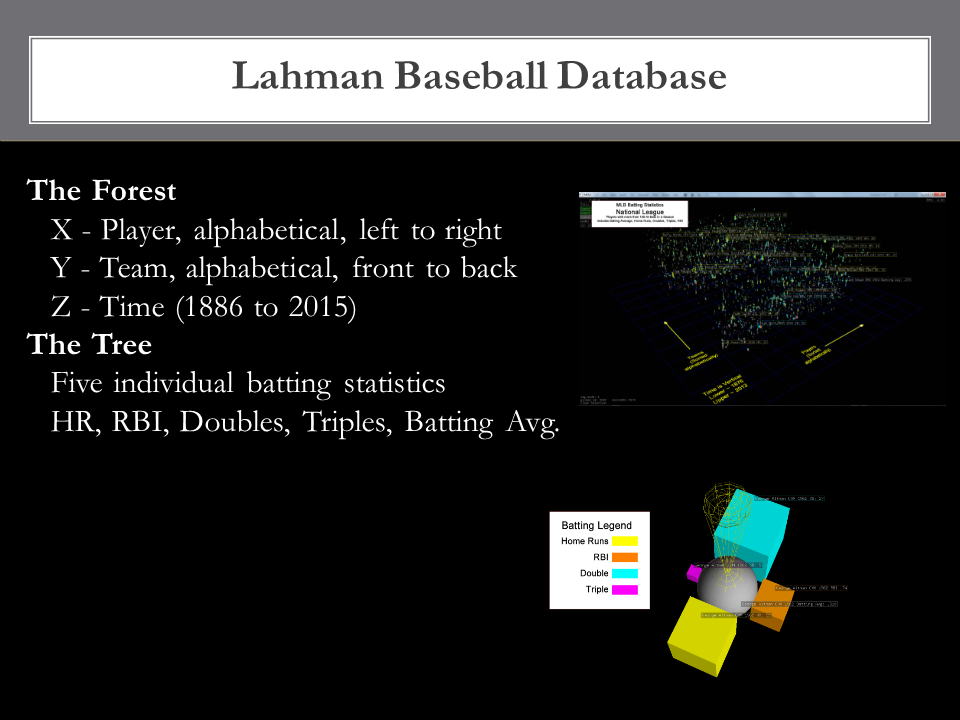
Baseball Batting Statistics Data
The Lahman Baseball Database contains all batting statistics data for the history of baseball, including the following batting statistics:
- Player Name
- Team
- Year
- Batting average
- Doubles
- Triples
- Home runs
- RBIs
Twitter User Tweet Activity Data
Twitter provides easy access to tweet data through their APIs. Data for individual tweets includes dozens of parameters, including:
- Twitter user screen name
- Twitter user account creation date
- Friend count
- Followers count
- Tweet date/time stamp
- Tweet text
Standardized Test Score Data for District With More Than 50 Schools
For several years, California made their state standardized test score data available to download. Data for individual student performance included:
- Year
- School
- Grade
- Disadvantaged/Not disadvantaged
- Demographic groups (male, female, caucasian, hispanic, african american, asian)
- Up to 32 different standardized tests including parameters for:
- Raw score
- Percent above proficiency
Gun-Related Events in U.S. Schools Since Sandy Hook
Data gathered on K-12 and college gun-related injuries or death in the U.S.. for the years 2013, 2014, and 2015. Data includes:
- Date
- Latitude
- Longitude
- School Name
- Type of School (K-12 or College)
- Discharged Firearm
- Injured 1 or More Person
- Killed 1 or More Person
- Attempted Suicide
- Committed Suicide
Or if you have your own dataset in mind, feel free to share your designs.
SynGlyphX Glyph Designer Demo
SynGlyphX has implemented an elegant drag-and-drop GUI for hyperglyph design. In this demonstration, I show how to create the baseball batting statistics visualization using SynGlyphX Glyph Designer app.
More Thoughts to Consider
About Hyperglyphs
- What are they?
- Multimodal information packets consisting of a wide range of perceptual properties, currently dominated by visual information (photic chauvanism).
- What makes some glyphs more “grokkable” than others?
- Two factors, the user and the design. I elaborate on this in my own document.
- The beauty of a glyph is in the mind of the beholder
- Ratios and proportions
- Is there a universal “best glyph”
- There may be unversally-grokkable glyph designs. However, at the moment, only single-geometry glyphs in which scale, color, and distribution serve to differentiate one from another are perhaps the most universally-grokkable. This is because we do not have consensus on other conventions such as parent/child relationships, variation in geometries, color, motion, etc.
- What are the considerations to take into account when glyph building (designing glyphs)
- I elaborate on this my own doc.
- Synglyphx glyphs are capable of capturing/containing/conveying complex relationships within entities and between entities
- Considerations when constructing individual glyphs should include
- What data is the glyph going to contain
- What is the range of each data element (max min mean mode etc) that is going to be mapped to each glyph element
- Who is the glyph for… different levels of understanding of the data should influence the glyph design and levels of complexity
- How many glyphs will be grokked at the same time? 10 100 10,000
Considerations for grouping glyphs
- Geospatial - temporal spatial .
- Topic specific spatialization
- Design for the masses --- lowest common denominator
- Design for the experts -- assume a level of understand of the problem/data/info being glyphed
- Designed to make anomalies stand out
- Designed to make differences stand out
Other glyph considerations
- Choices of topologies - what considerations go into picking a topo?
- Are there default choices ? --ie done without needing to specificy
- Choices of geometries
- Basic geometries
- Importing 3D models
- How will that change our glyph design?
- What is a good average scale for each level ie level 2 = ½ of level 1 or ¼ ?
- Level 0
- Level 1
- Number of children
- Spatial arrangement
- Spacing and scale
- Ratios proportions and distribution of glyph elements
- Color palettes and color ranges
- Understanding the hierarchical structure
- Why are the glyph elements arranged the way they are?
- What is the rationale for the arrangement
- Remember you are creating an experience set
- Deterministic structure can be rule specific/ topic specific
- Creating visual lists
- Temporal layout -- time lines vs time rings vs time spiral
- The use of texture maps for disambiguation and categorical distinction
A rationalization for a specific glyph design
- Visualizing a process
- Visualizing a thing
- Visualizing the changes to the thing
- Visualize the processes that change the thing
Example for Discussion: We All Need to Eat! Visualizing Restaurant Data
One of the first attempts at designing a hyperglyph focused on 'hyperglyphing' restaurants. To do this, we considered what kinds of glyphs might be best for restaurant data? To answer this, we need to answer other more specific questions such as “What is it that we want to do?”, “Why do we care?”, “What do we want to know about the data?”, “What is the goal?”.
Do we want to find a good restaurant for just this evening? Find a restaurant to recommend to a friend? Find a restaurant to invest in? If we are trying to find a place to eat this evening, Yelp is one resource many of us turn to. We look for information such as the hours the restaurants are open, there are reviews, and there are 5-star ratings (which is a pseudo-glyph itself). We typically have access to a menu. Yelp also provides a map and offers data on the following parameters which are not food-related:
- Take-out
- Accepts Credit Cards
- Accepts Apple Pay
- Parking
- Bike Parking
- Wheelchair Accessible
- Wi-Fi
Yelp is most effective for me when I have a particular type of restaurant in mind, or when I have a particular location in mind, or both. Do we ever have a problem working within these well-defined but somewhat limited constraints? Does Yelp sometimes fail us? If not, do we really need a glyph? If so, what would those situations be which really call for immersive 3D hyperglyph visualizations of restaurant data? Investors looking for investments? Competitors looking to gain an advantage? It may even be true that the display of restaurant data using glyphs might lend itself to freeform exploratory restaurant searching. Who are the users in this case? Why do they care? What do they want to know about the data? Human- and activity-centered design must work together iteratively using a successive approximation model that includes both the designers and users in order to optimize glyph design.