CalCOFI Data Visualization
Data
This visualization consists of data from the California Coastal Ocean Fisheries Investigations. I converted it to a CSV format file for this visualization.
Download the CalCOFI CSV dataset for this visualization.
Visualization
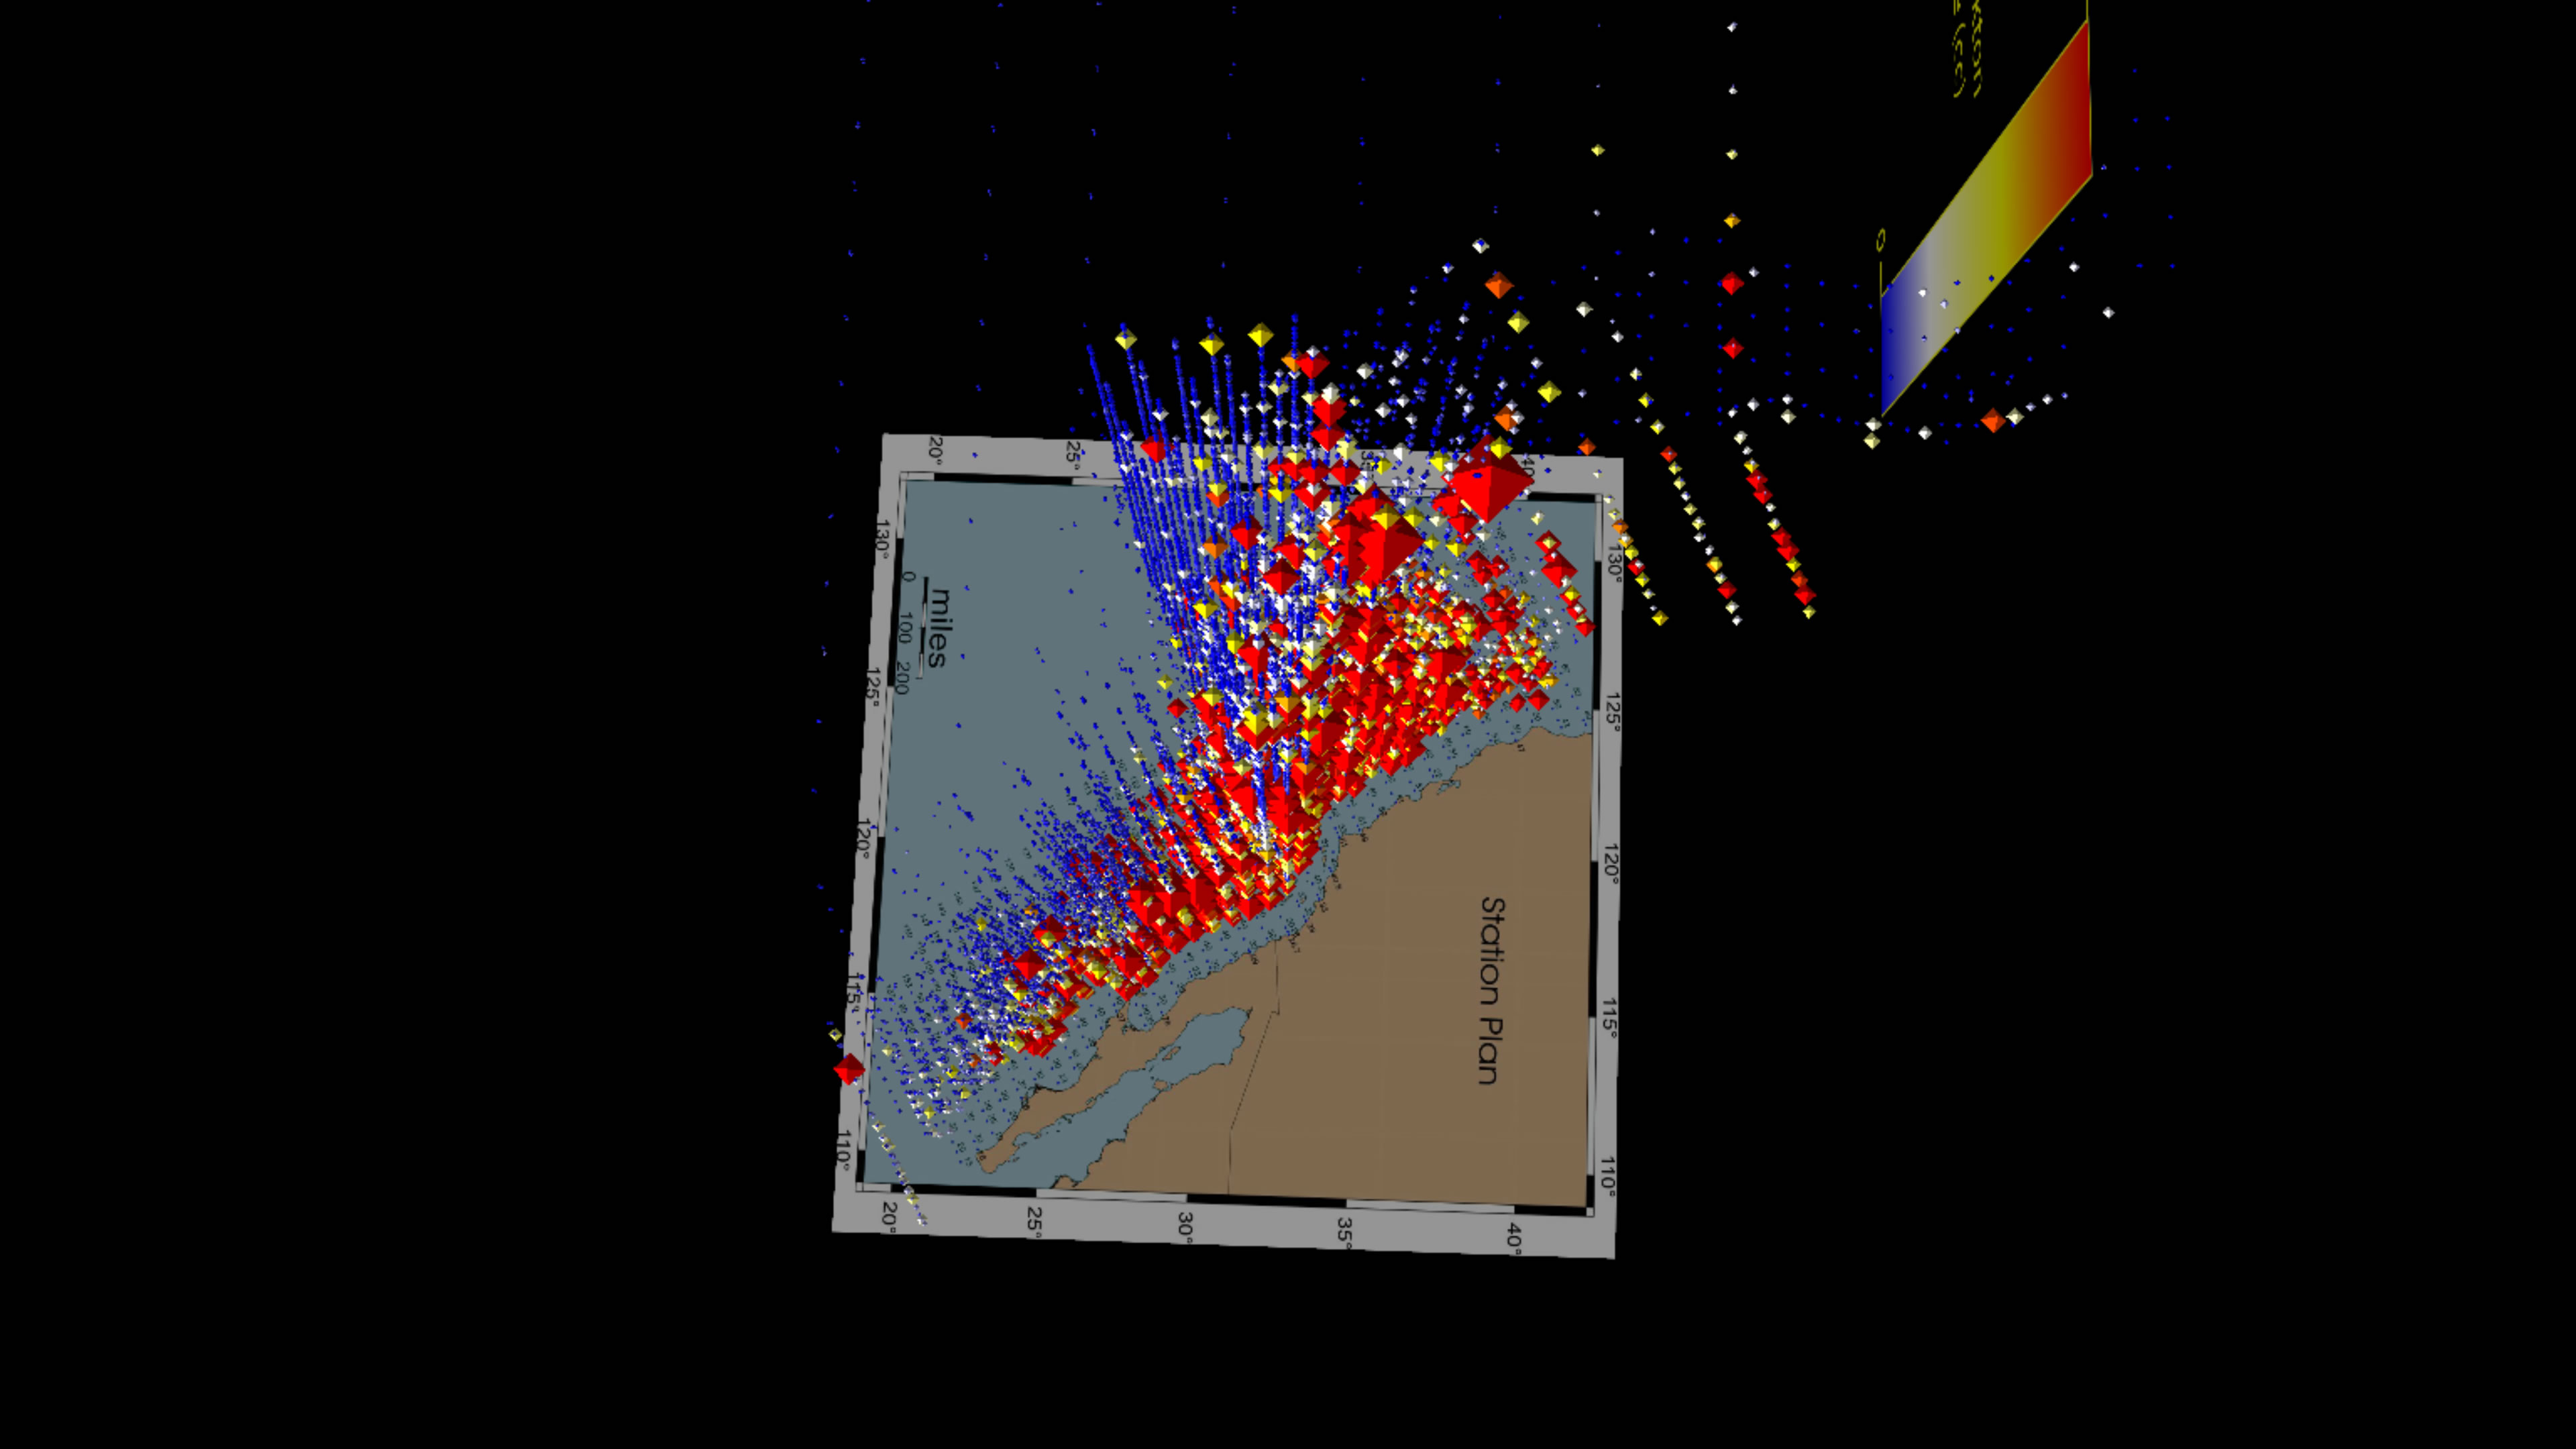
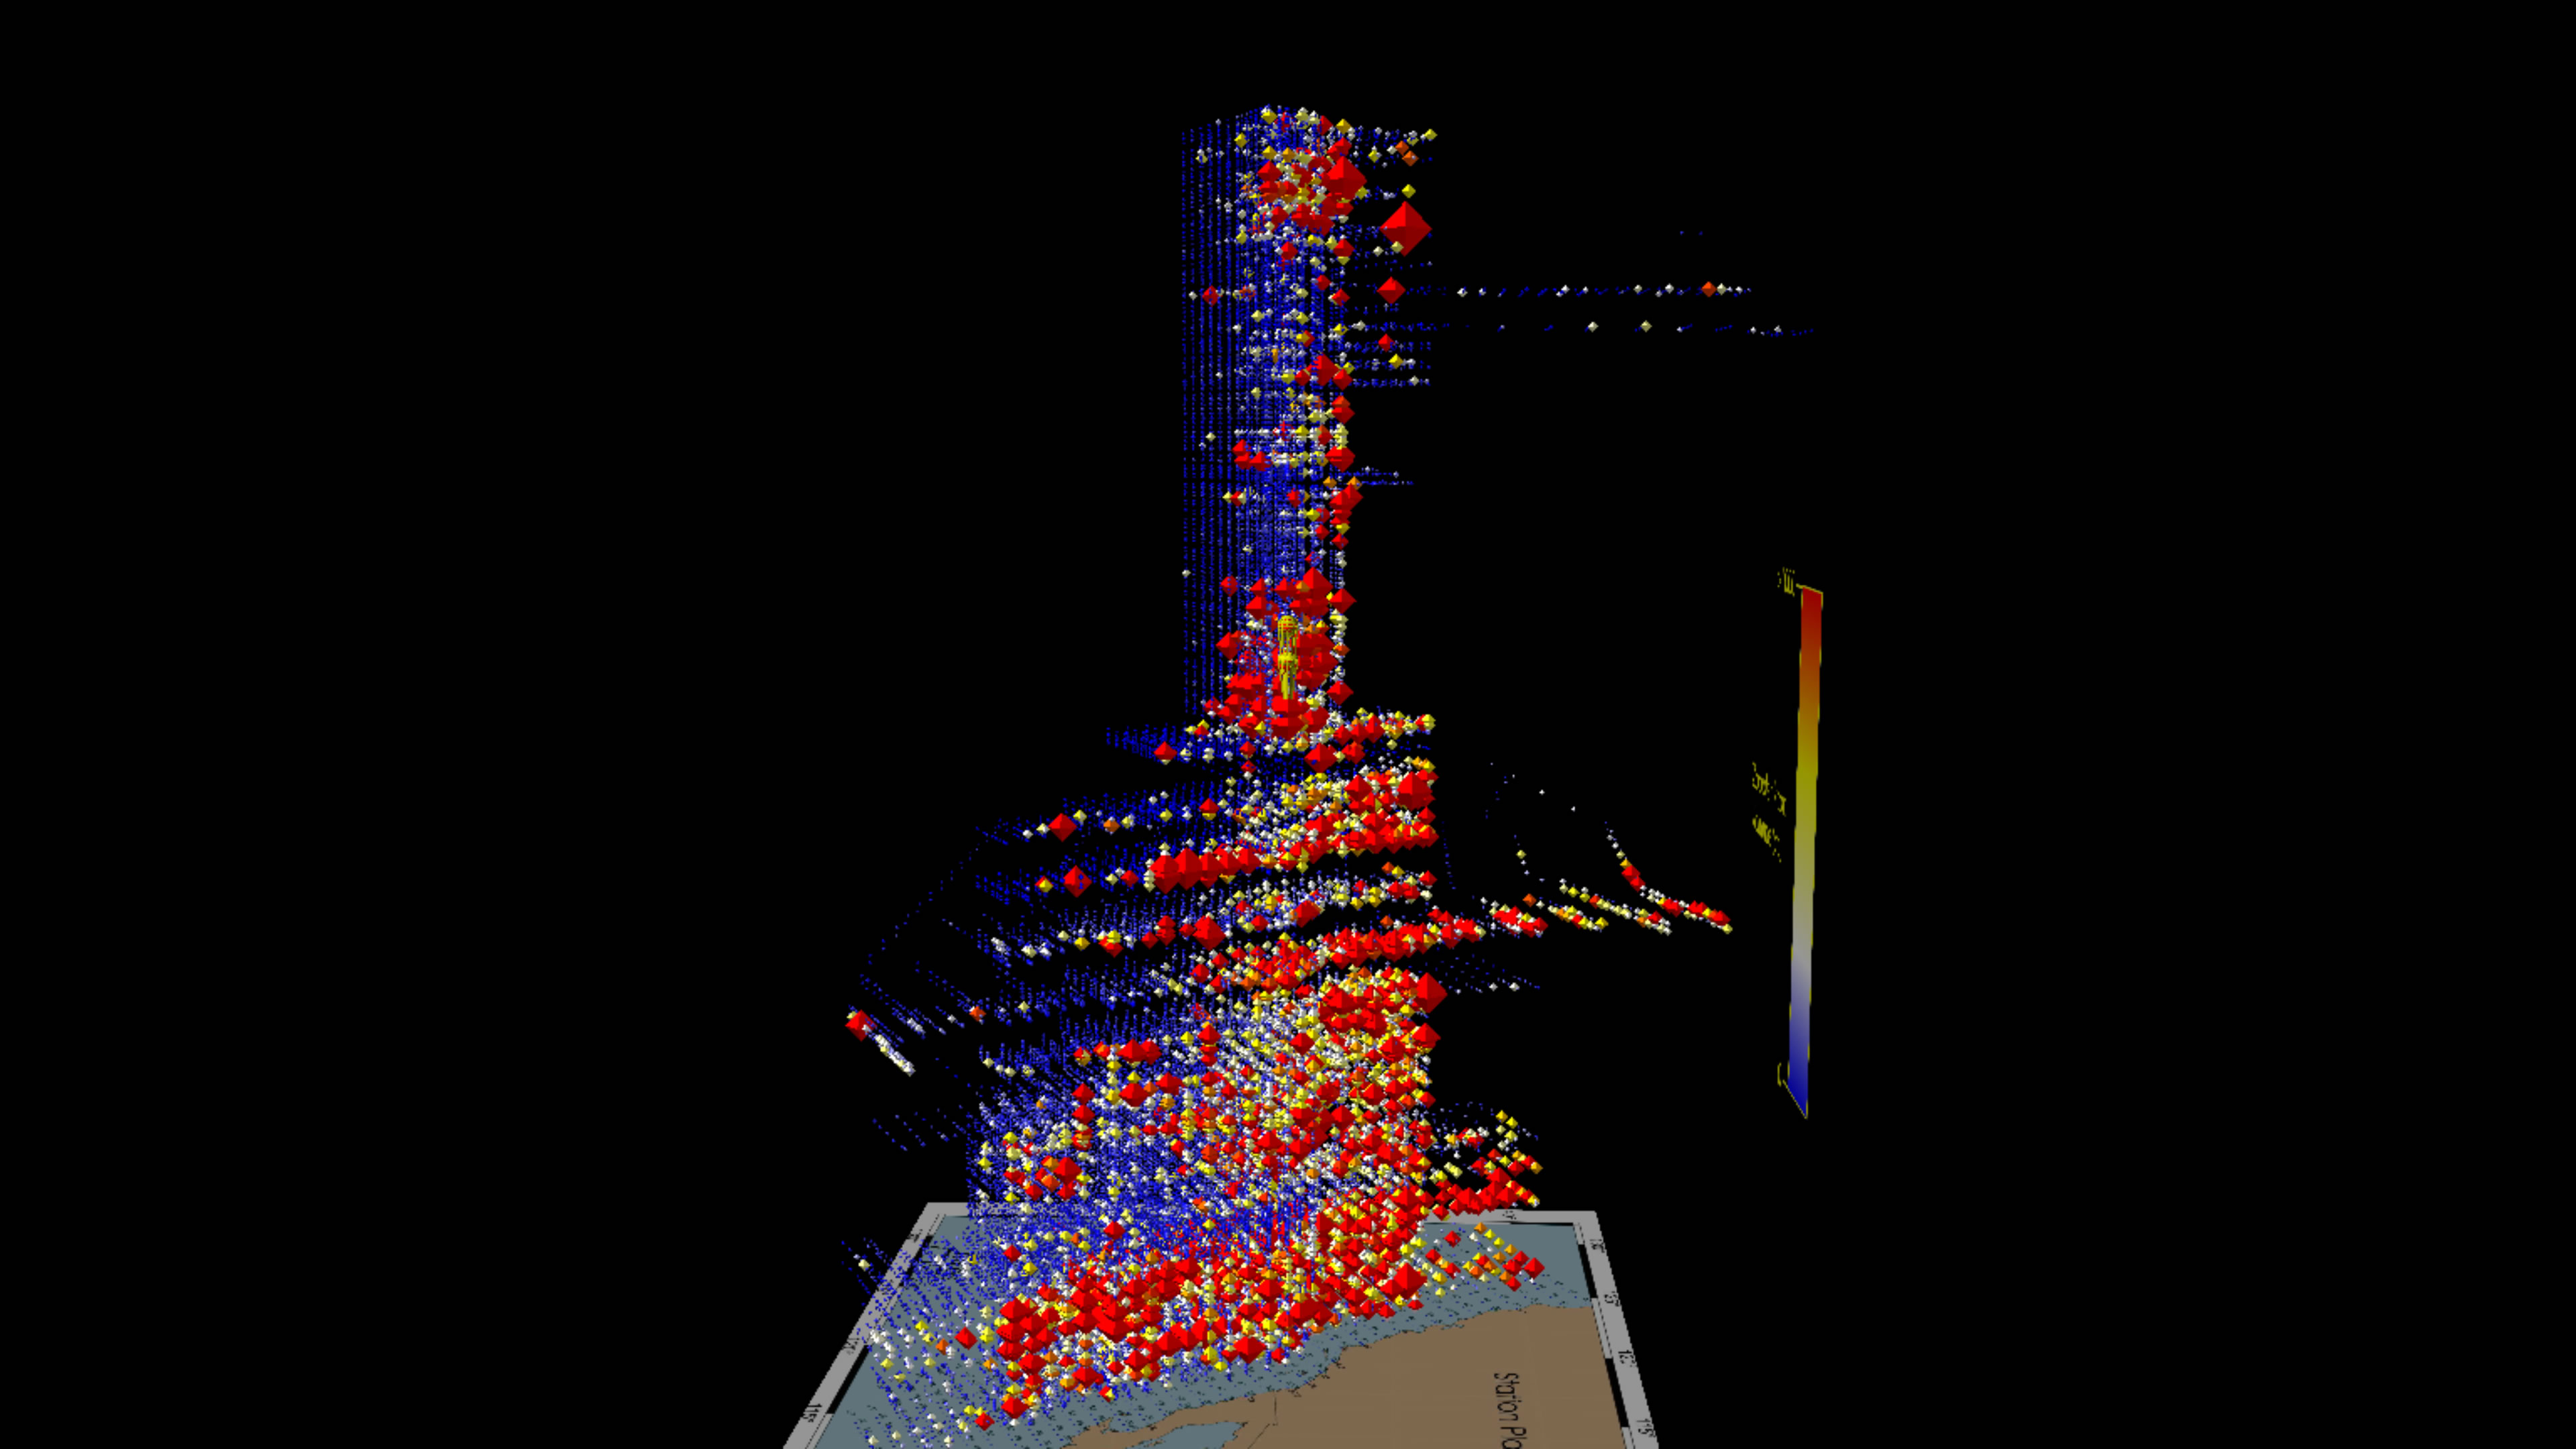
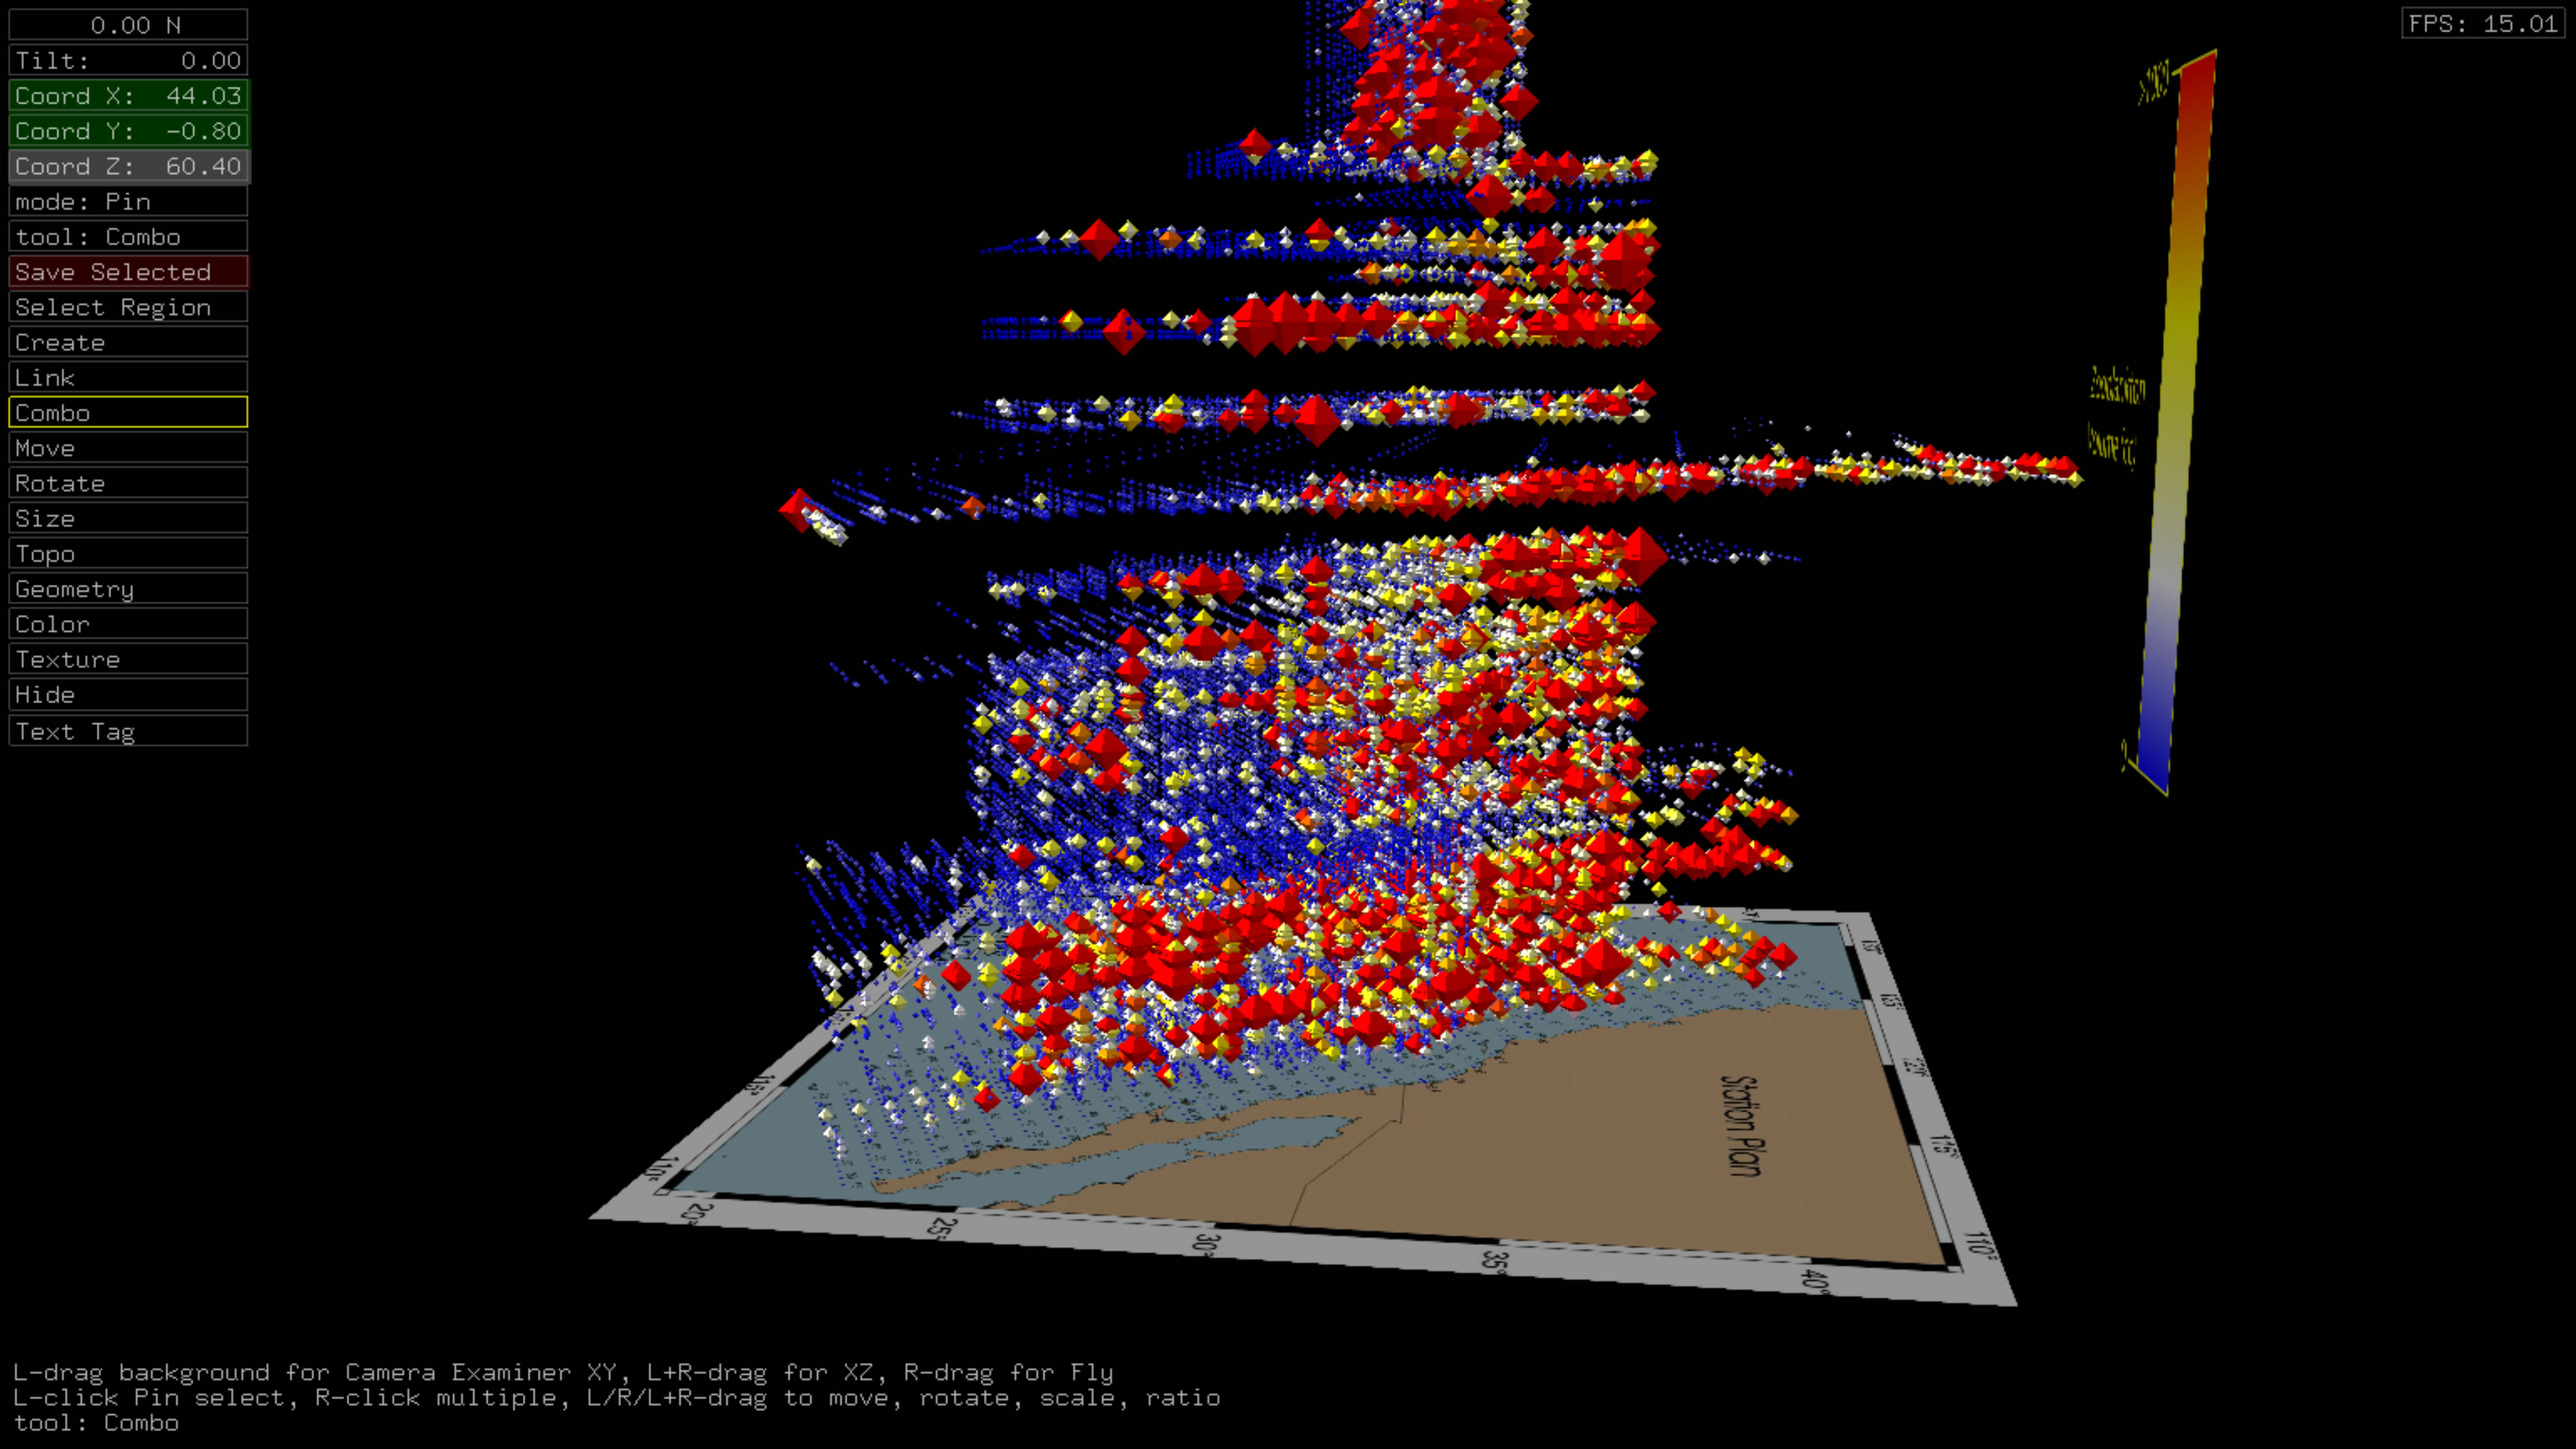
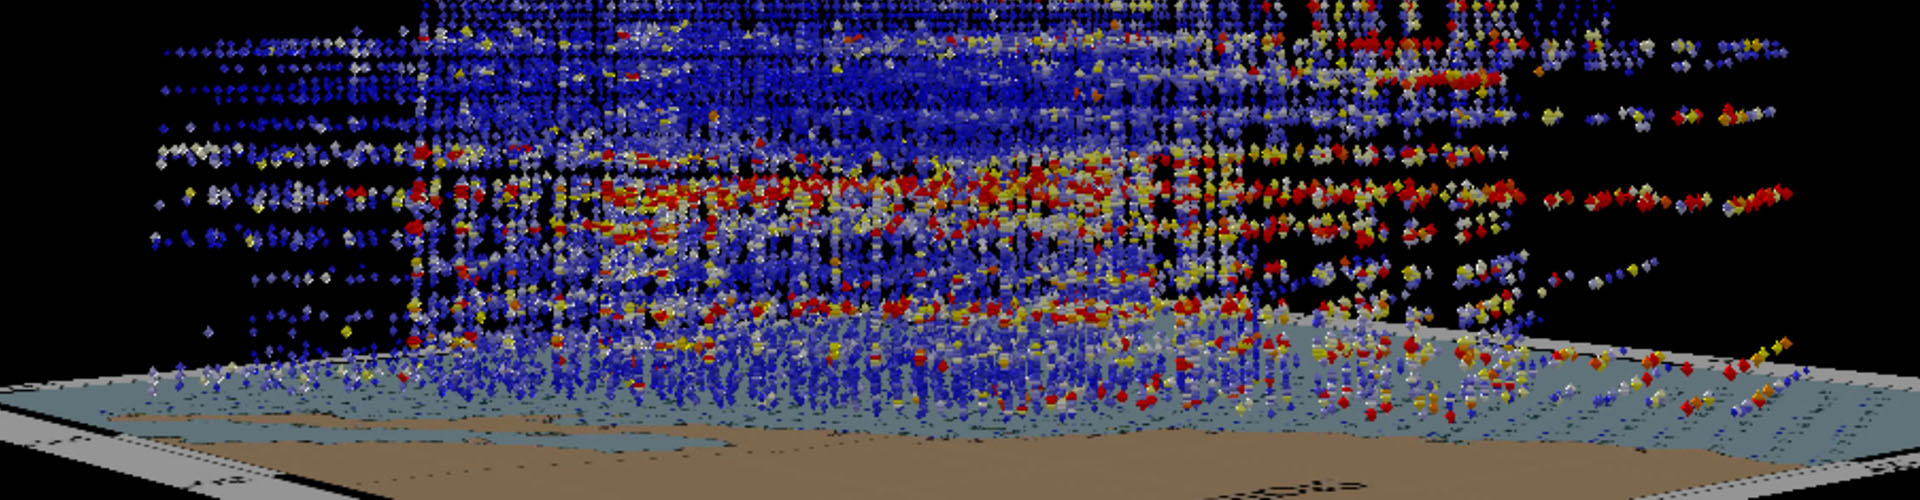
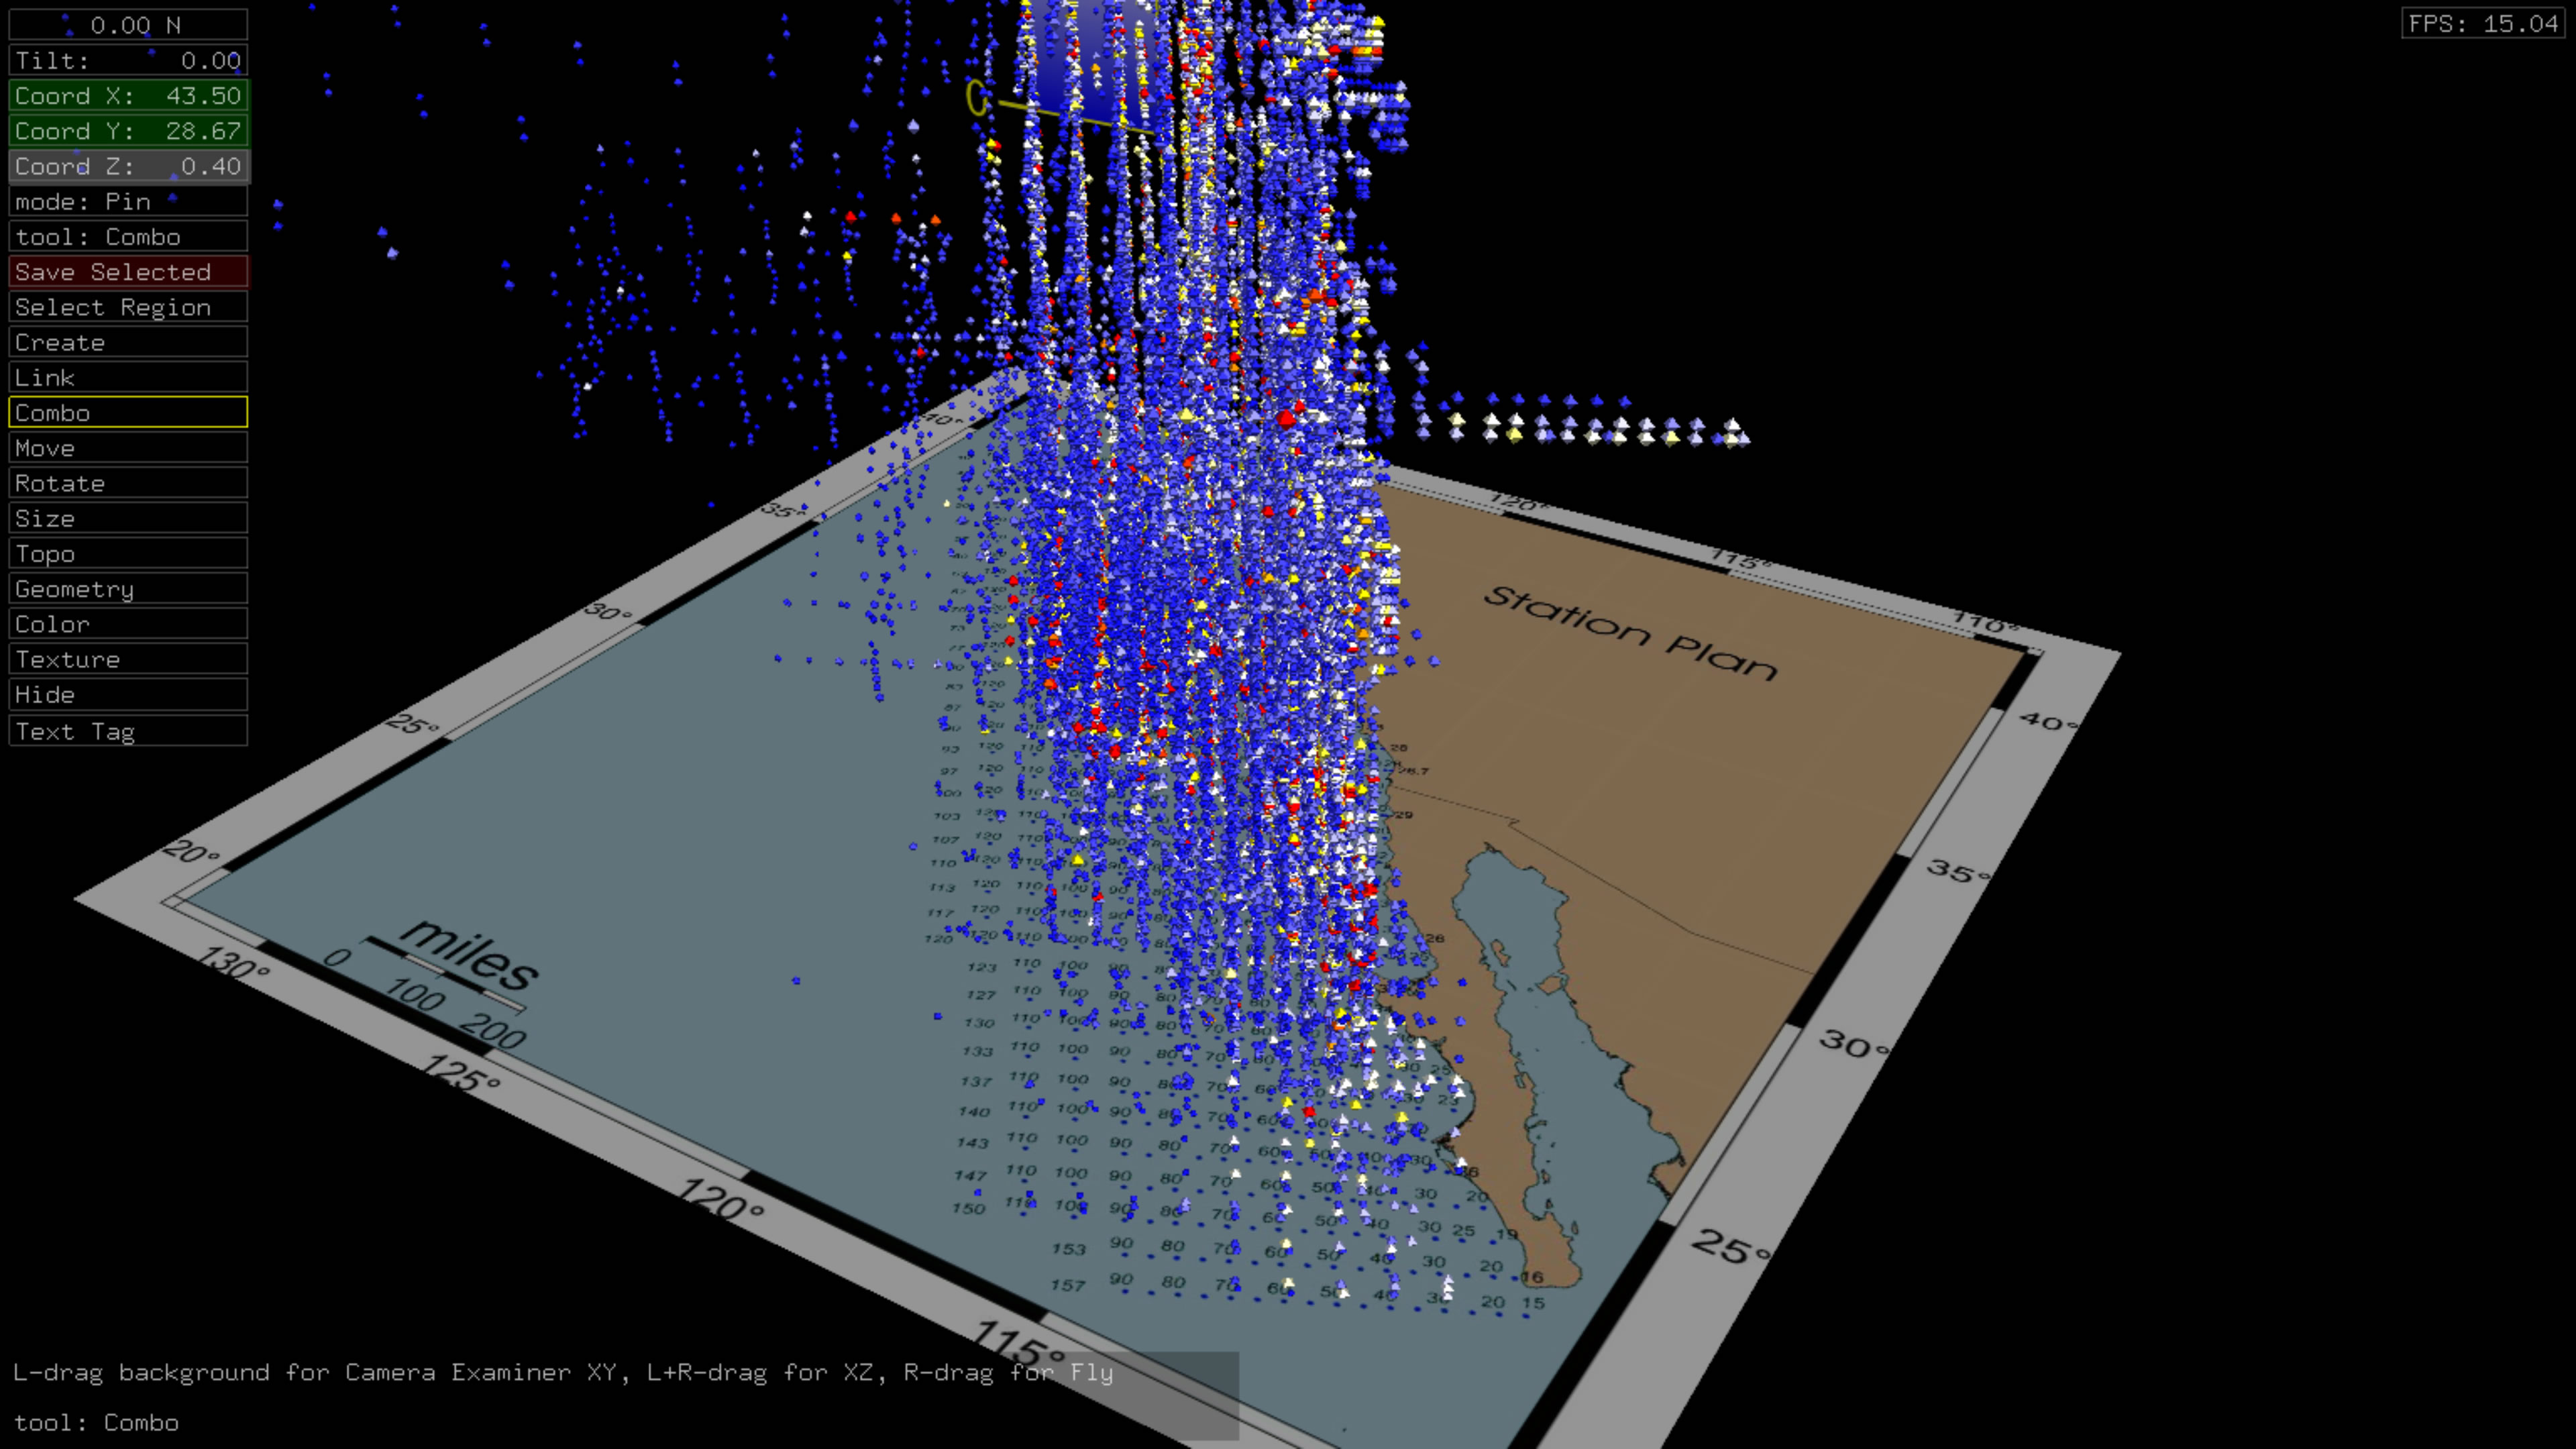
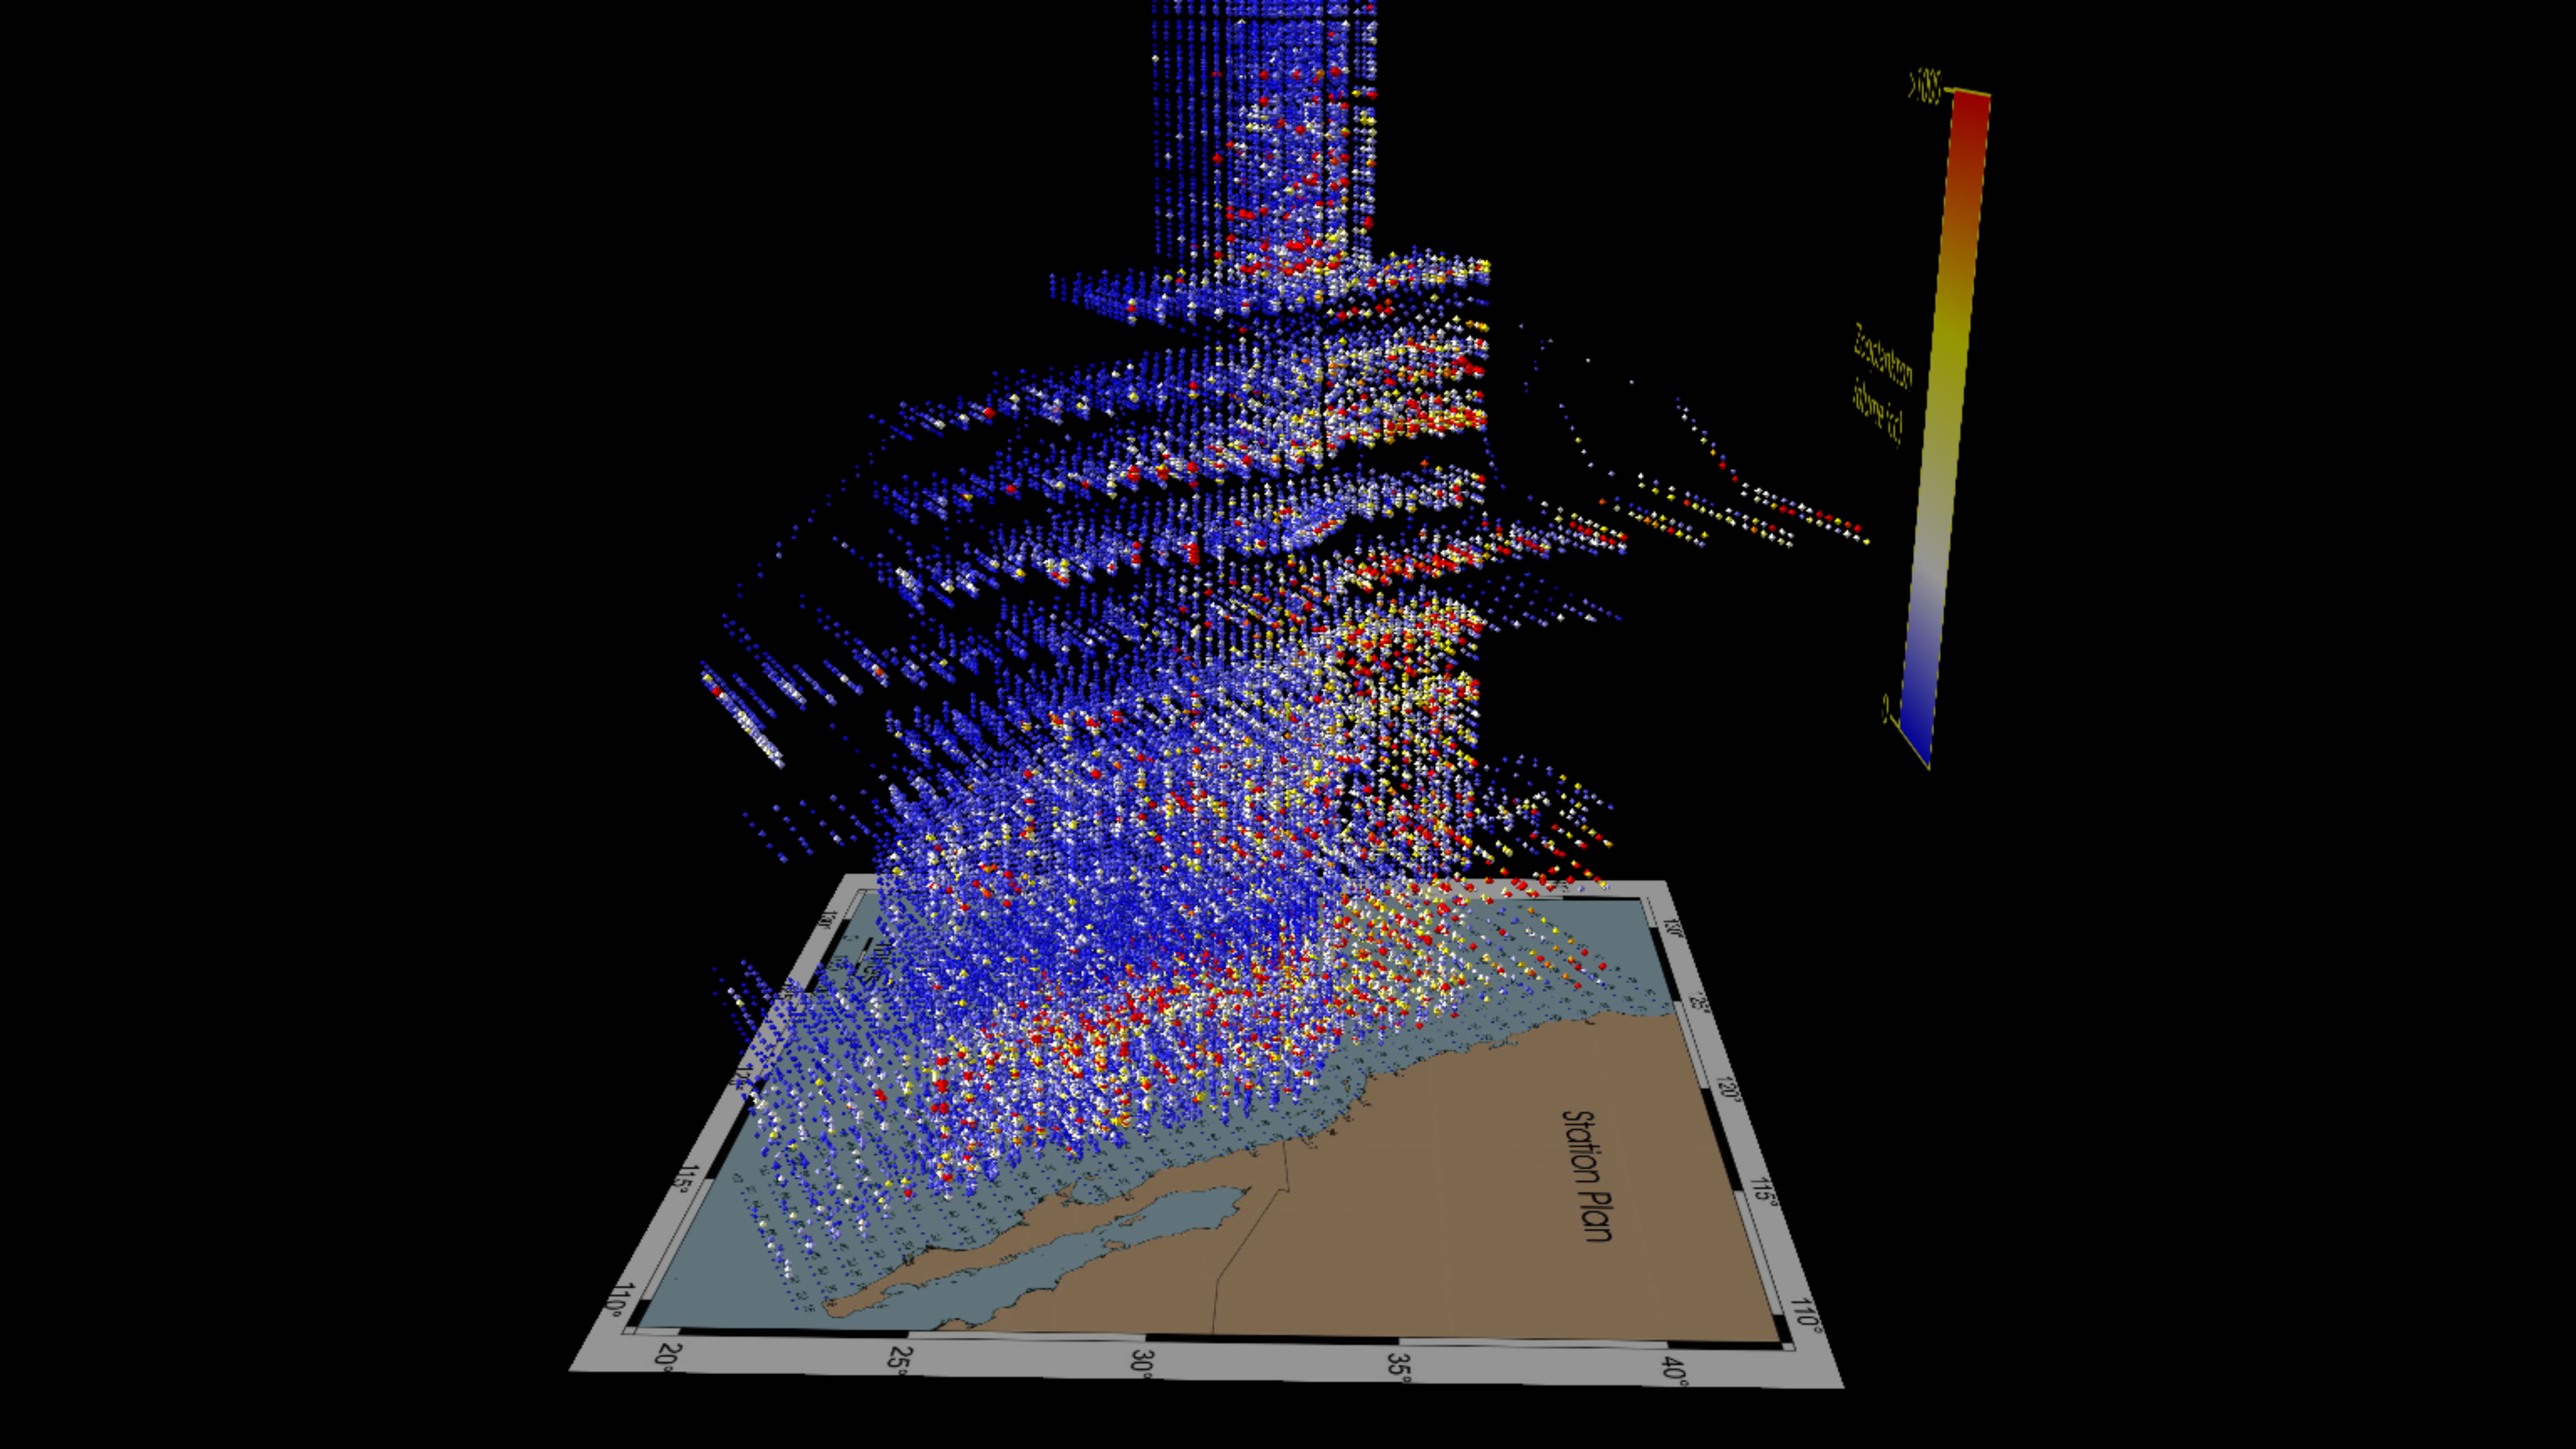
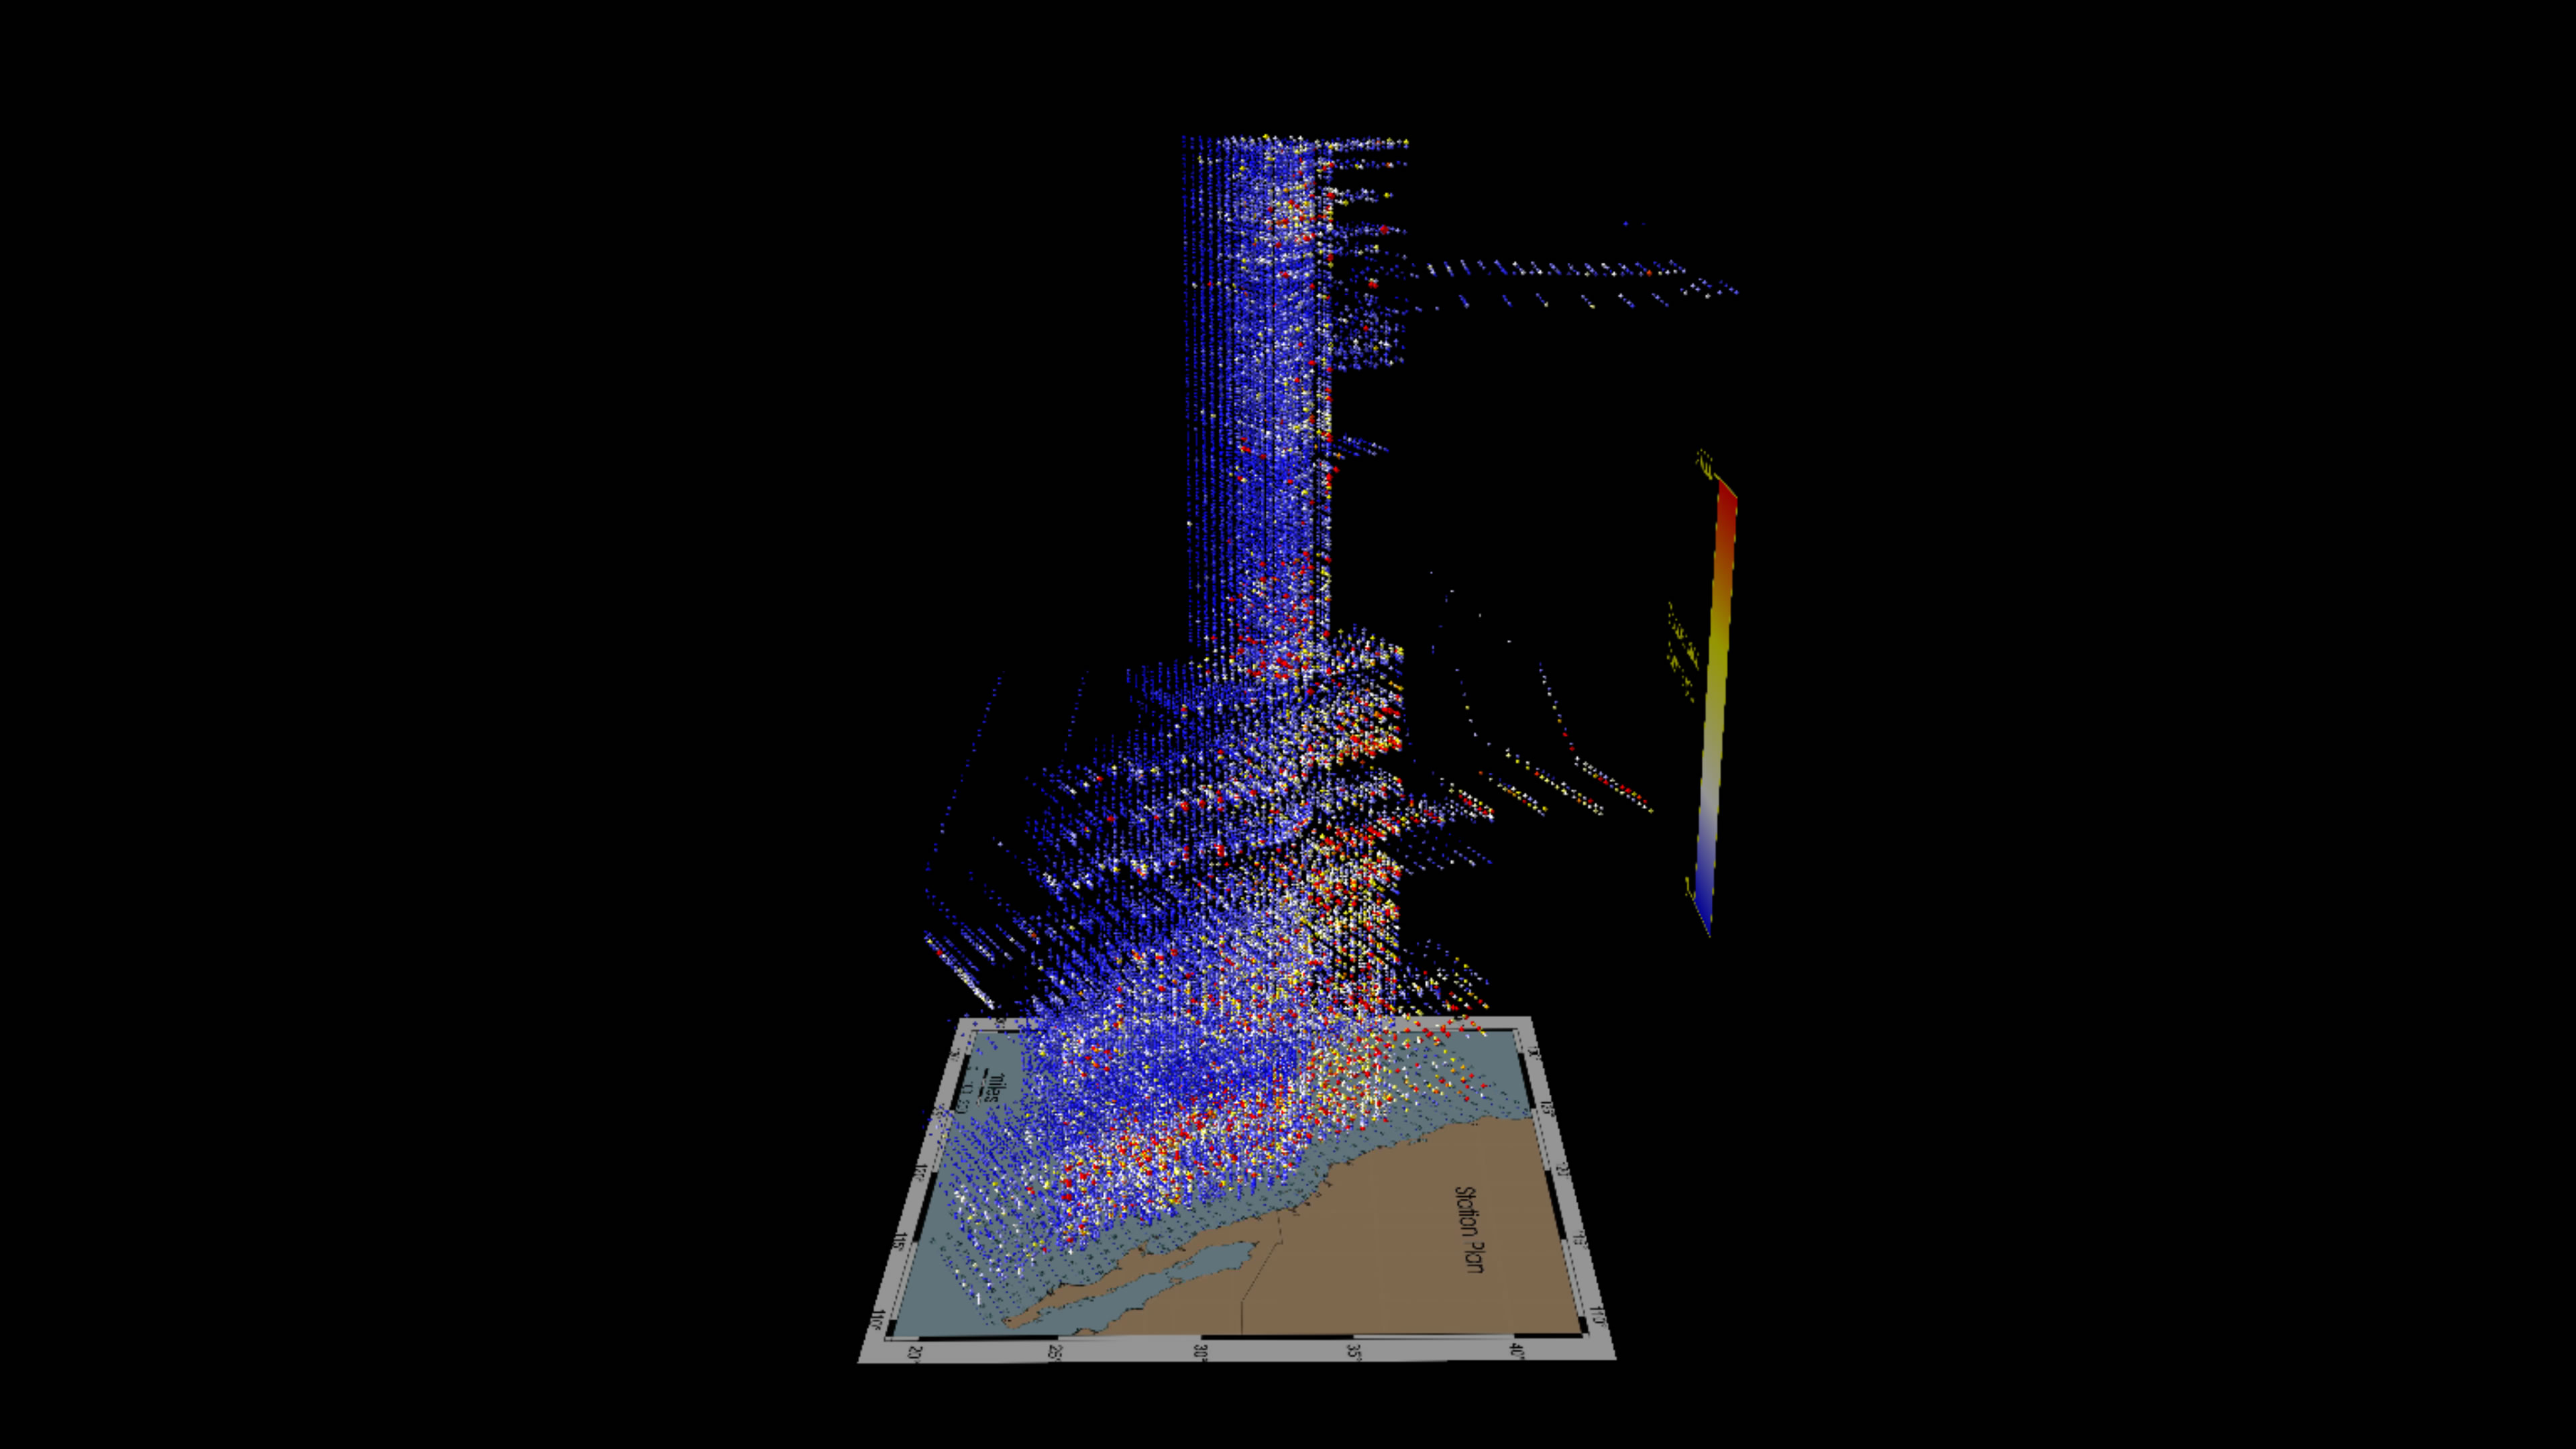
Object size and color are both correlated with zooplankton value.
Download a Windows version of the ANTz visualization for scale factor variation 1.
Download a Windows version of the ANTz visualization for scale factor variation 2.
For Mac OS X users, download the generic Mac OS X version and the Windows version and swap the usr folder from the Windows version with the usr folder for the Mac version.
Scale Variation 1
This version uses the log of the value for zooplankton biomass resulting in object size variation being less pronounced.
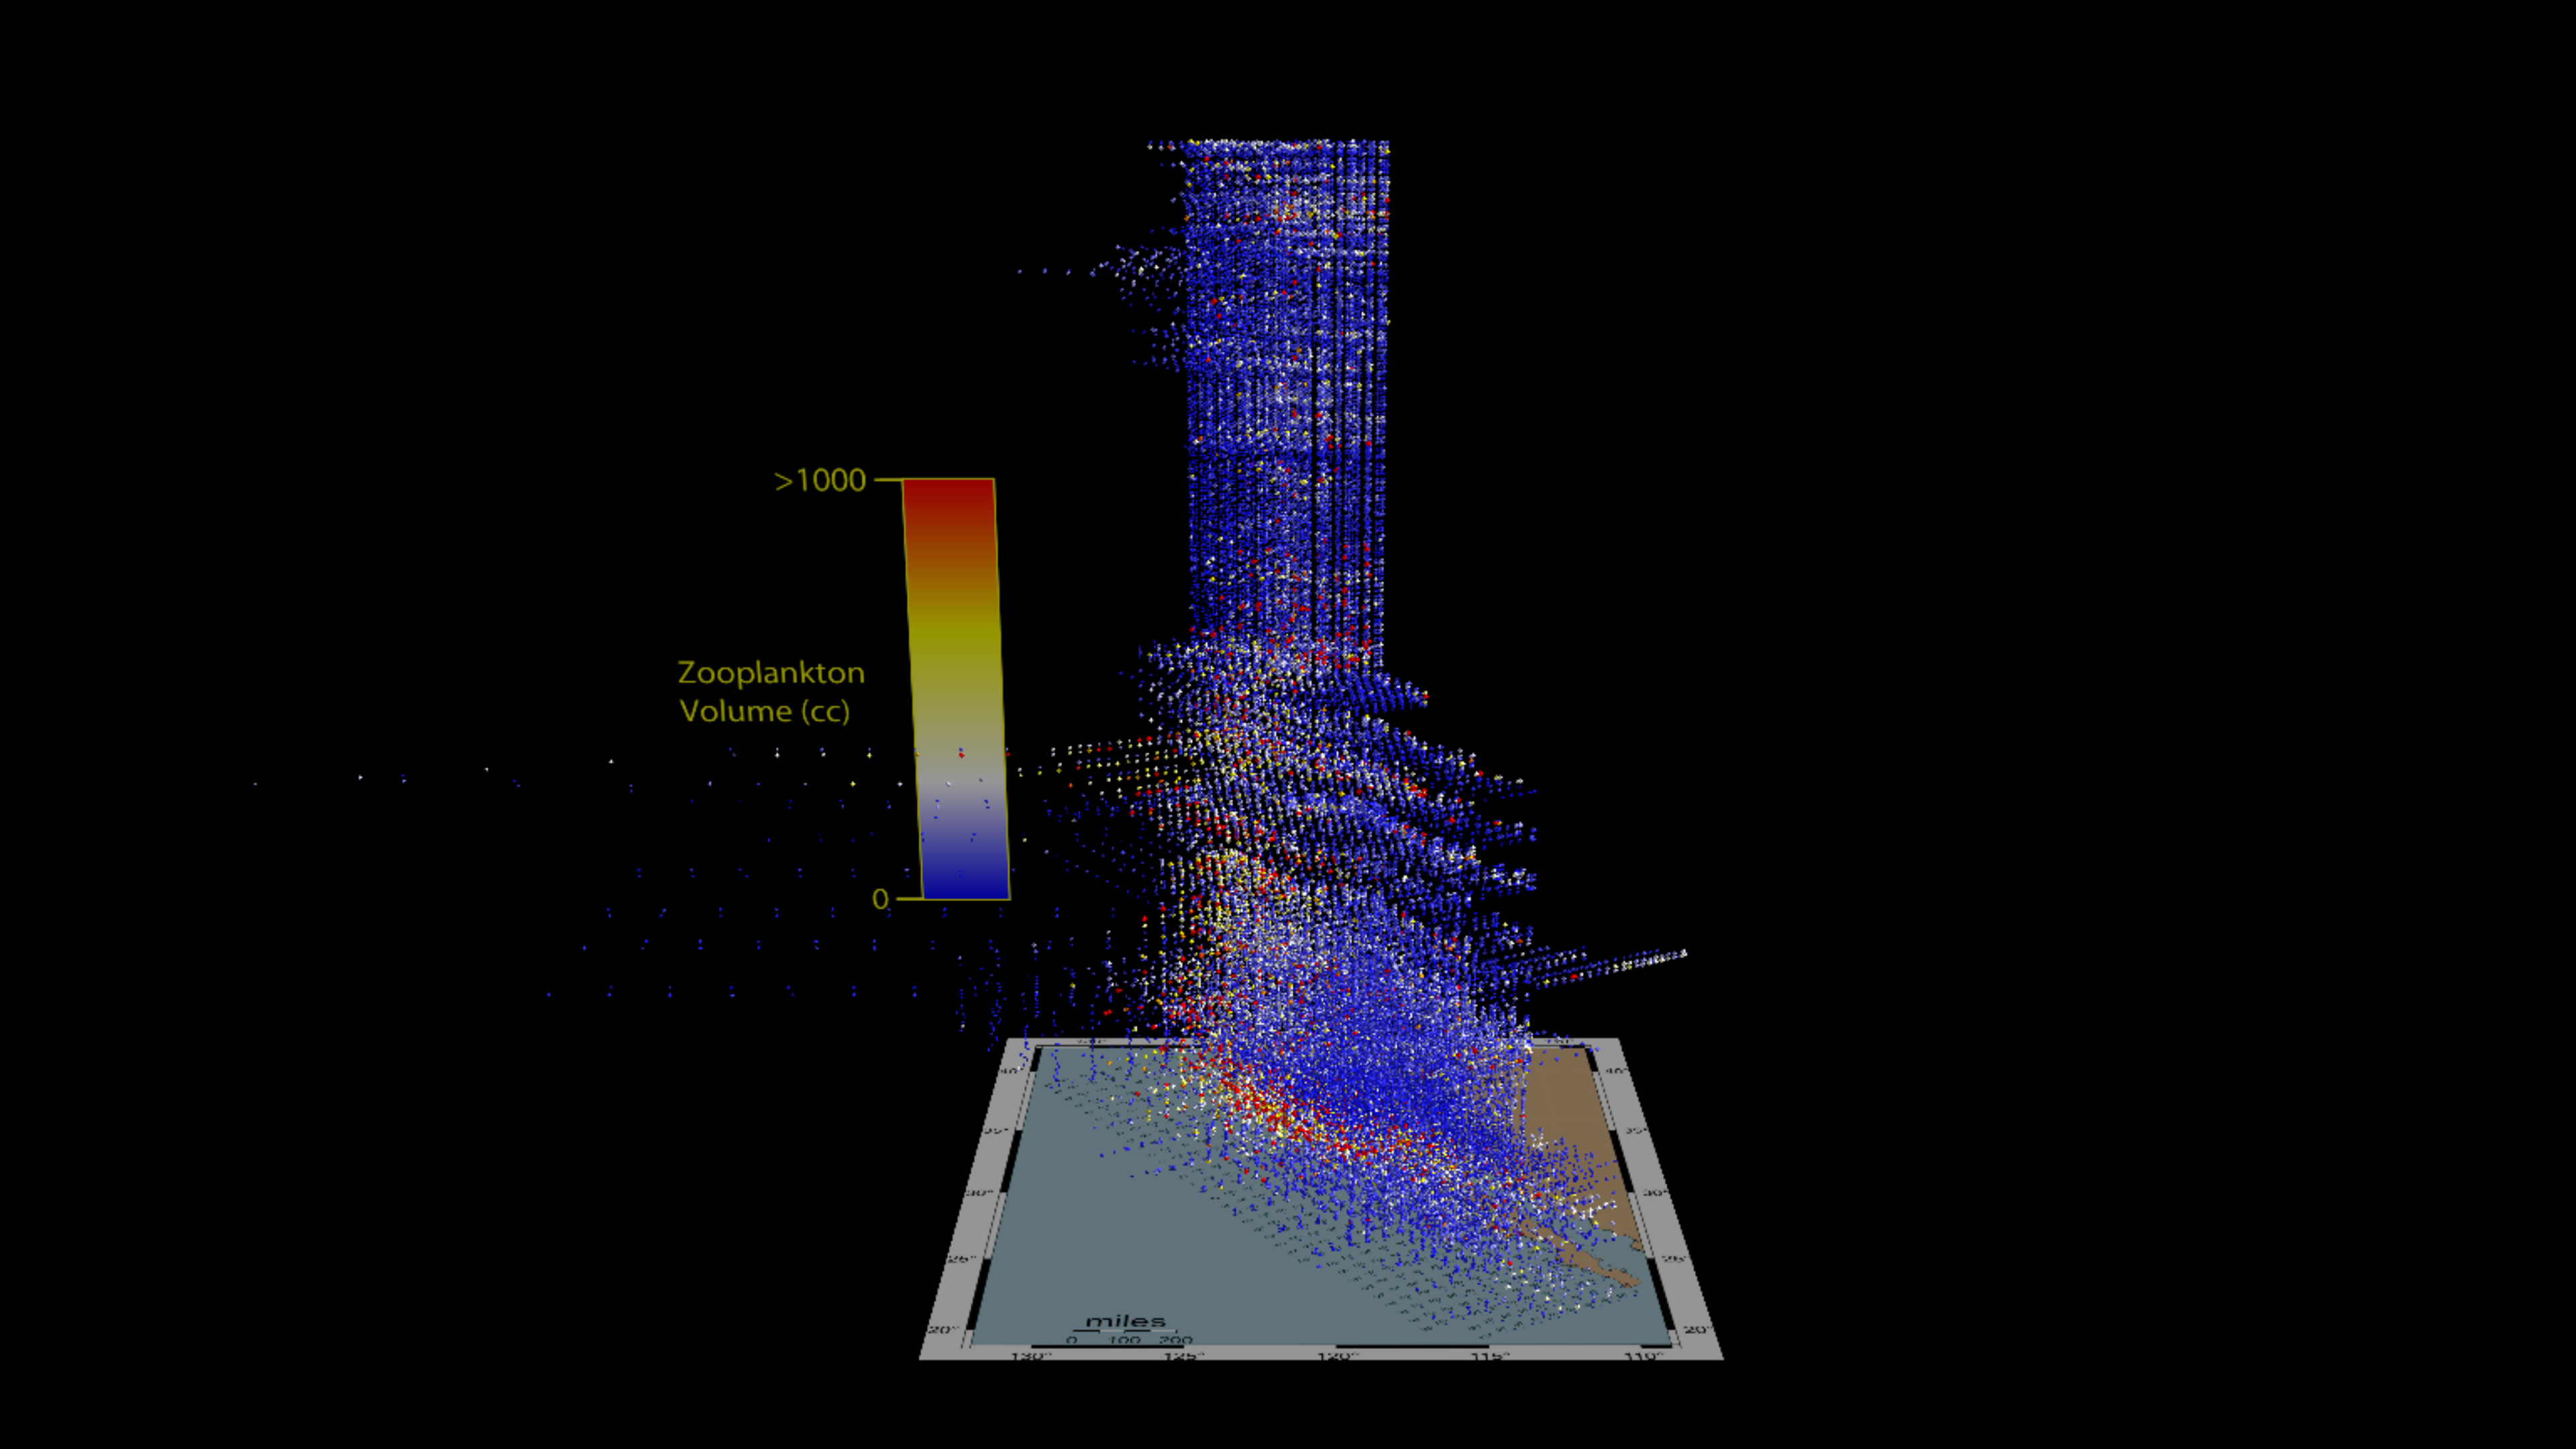
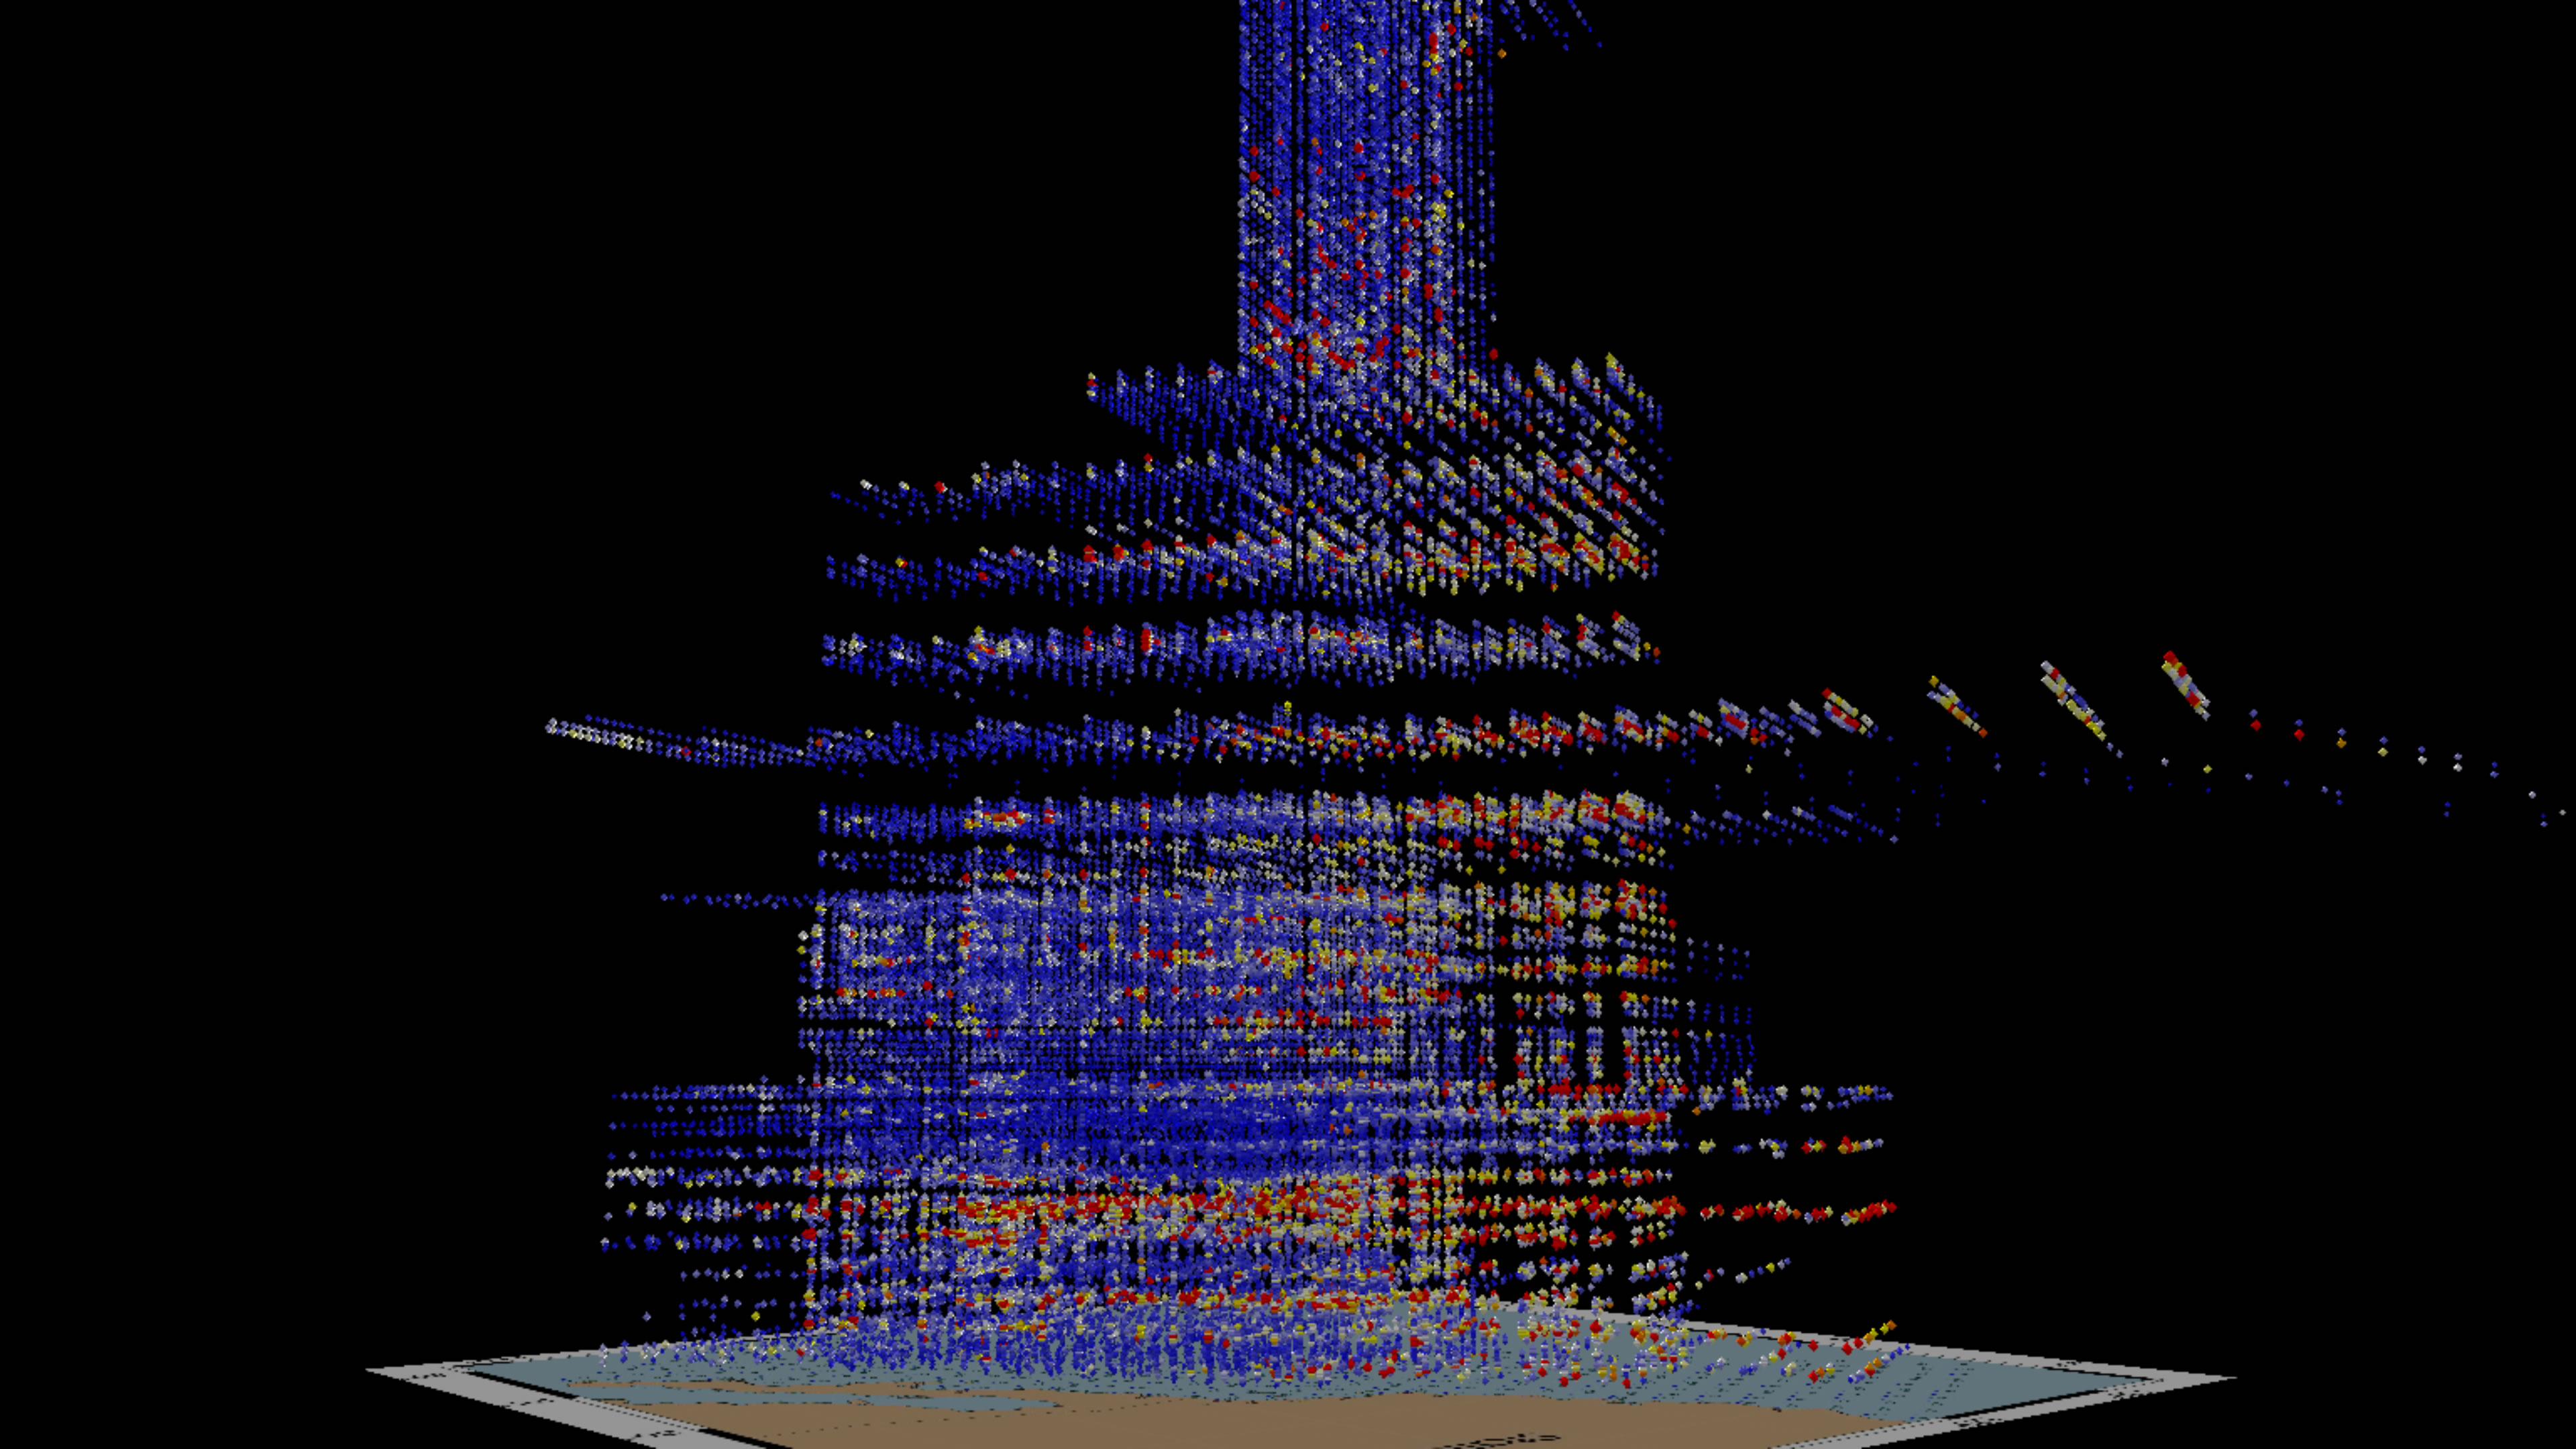
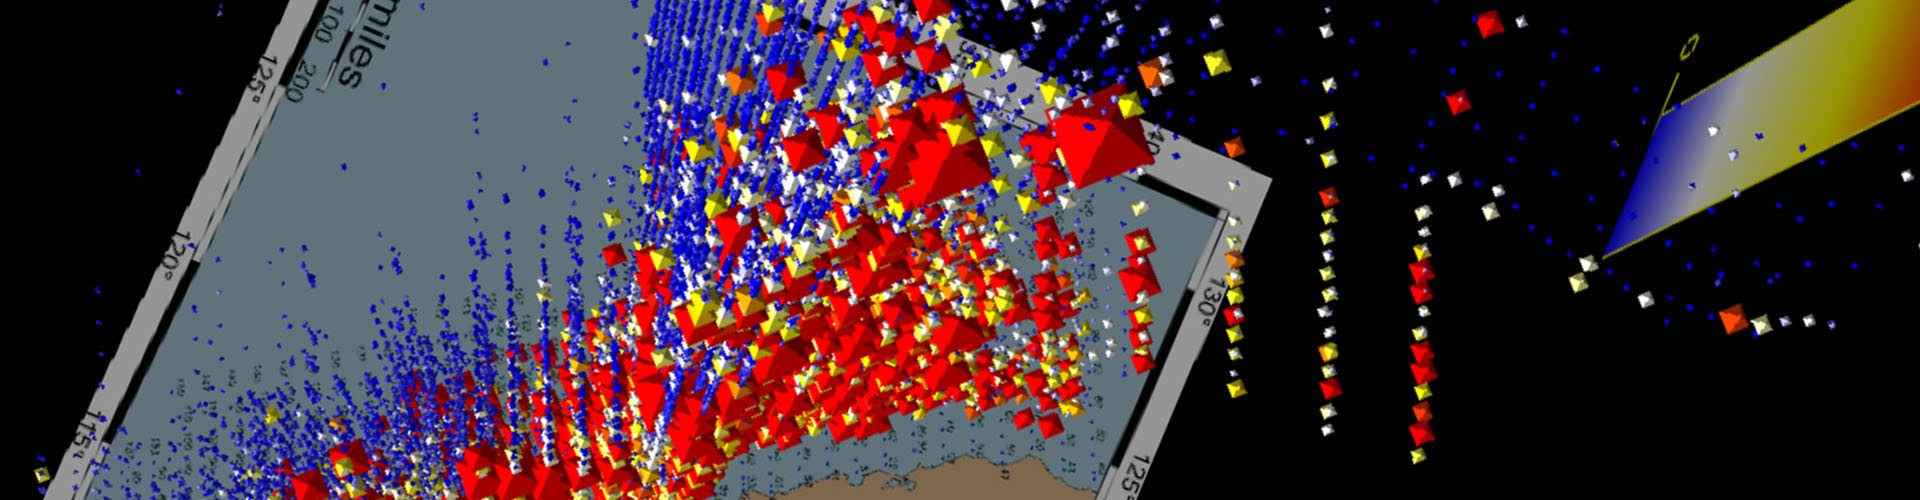
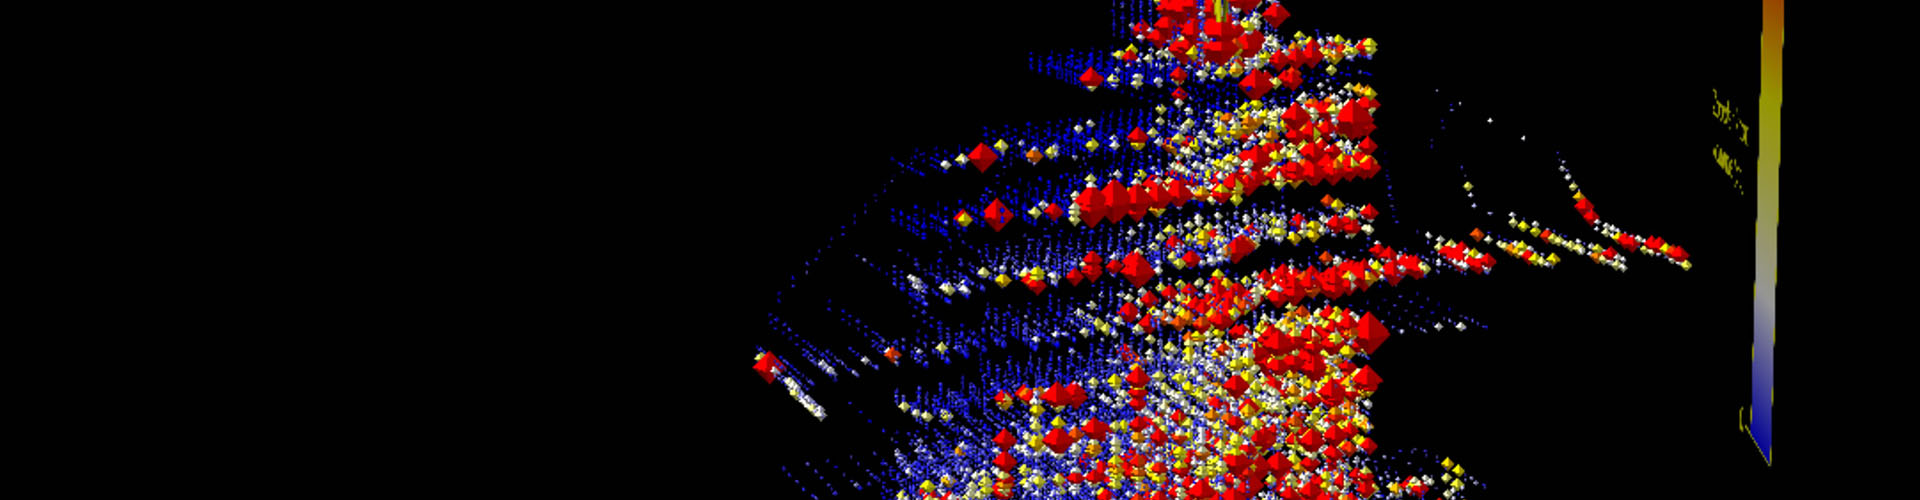
Scale Variation 2
This scale variation uses the raw values for zooplankton biomass with an added scale factor to adjust object size to a reasonable value. This scale variation results in spatiotemporal regions of high biomass becoming more obvious.