The high-level objective of this research was to enhance our understanding of how disinformation is generated, amplified and subsequently spreads through online spaces.
[This work was funded by the Office of Naval Research (Grant N-00014-18-1-2012). Thanks to co-PIs Jen Zeimke and Kate Starbird, with additional acknowledgement to Dave Warner, Robert Alexander, Peter Raymond, Mike Winters, and the rest of the team who made such important contributions. ]
We aimed to apply new techniques for data discovery and information triage to help illuminate diagnostic patterns of deceptive and hostile information campaigns in order to develop perceptual tools for intuitive identification of social media patterns and trends in support of US and NATO military-relevant strategic communication needs and requirements.
1) developed tools, processes, and an approach for collecting and analysing “big” social data. Using the Twitter Search and Streaming API we generated 17 new collections on new hashtag topics including:
2) Developed a first-of-its kind heuristic approach and methodology for the analysis of any large dataset using multimodal perceptual tools.3) Surfaced new insights about the spread of disinformation in our datasets, specifically by:
-
Deploying multi-dimensional representations of information we were able to help:
-
distinguish between different kinds of rumor signatures (deliberate campaigns vs. conventional rumors)
-
identify temporal trends and trajectories of coordinated accounts
-
detect coordinated activity (automated and troll accounts), including pre-event activity in places like #idlib [aka “watering the garden”]
-
surface previously inaccessible insights and reduce cognitive load (real time auditory alerts for changes to a real time data stream (twitter sonification)
-
Consultant progress updated in weekly virtual team meetings
5) Developed tools, processes, and an approach for collecting and analysing “big” social data. Using the Twitter Search and Streaming API we generated 17 new collections on new hashtag topics including:
Collection |
# Tweets |
API |
Date |
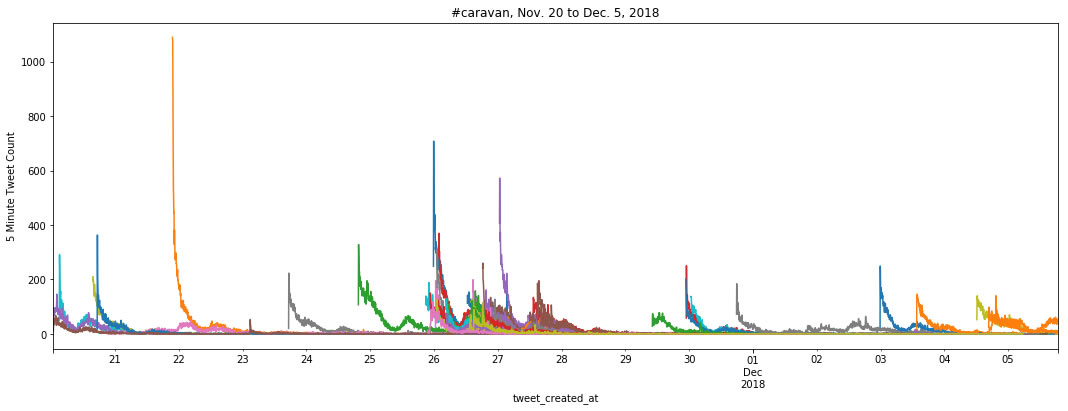
#caravan |
2657637 |
Streaming |
Nov. 20 to Dec. 4, 2018 |
#muellerreport - set 1 |
1250871 |
Streaming |
Mar. 18 to Apr. 9, 2019 |
#muellerreport - set 2 |
1236849 |
Streaming |
Apr. 9 to 20, 2019 |
#idlib |
101655 |
Search |
Sep. 13 to Oct. 24, 2018 |
#lyincomey |
110920 |
Search |
Apr. 12 to Apr. 24, 2018 |
#worldcup |
73913 |
Search |
June 27 to July 5, 2018 |
#iran OR #israel |
28443 |
Search |
May 10 to May 13, 2018 |
#trumpcolluded |
179004 |
Search |
May 17 to June 5, 2018 |
#skripal |
66755 |
Search |
Apr. 5 to Apr. 12, 2018 |
#ghouta OR #afrin OR #syria |
142618 |
Search |
Mar. 19 to Apr. 3, 2018 |
#2018midterms |
85770 |
Search |
July 5 to July 14, 2018 |
#qanon |
39552 |
Search |
May 13 to 17, 2018 |
#douma |
|||
#whitehelmets |
|||
#manaforttrial |
122438 |
Search |
July 28 to Aug. 10, 2018 |
2) Developed a first-of-its kind heuristic approach and methodology for the analysis of any large dataset using multimodal perceptual tools.
Rain Clouds Gather
Analysis start point - tracing the heuristic approach
Example - #ghouta OR #afrin OR #syria
Twitter Search API 'Bullet' Artifact Detection
#2018midterms dataset analysis.
Tweet Timelines and Sonification
On top of all other trends, what we need to know as a kind of community baseline: A new viral tweet essentially pushes out the older one as we are collectively ADHD for the shiny new bird.
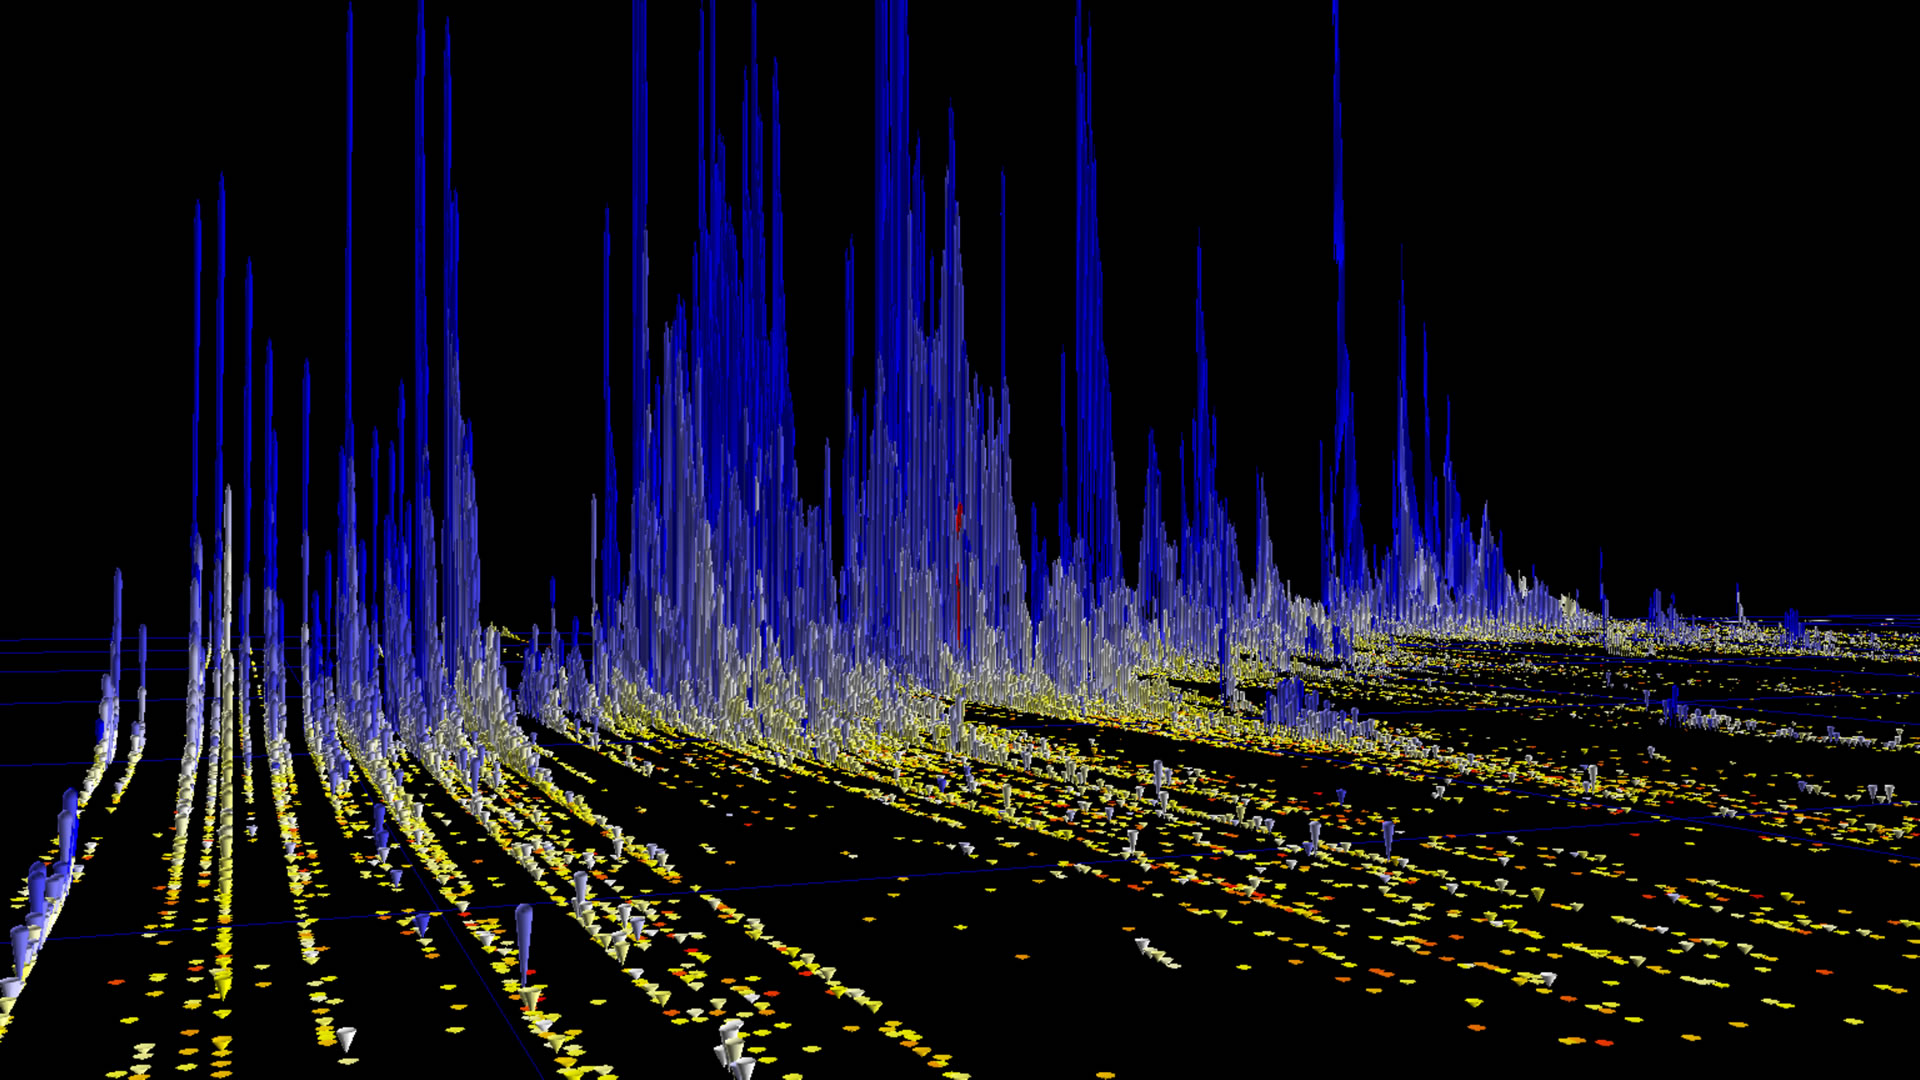
Twitter User Tweet 'Timeline Towers' Visualization & Sonification
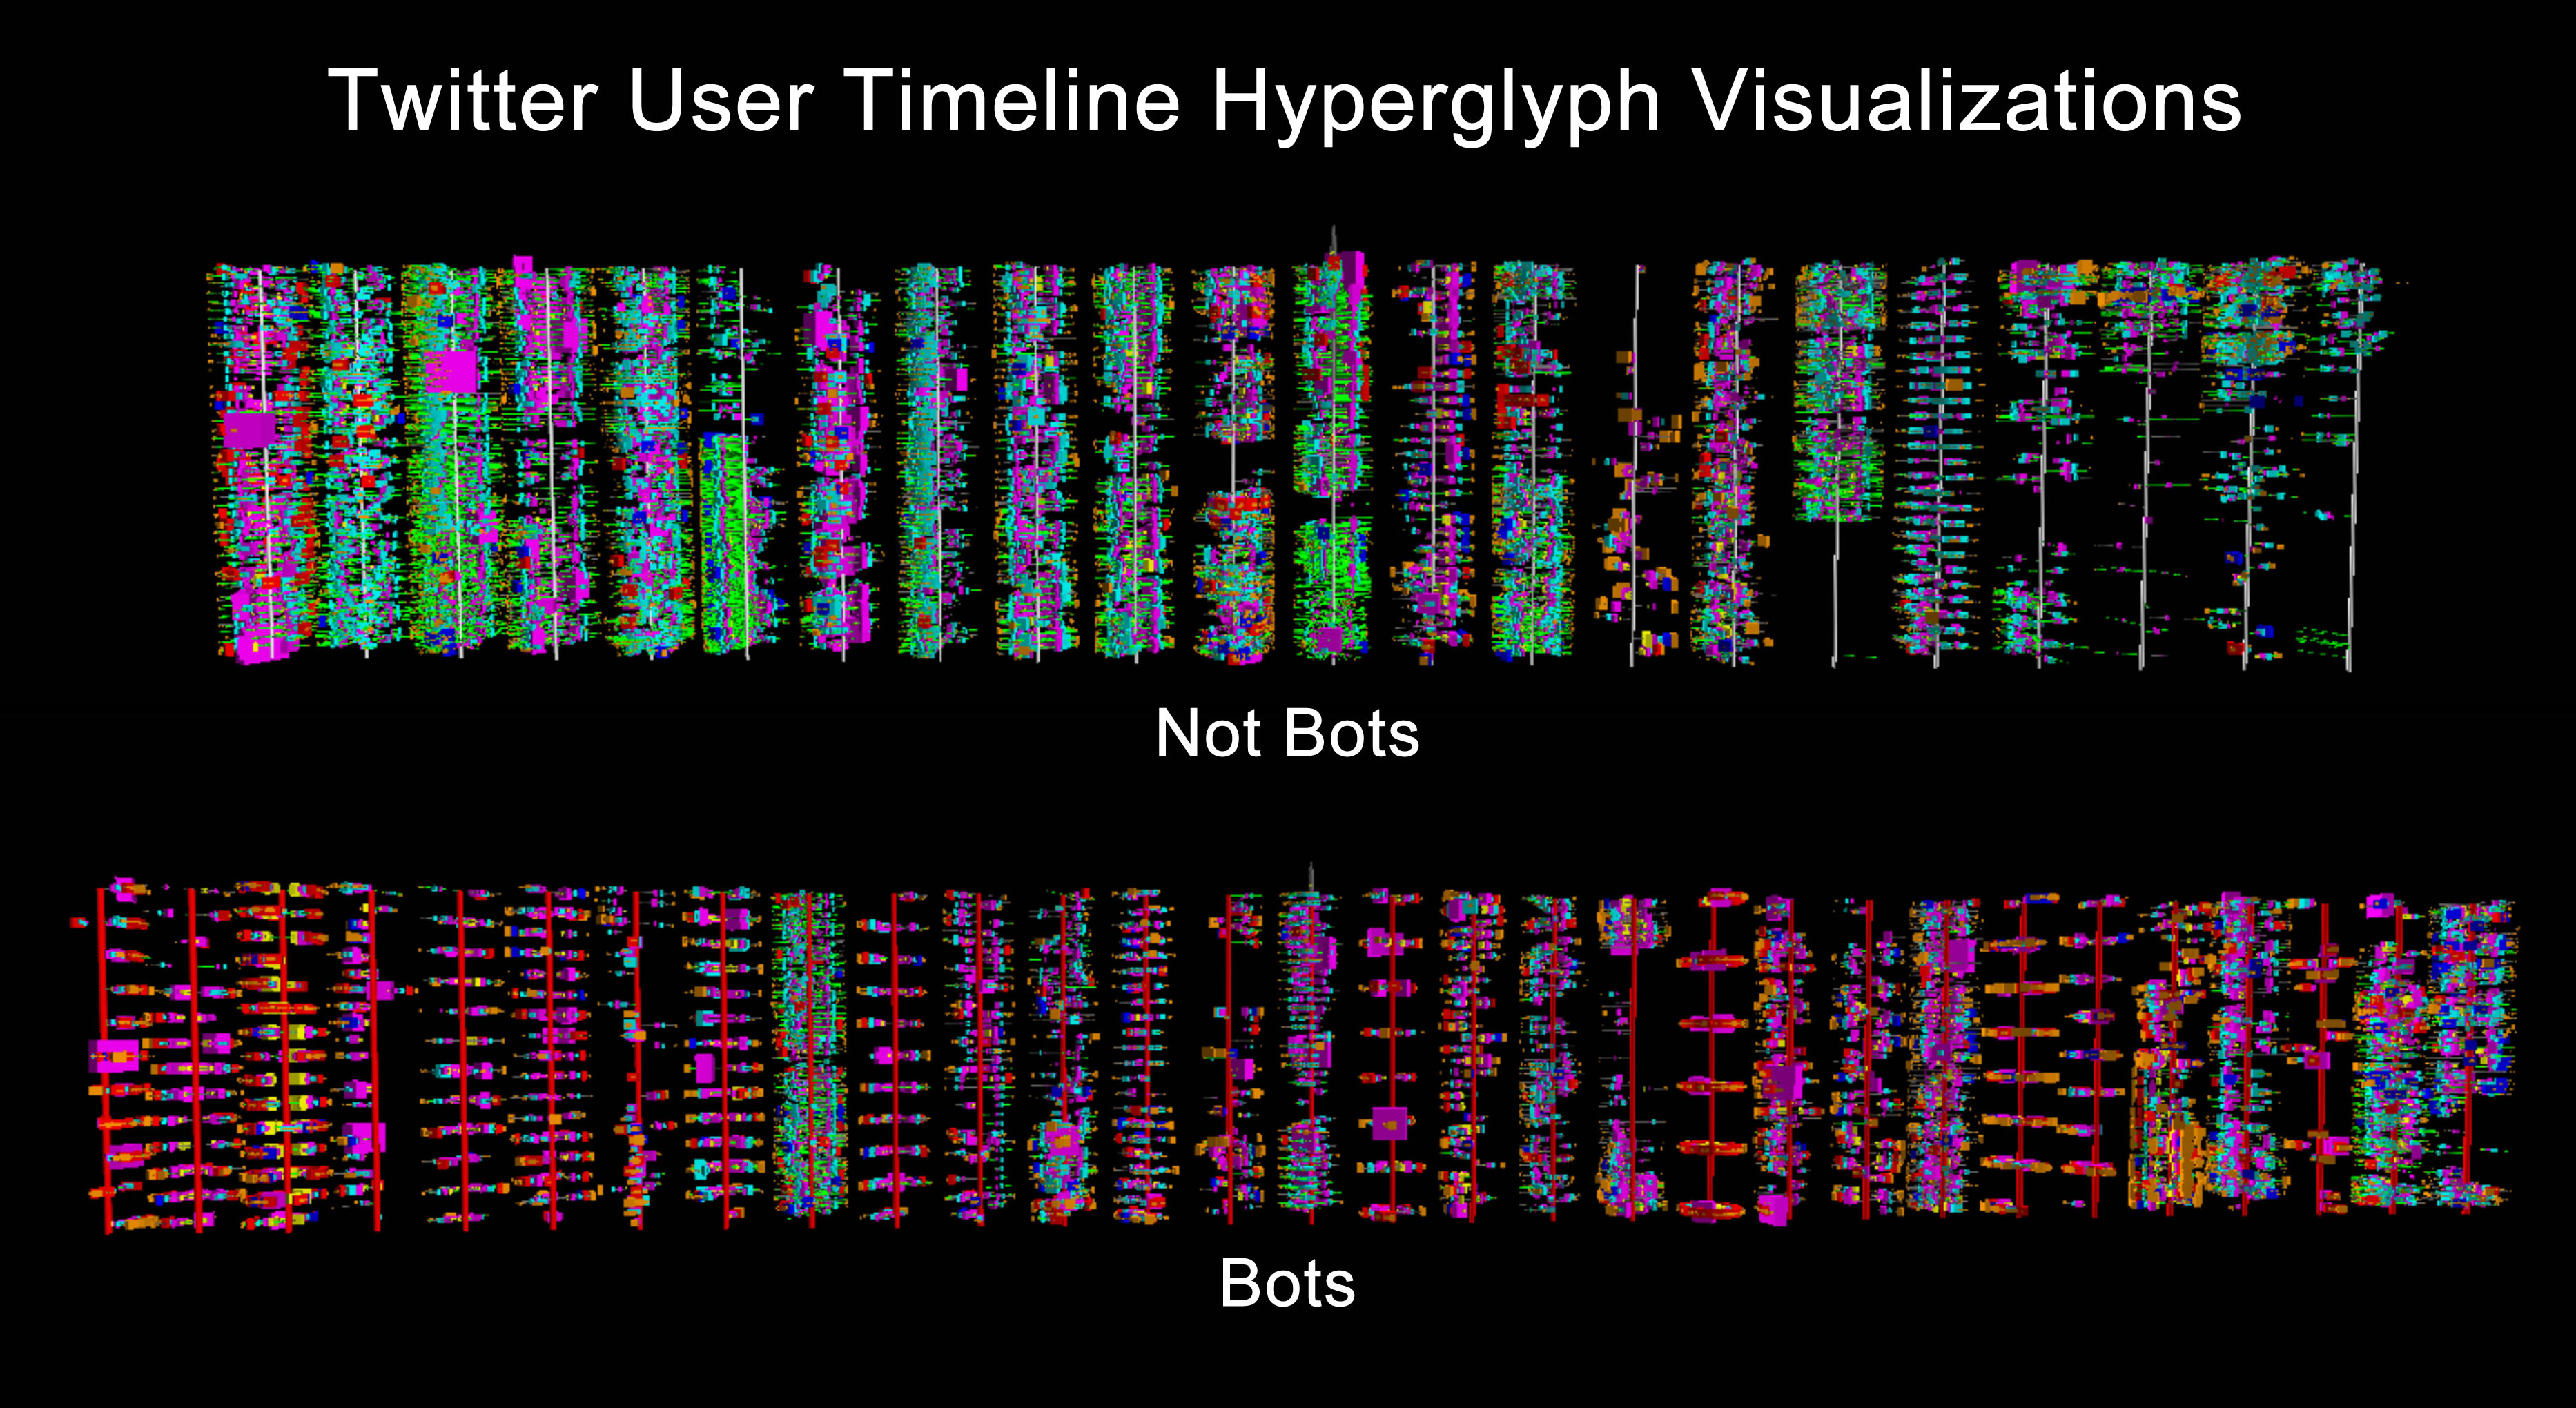
Twitter timeline towers visualize the entire 3200 most recent tweets of a specific Twitter user account. Twitter restricts tweet collection to the most recent 3200 tweets. To my understanding this is non-negotiable. If I could visualize all tweets from a specific account, I would. That's what I love to do. Sadly, that's not an option, so I'm doing the best I can with what I have. It's an interesting restriction, in some ways working with this constraint simplifies things.
Our initial goal with these towers was to find ways of visually distinguishing between Twitter bots and not-bots. We also created a 'perceptualization' combining visual and audio information rendered synchronously to simulate a 'music box' or 'player piano' effect.
View some examples.
Botometer Stars
Bokeh Plots and Kingmaker Identification