Confirmed Cases, March 20, 2020
Interactive 2D Bokeh Plots
Bokeh is an open source data viz app which allows for advanced functionality and interactivity.
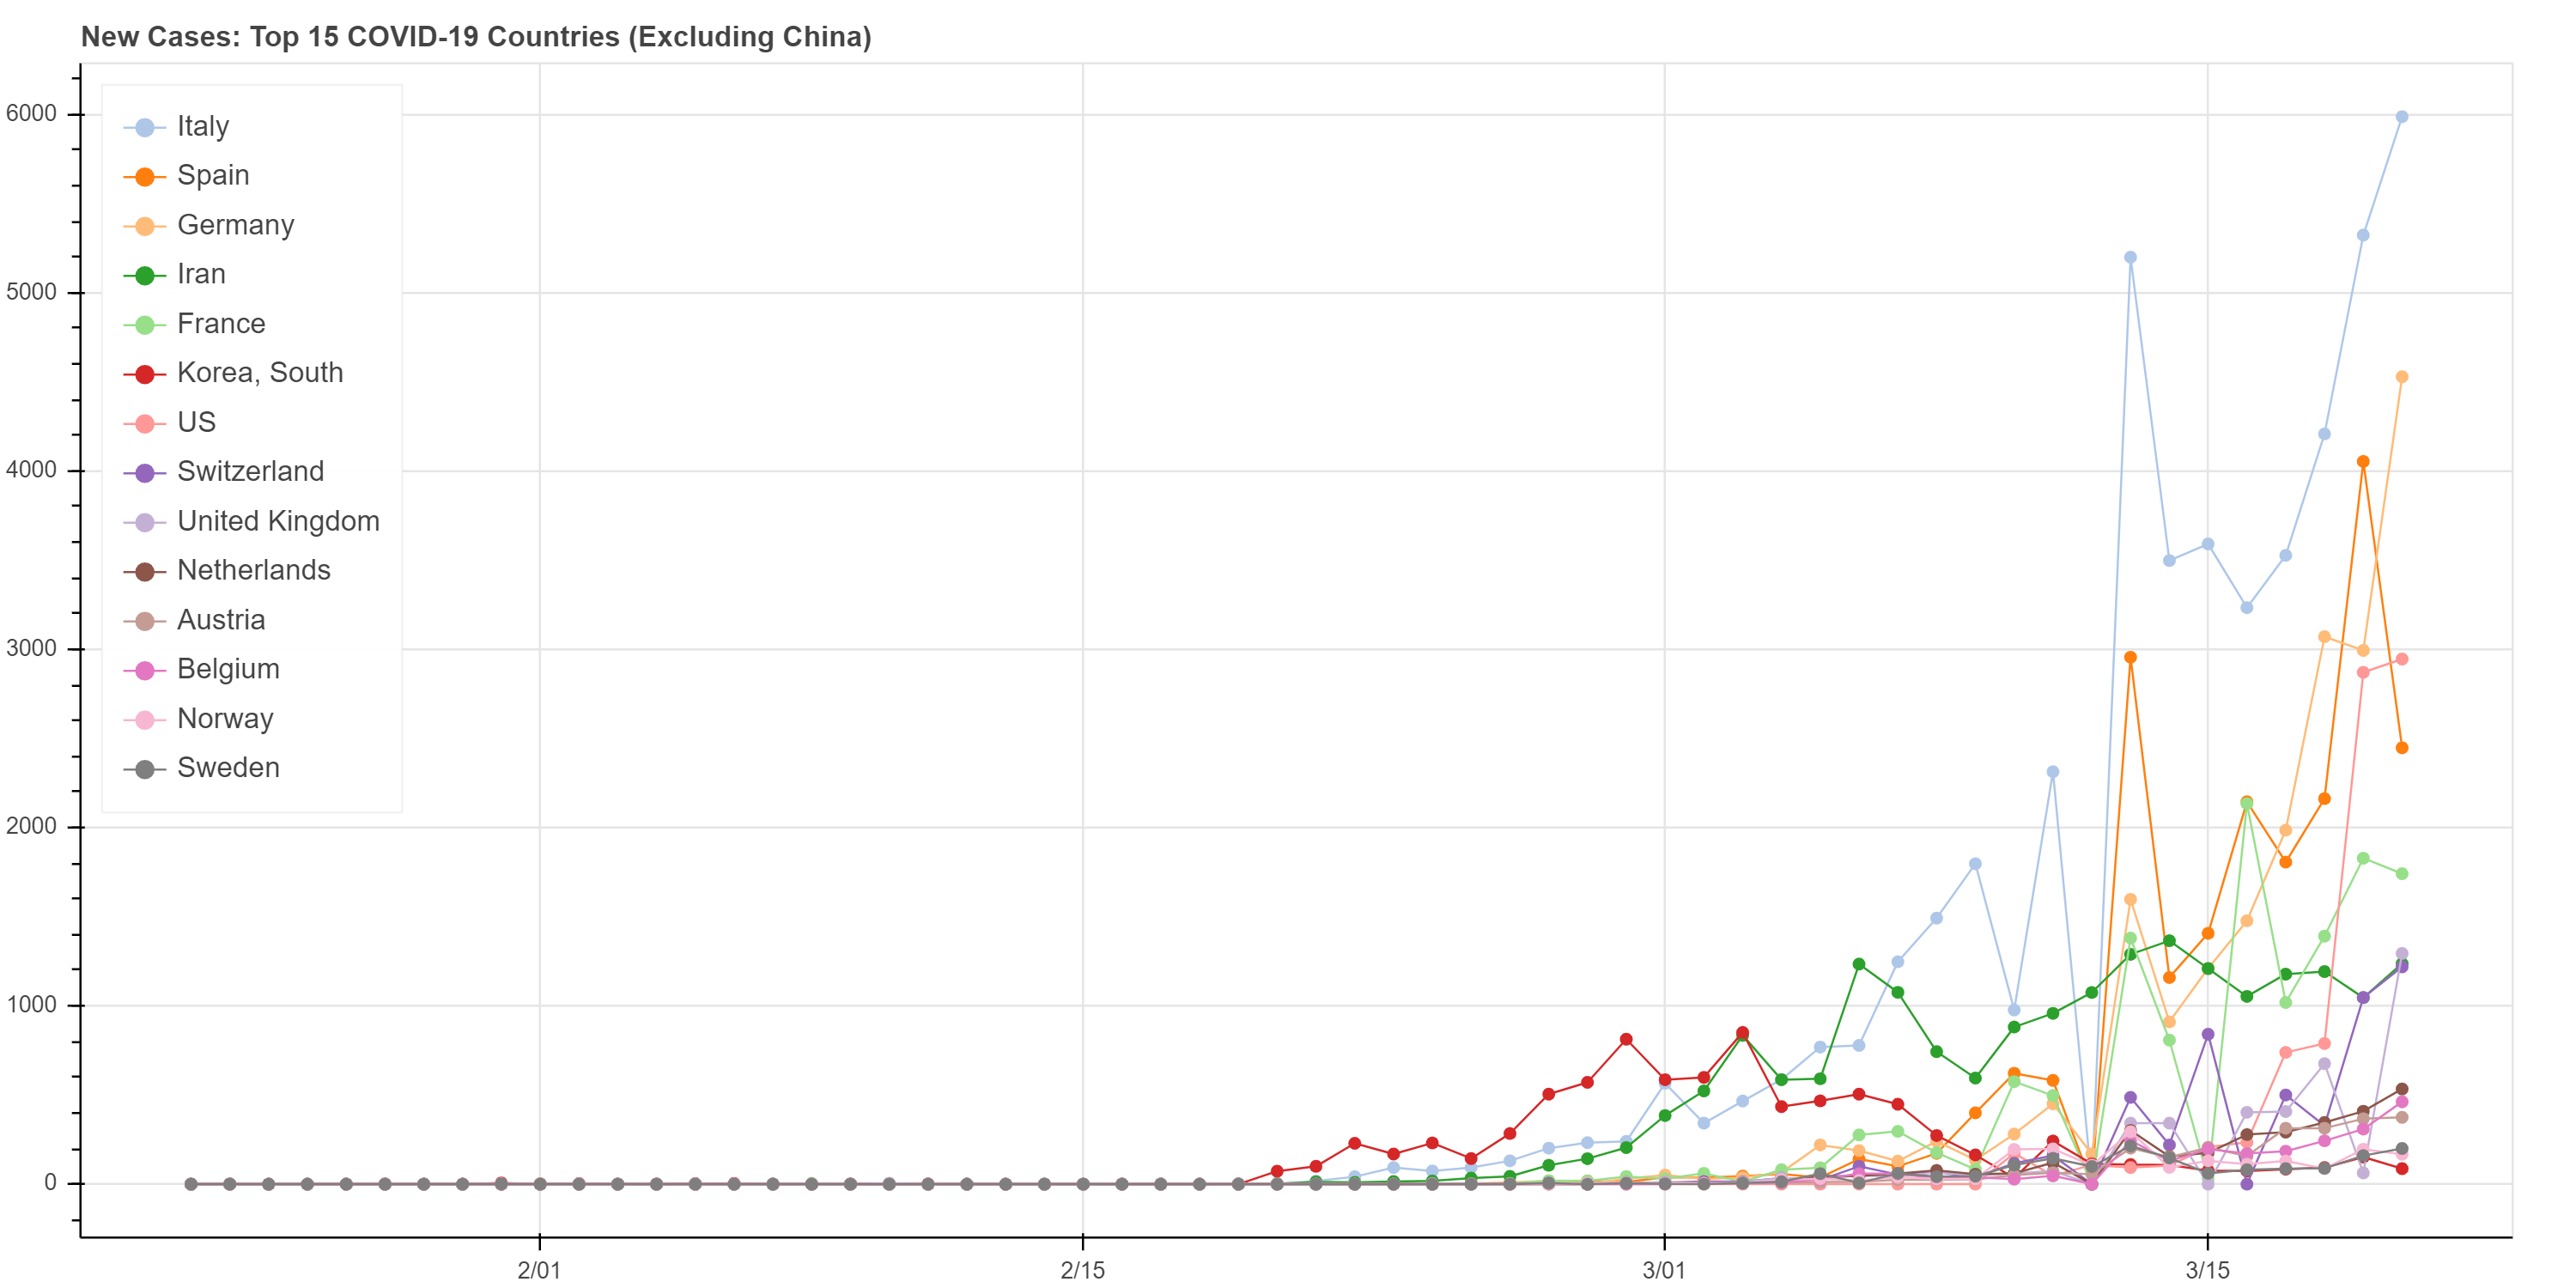
View visualizations of daily new cases up through March 20, 2020.
3D Visualizations
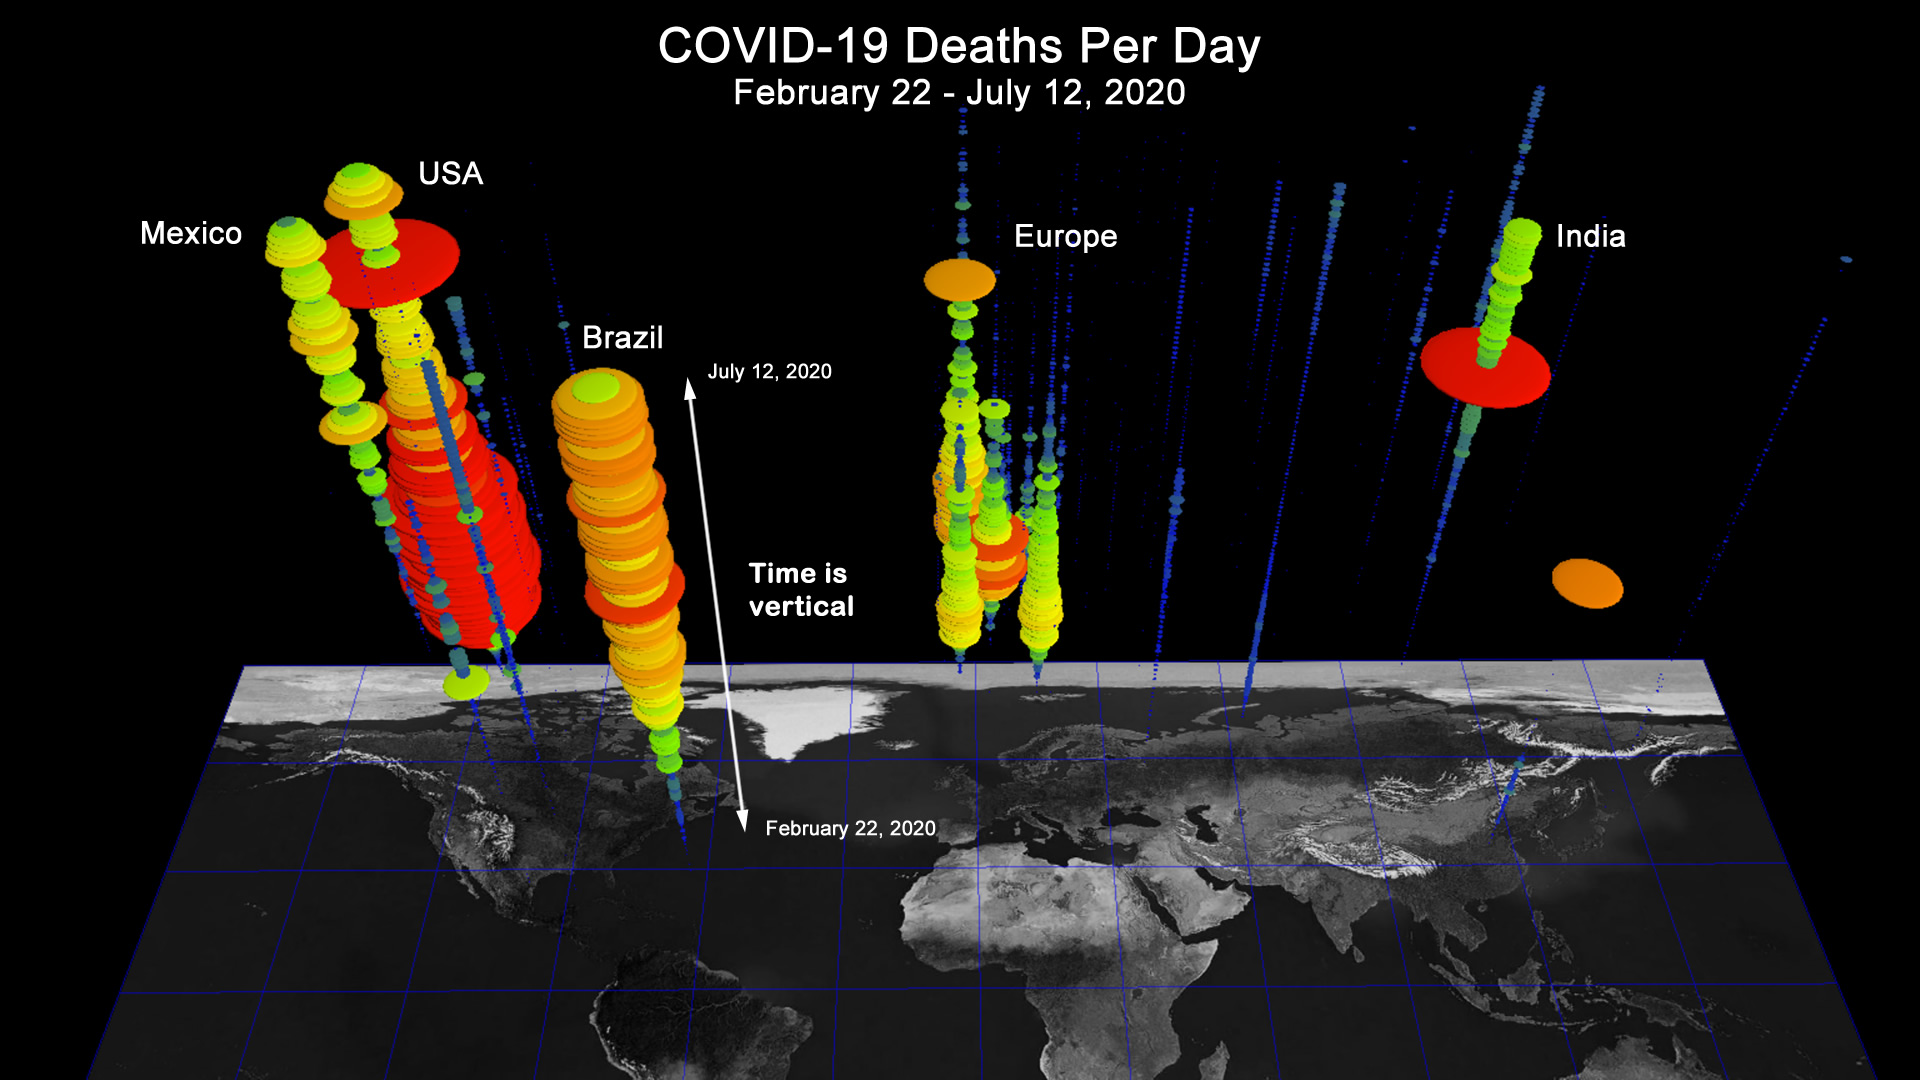
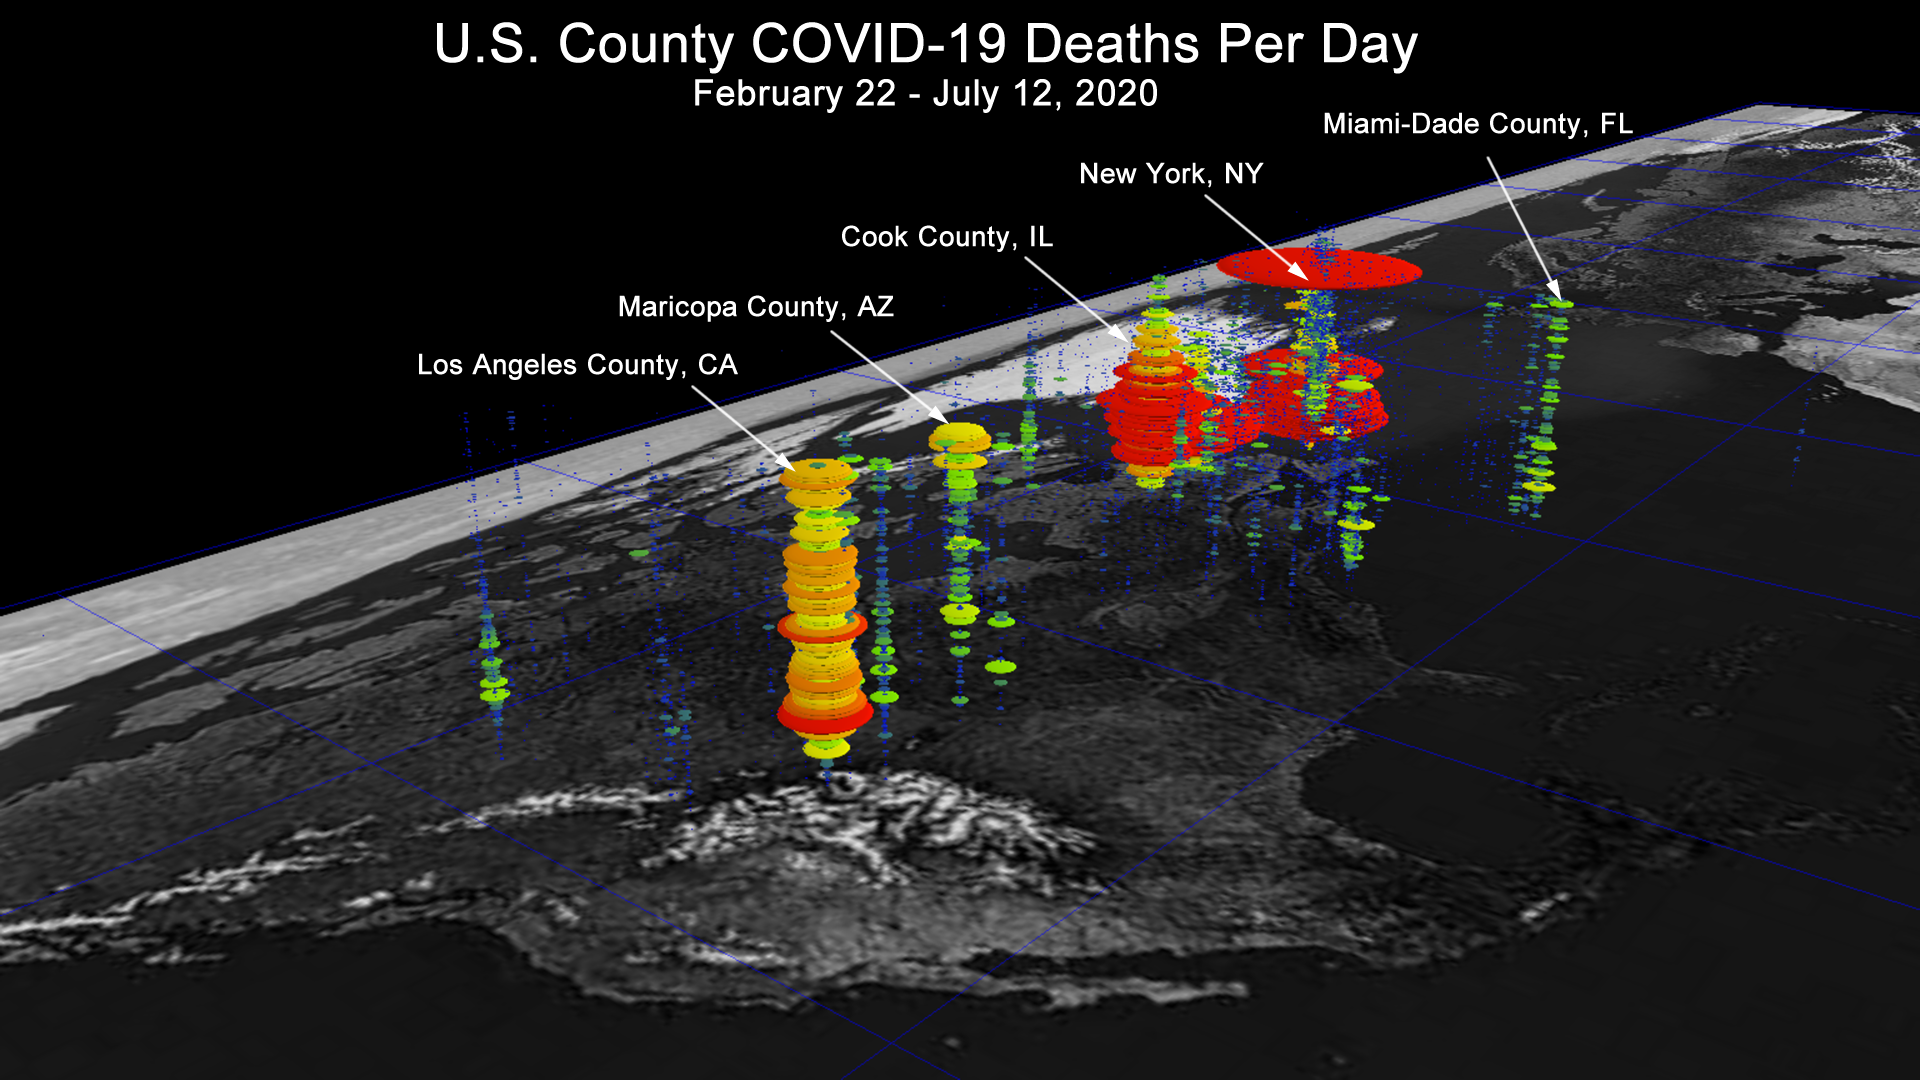
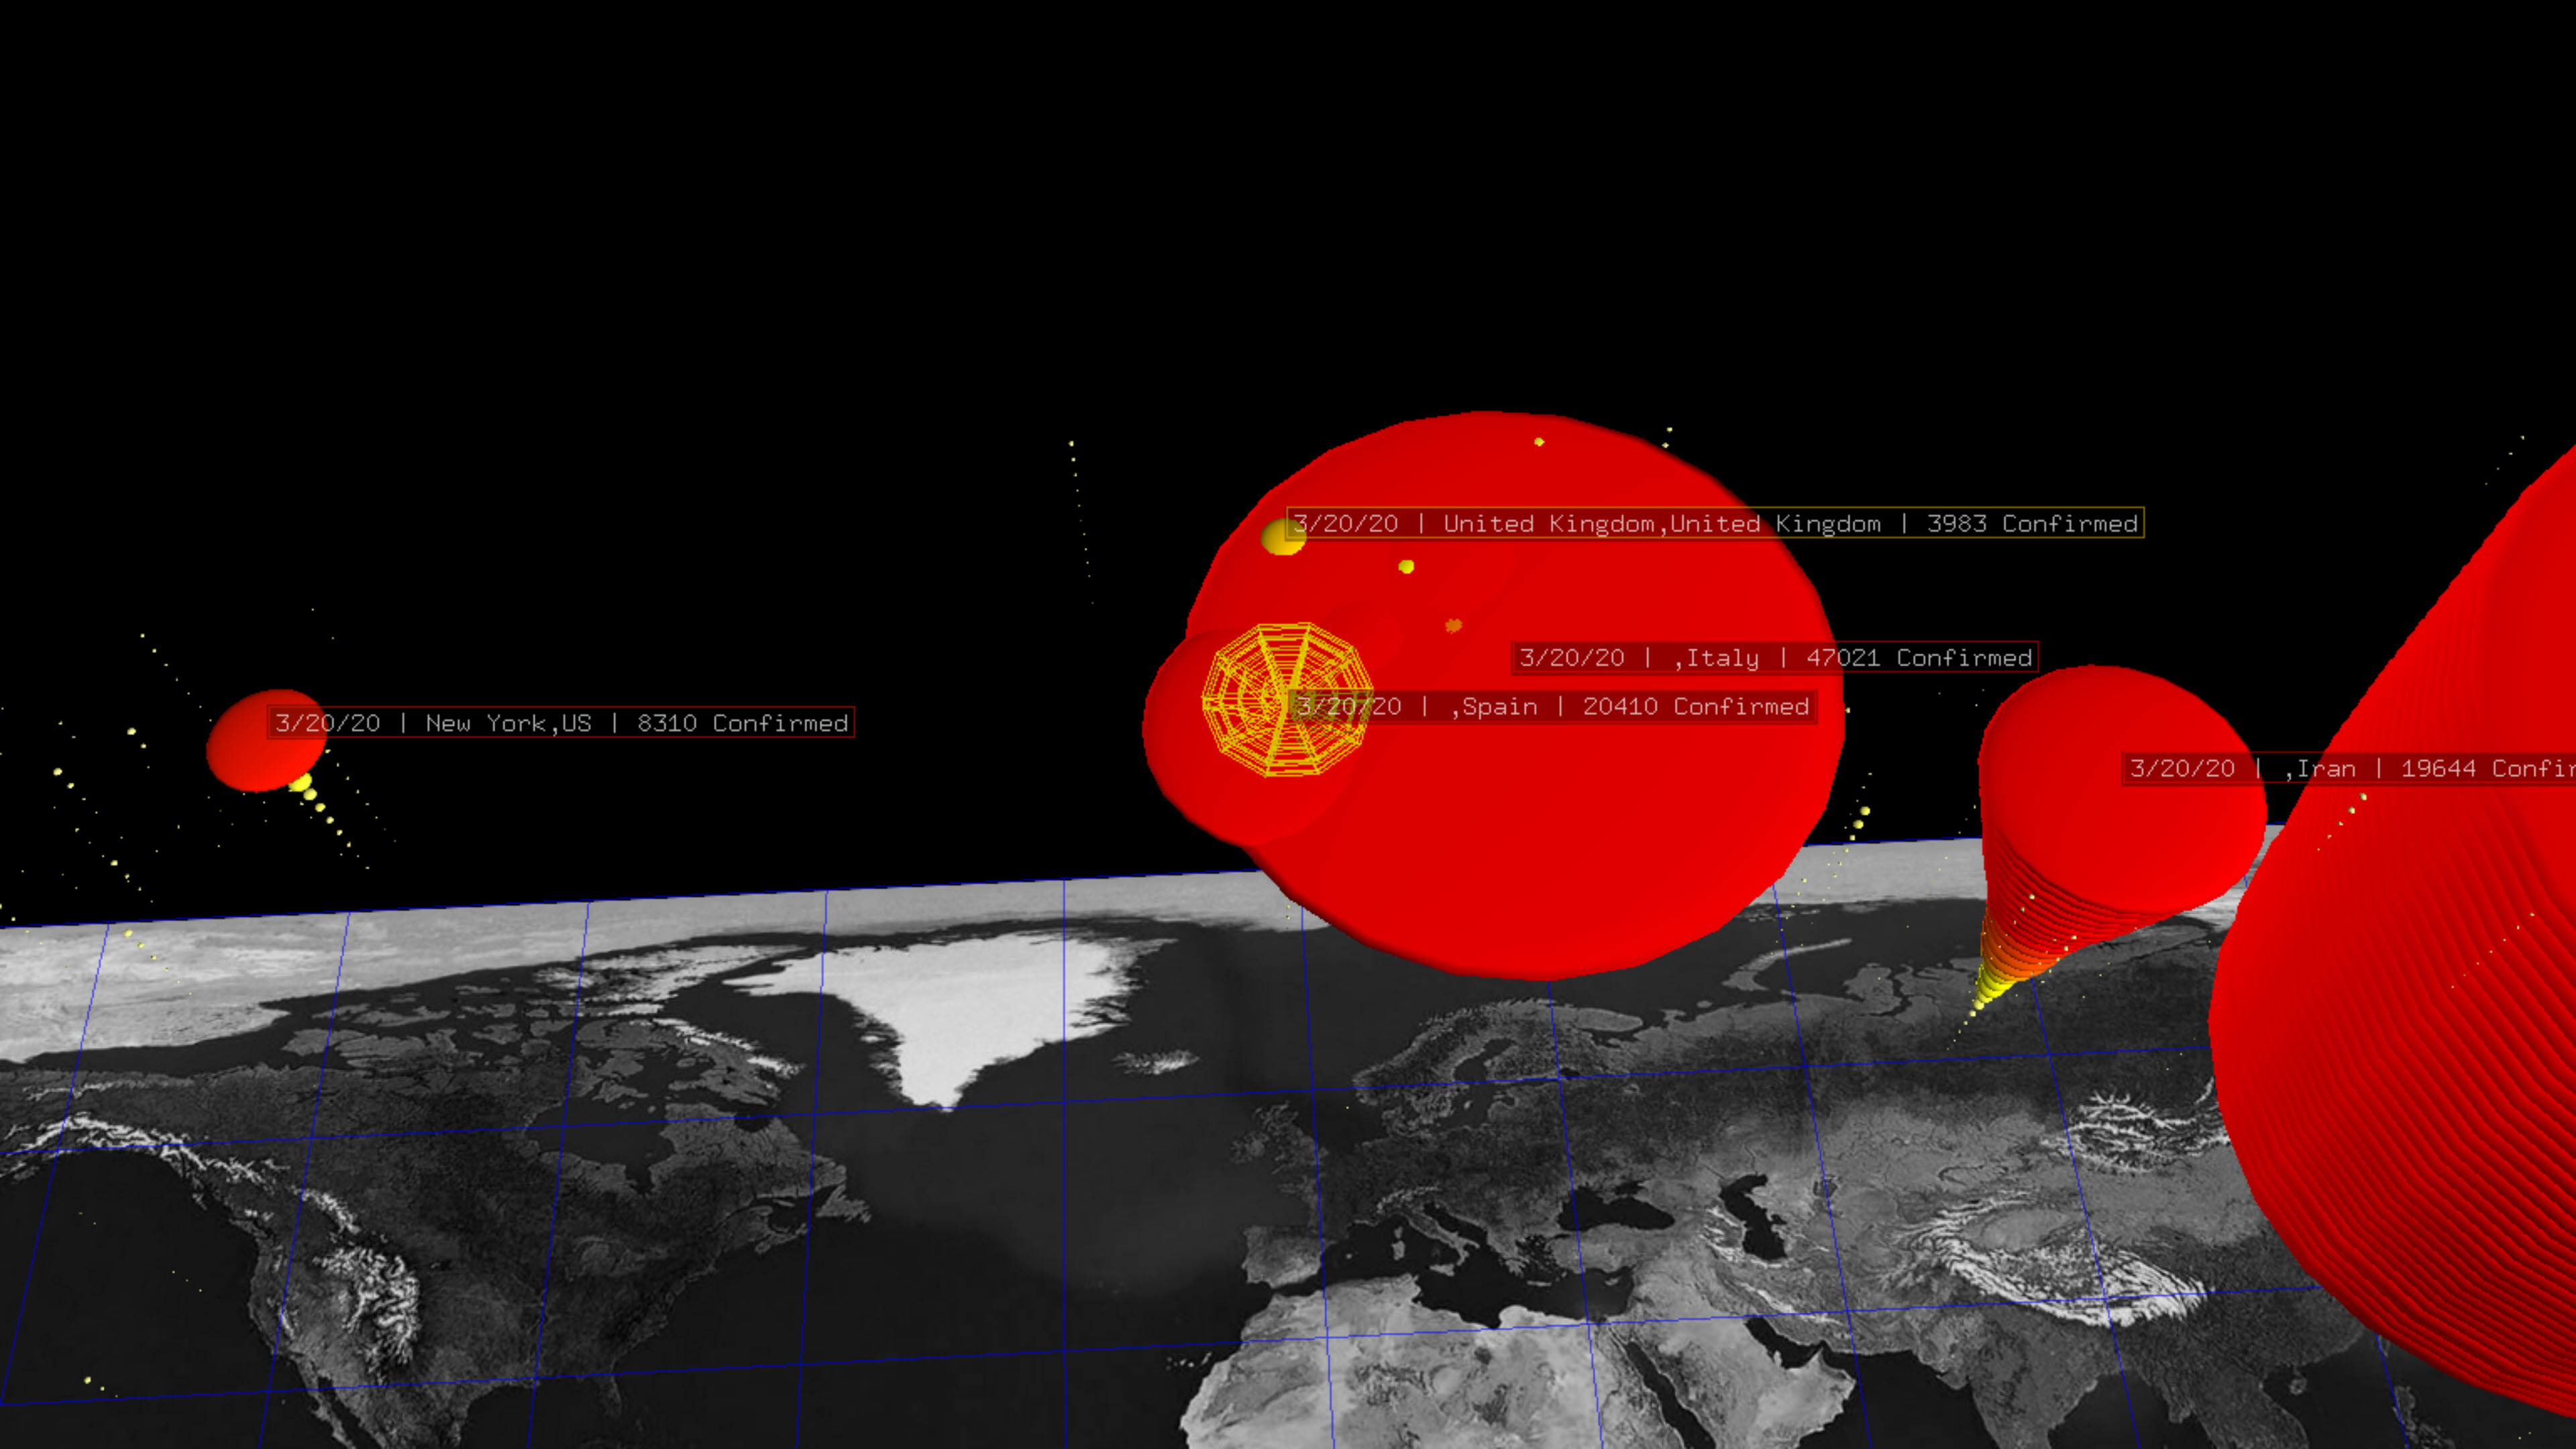
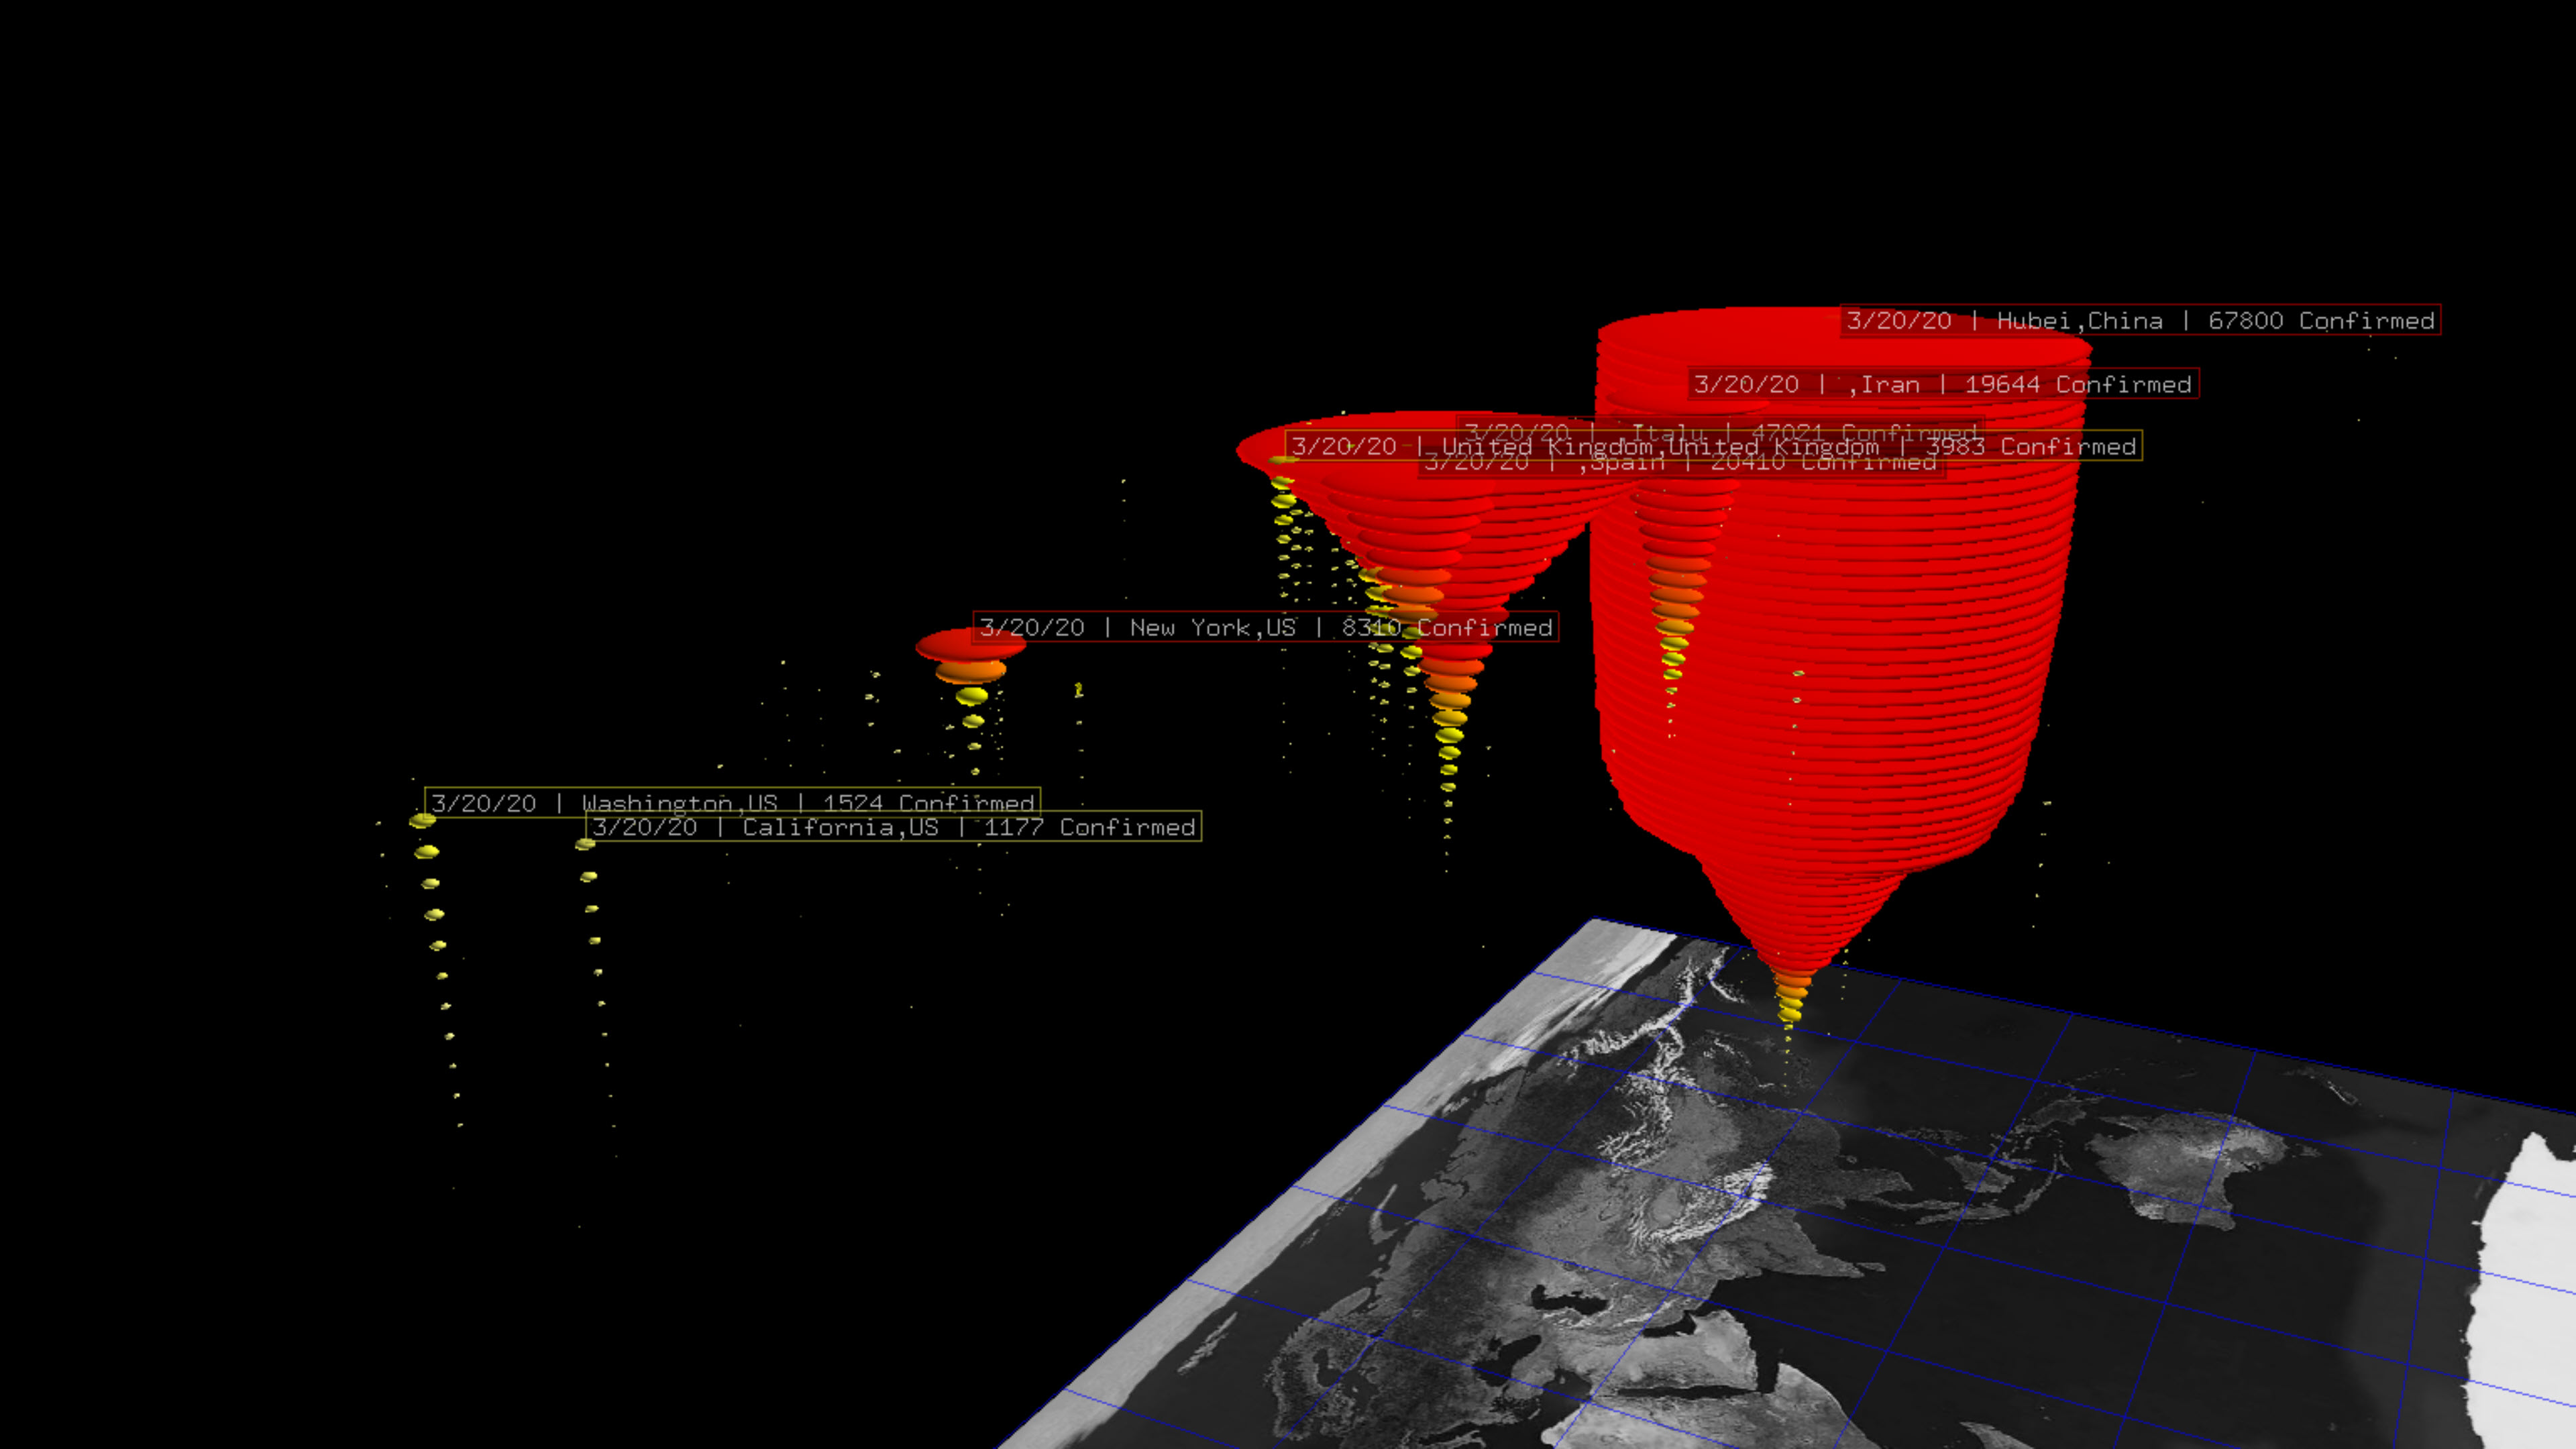
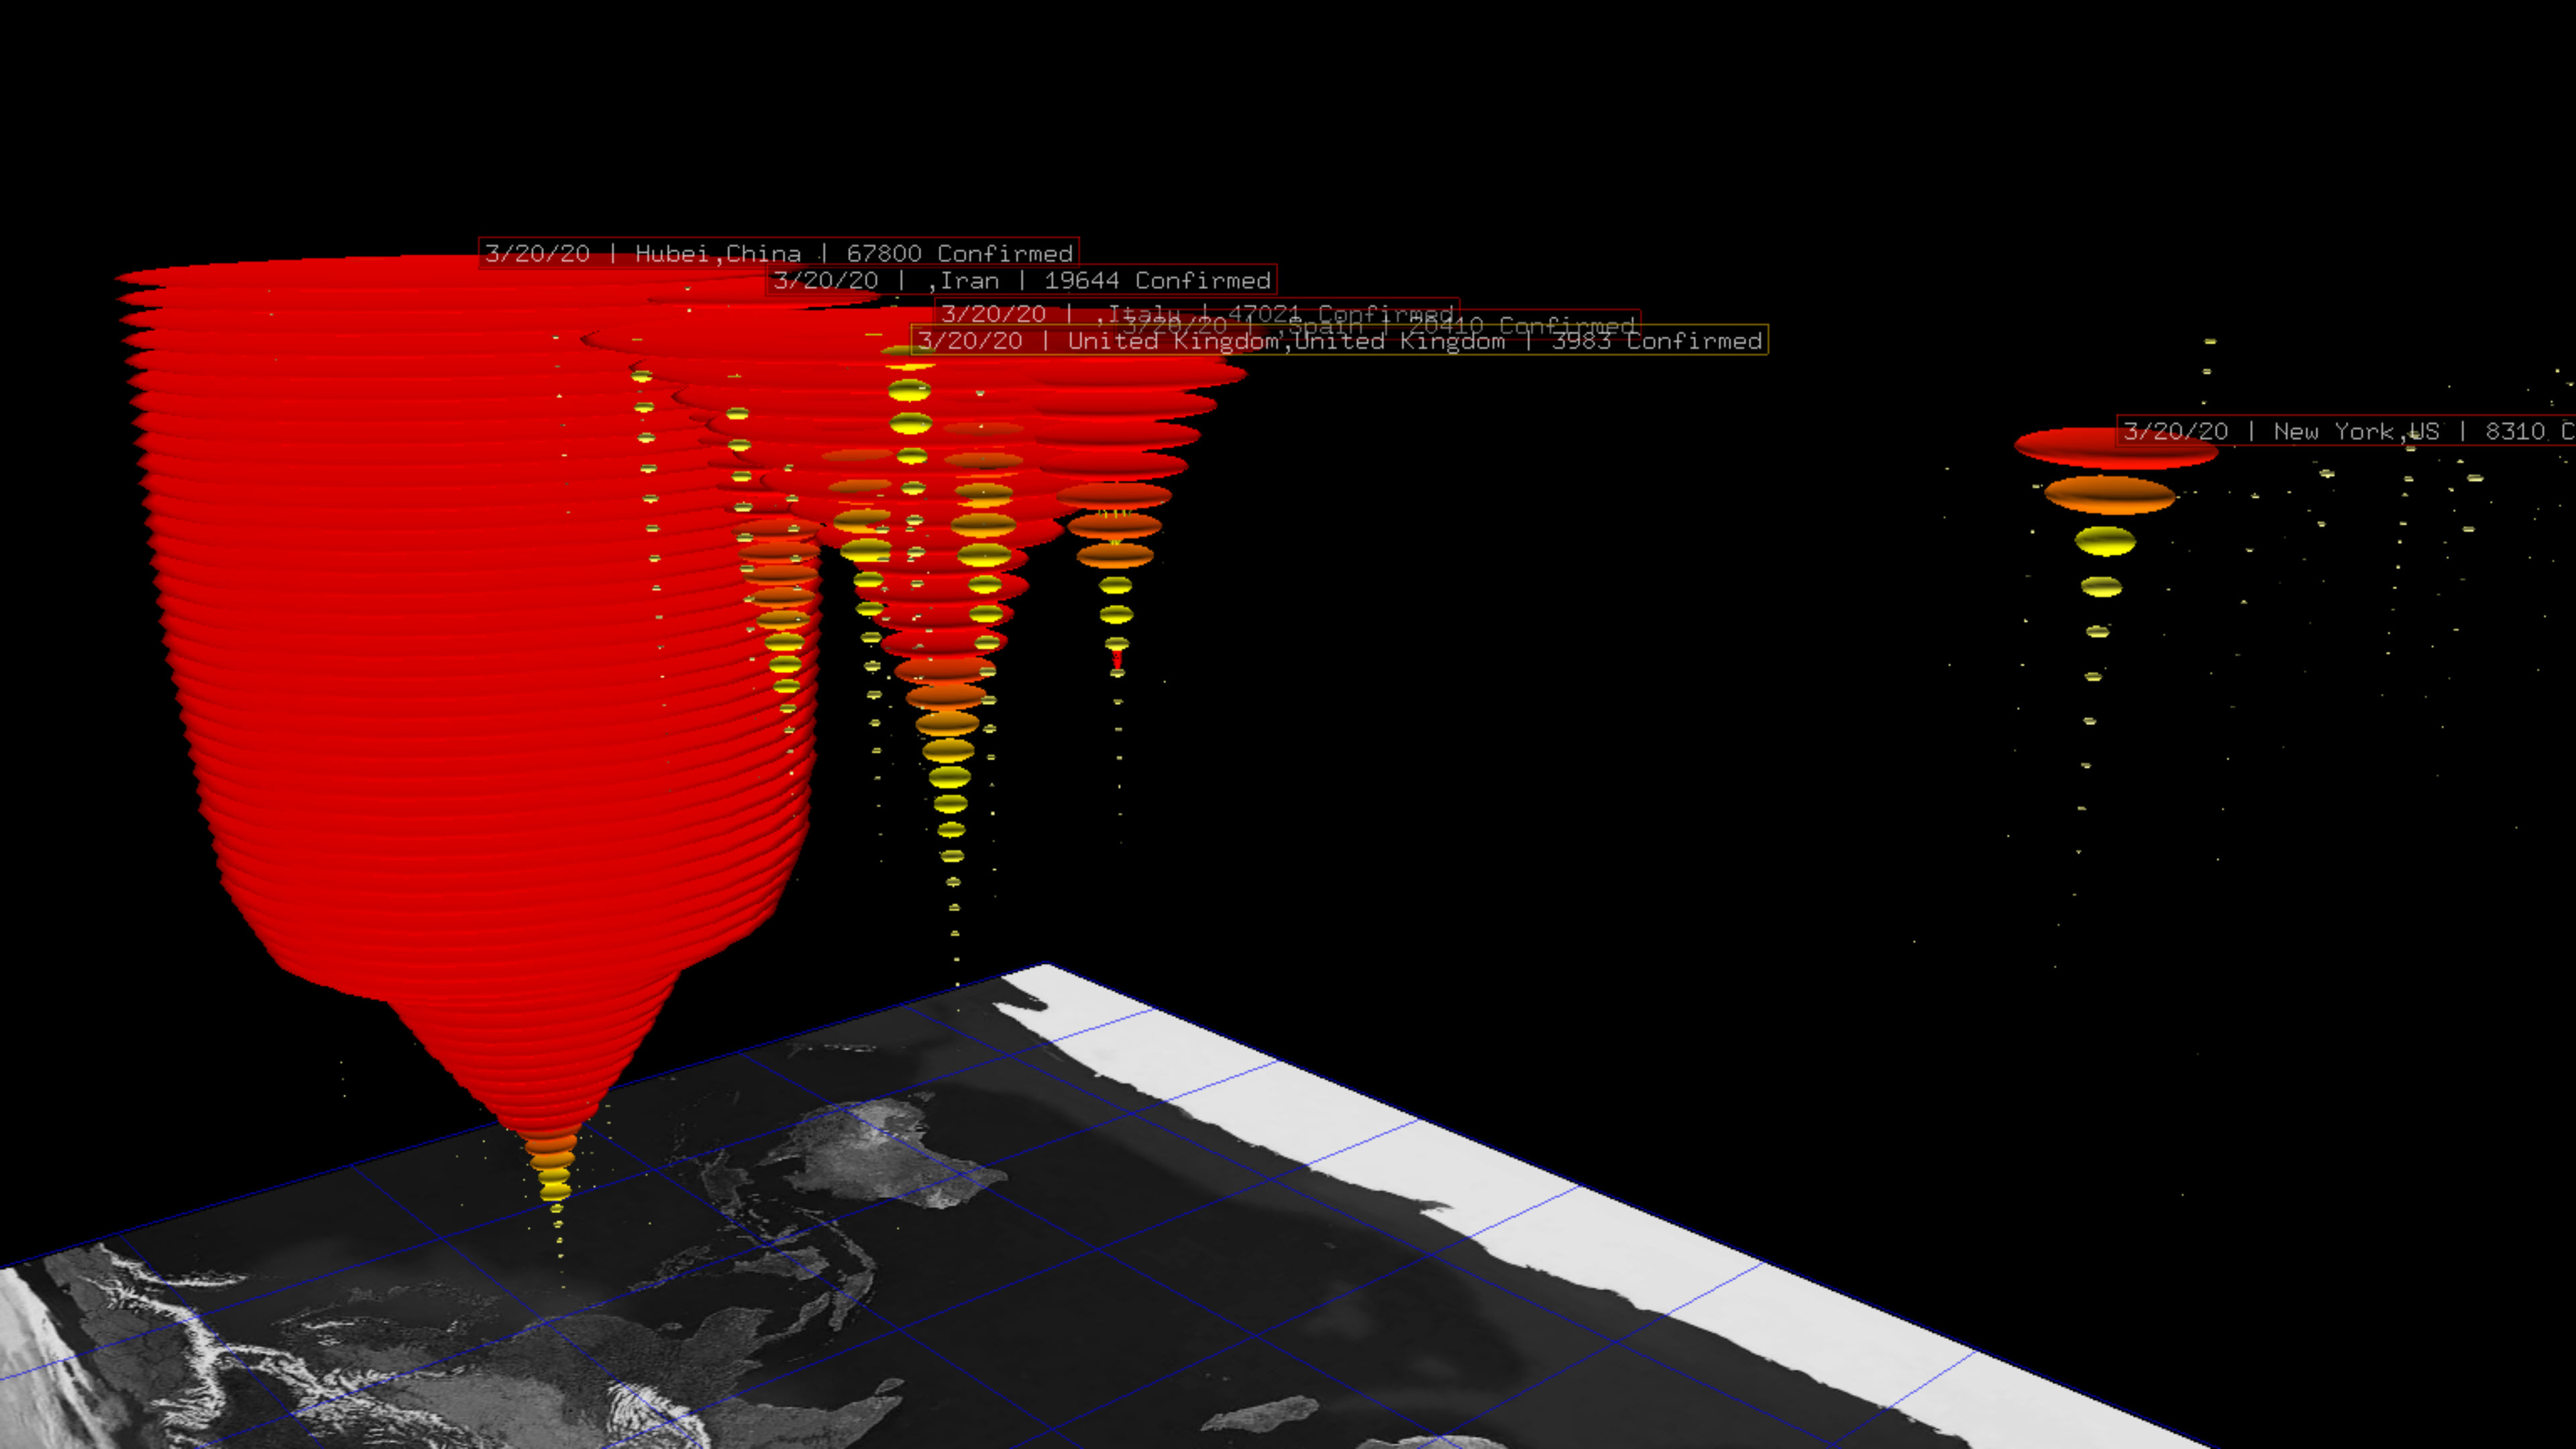
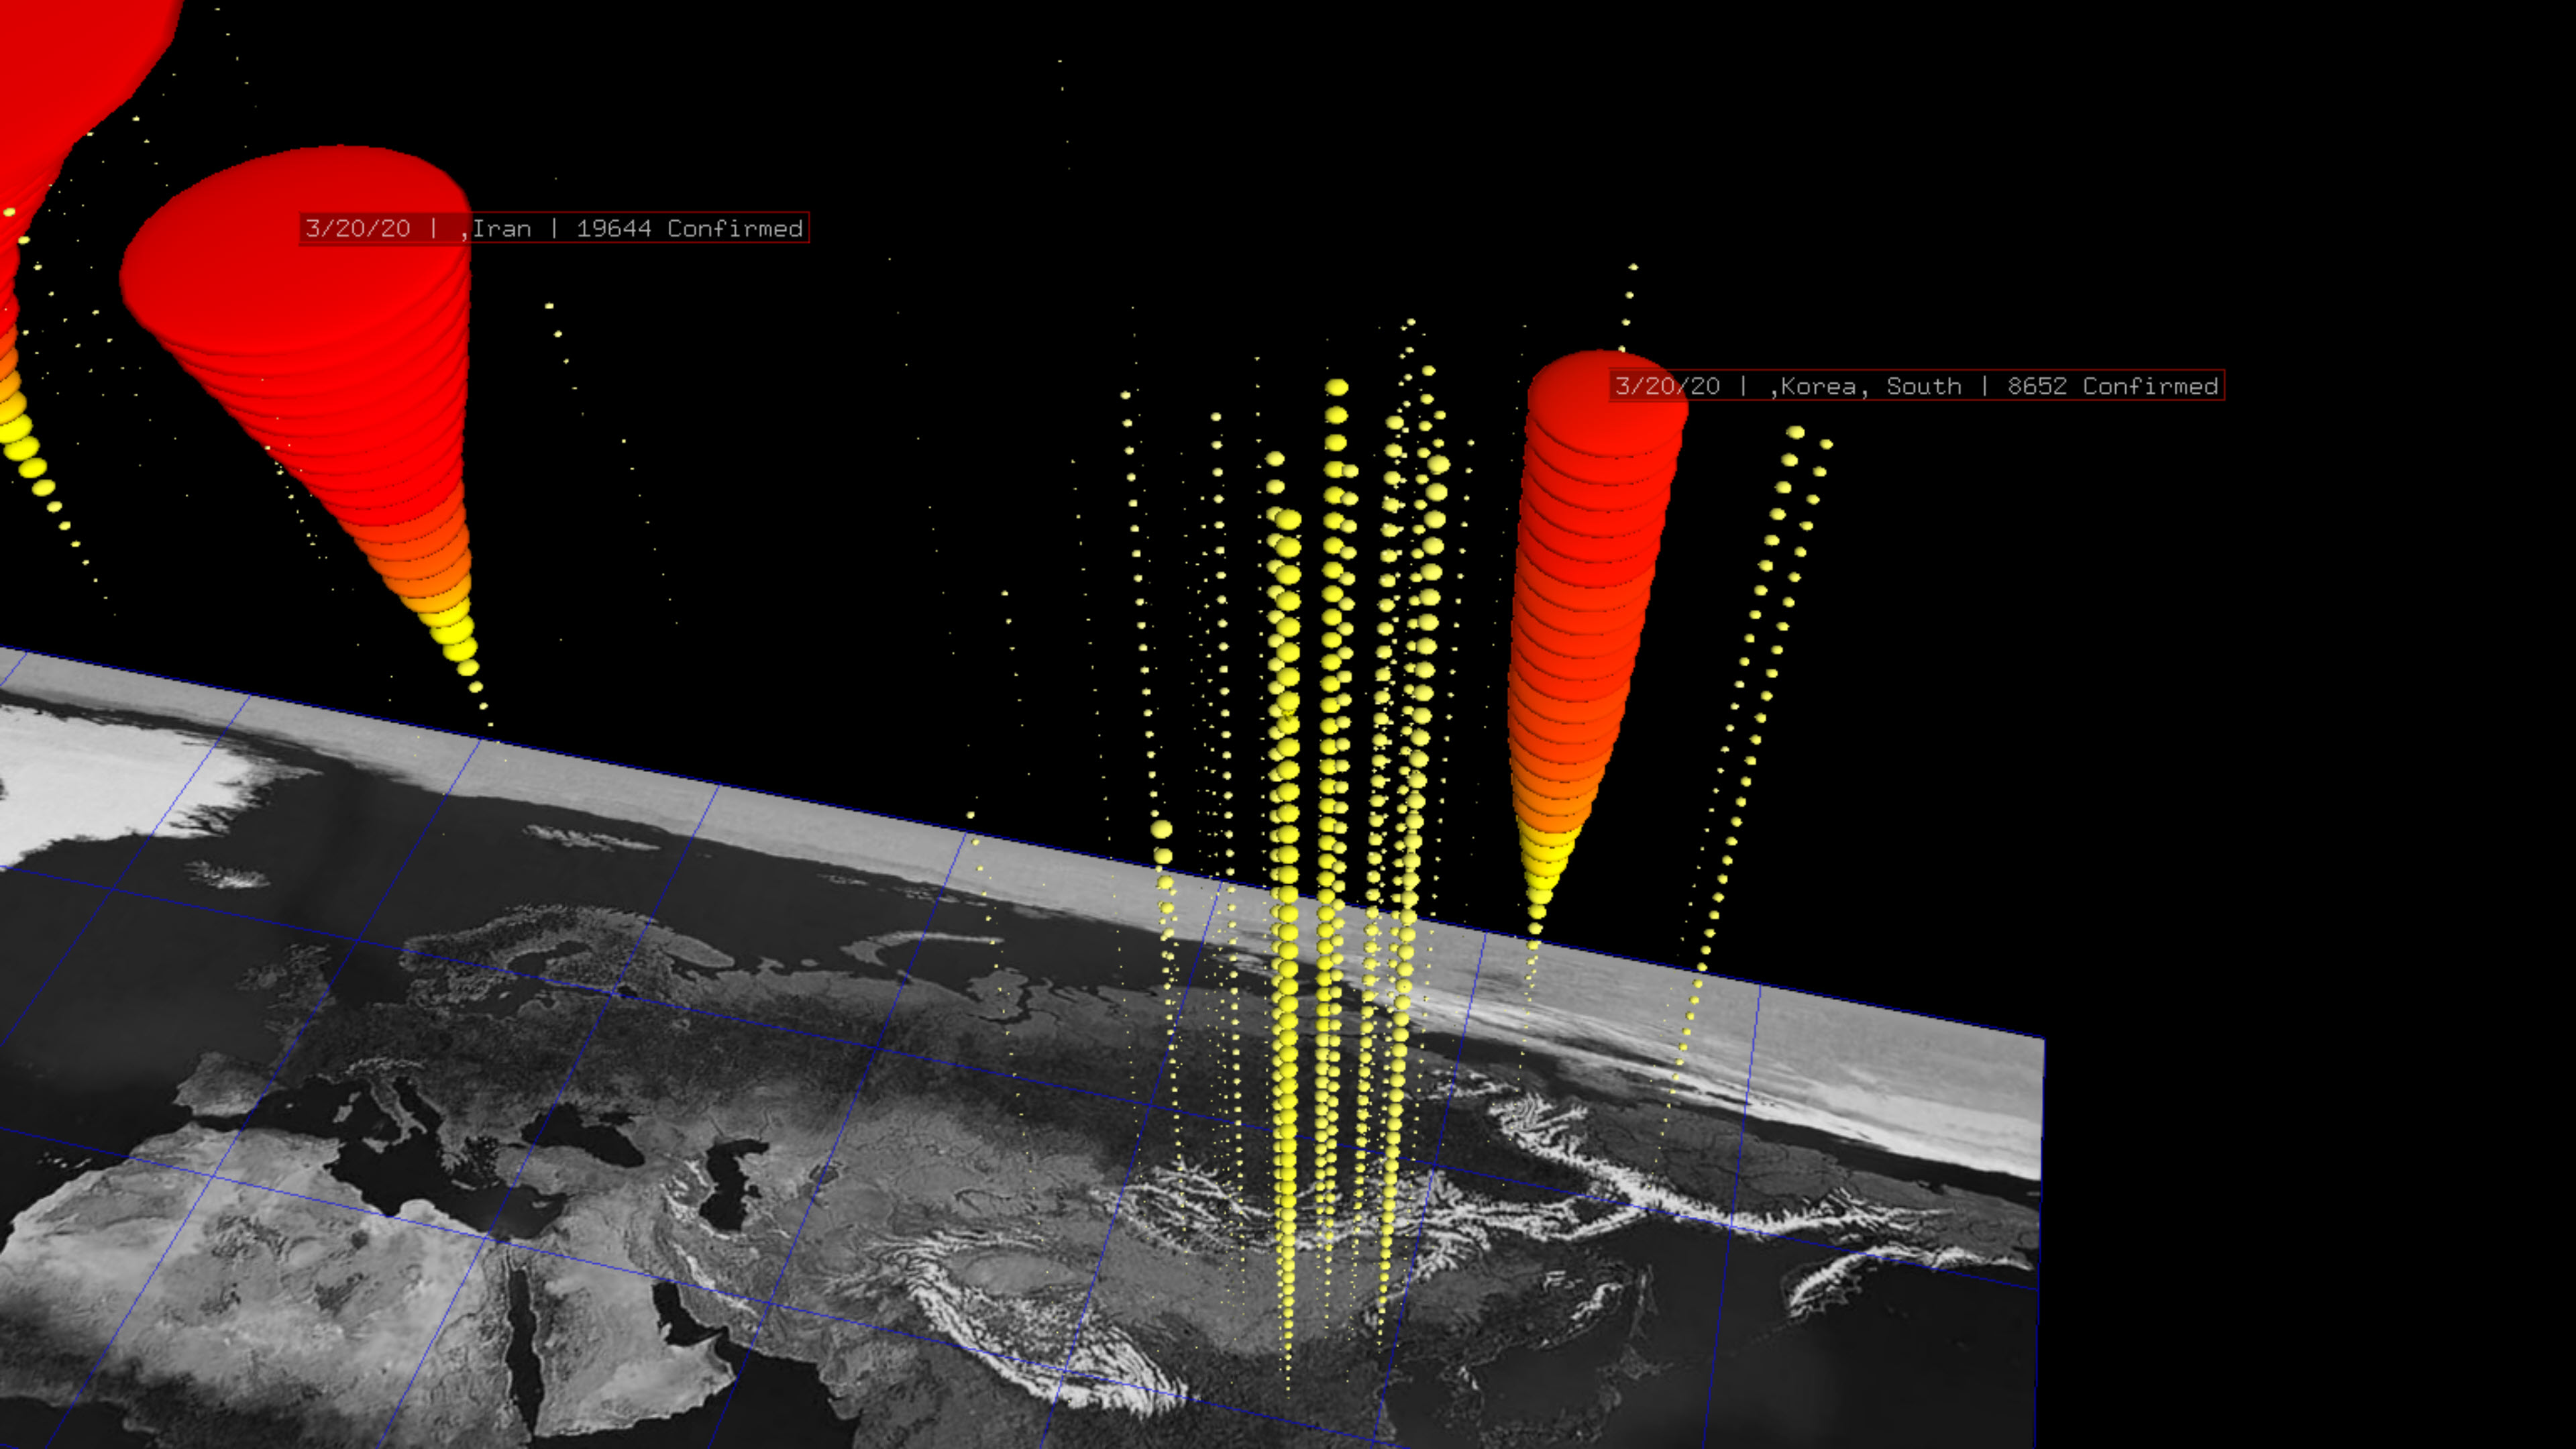
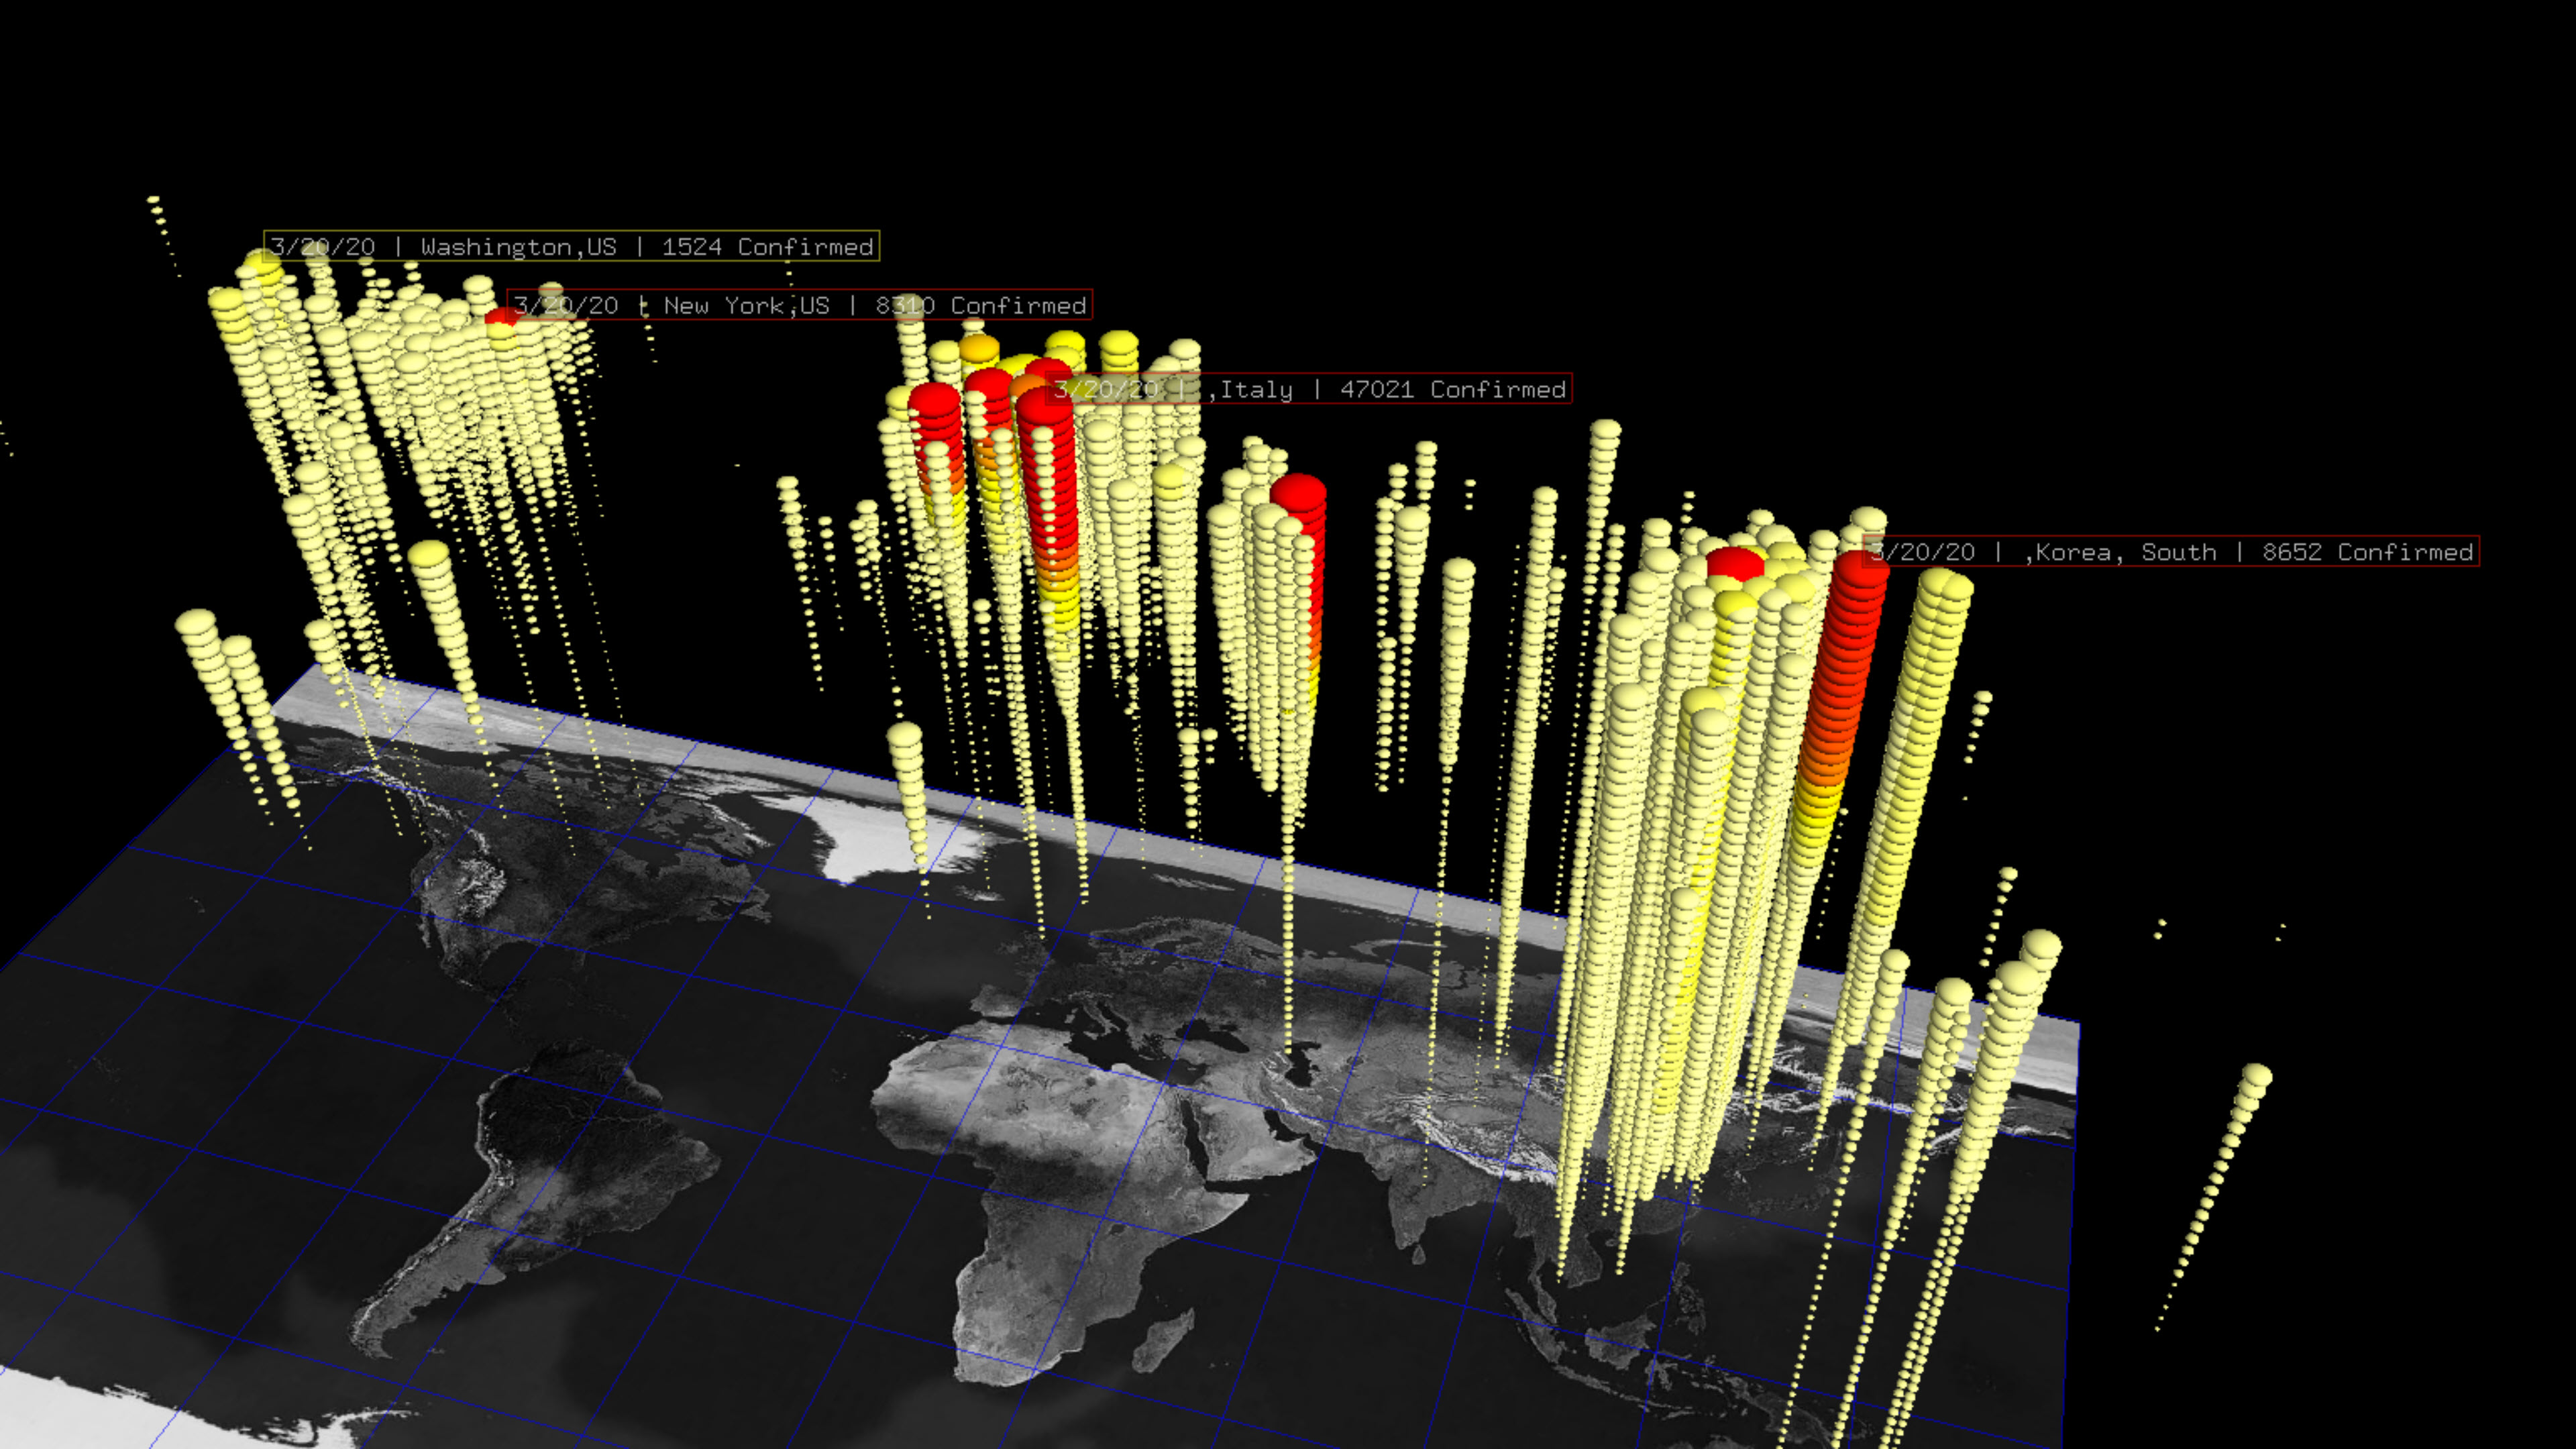
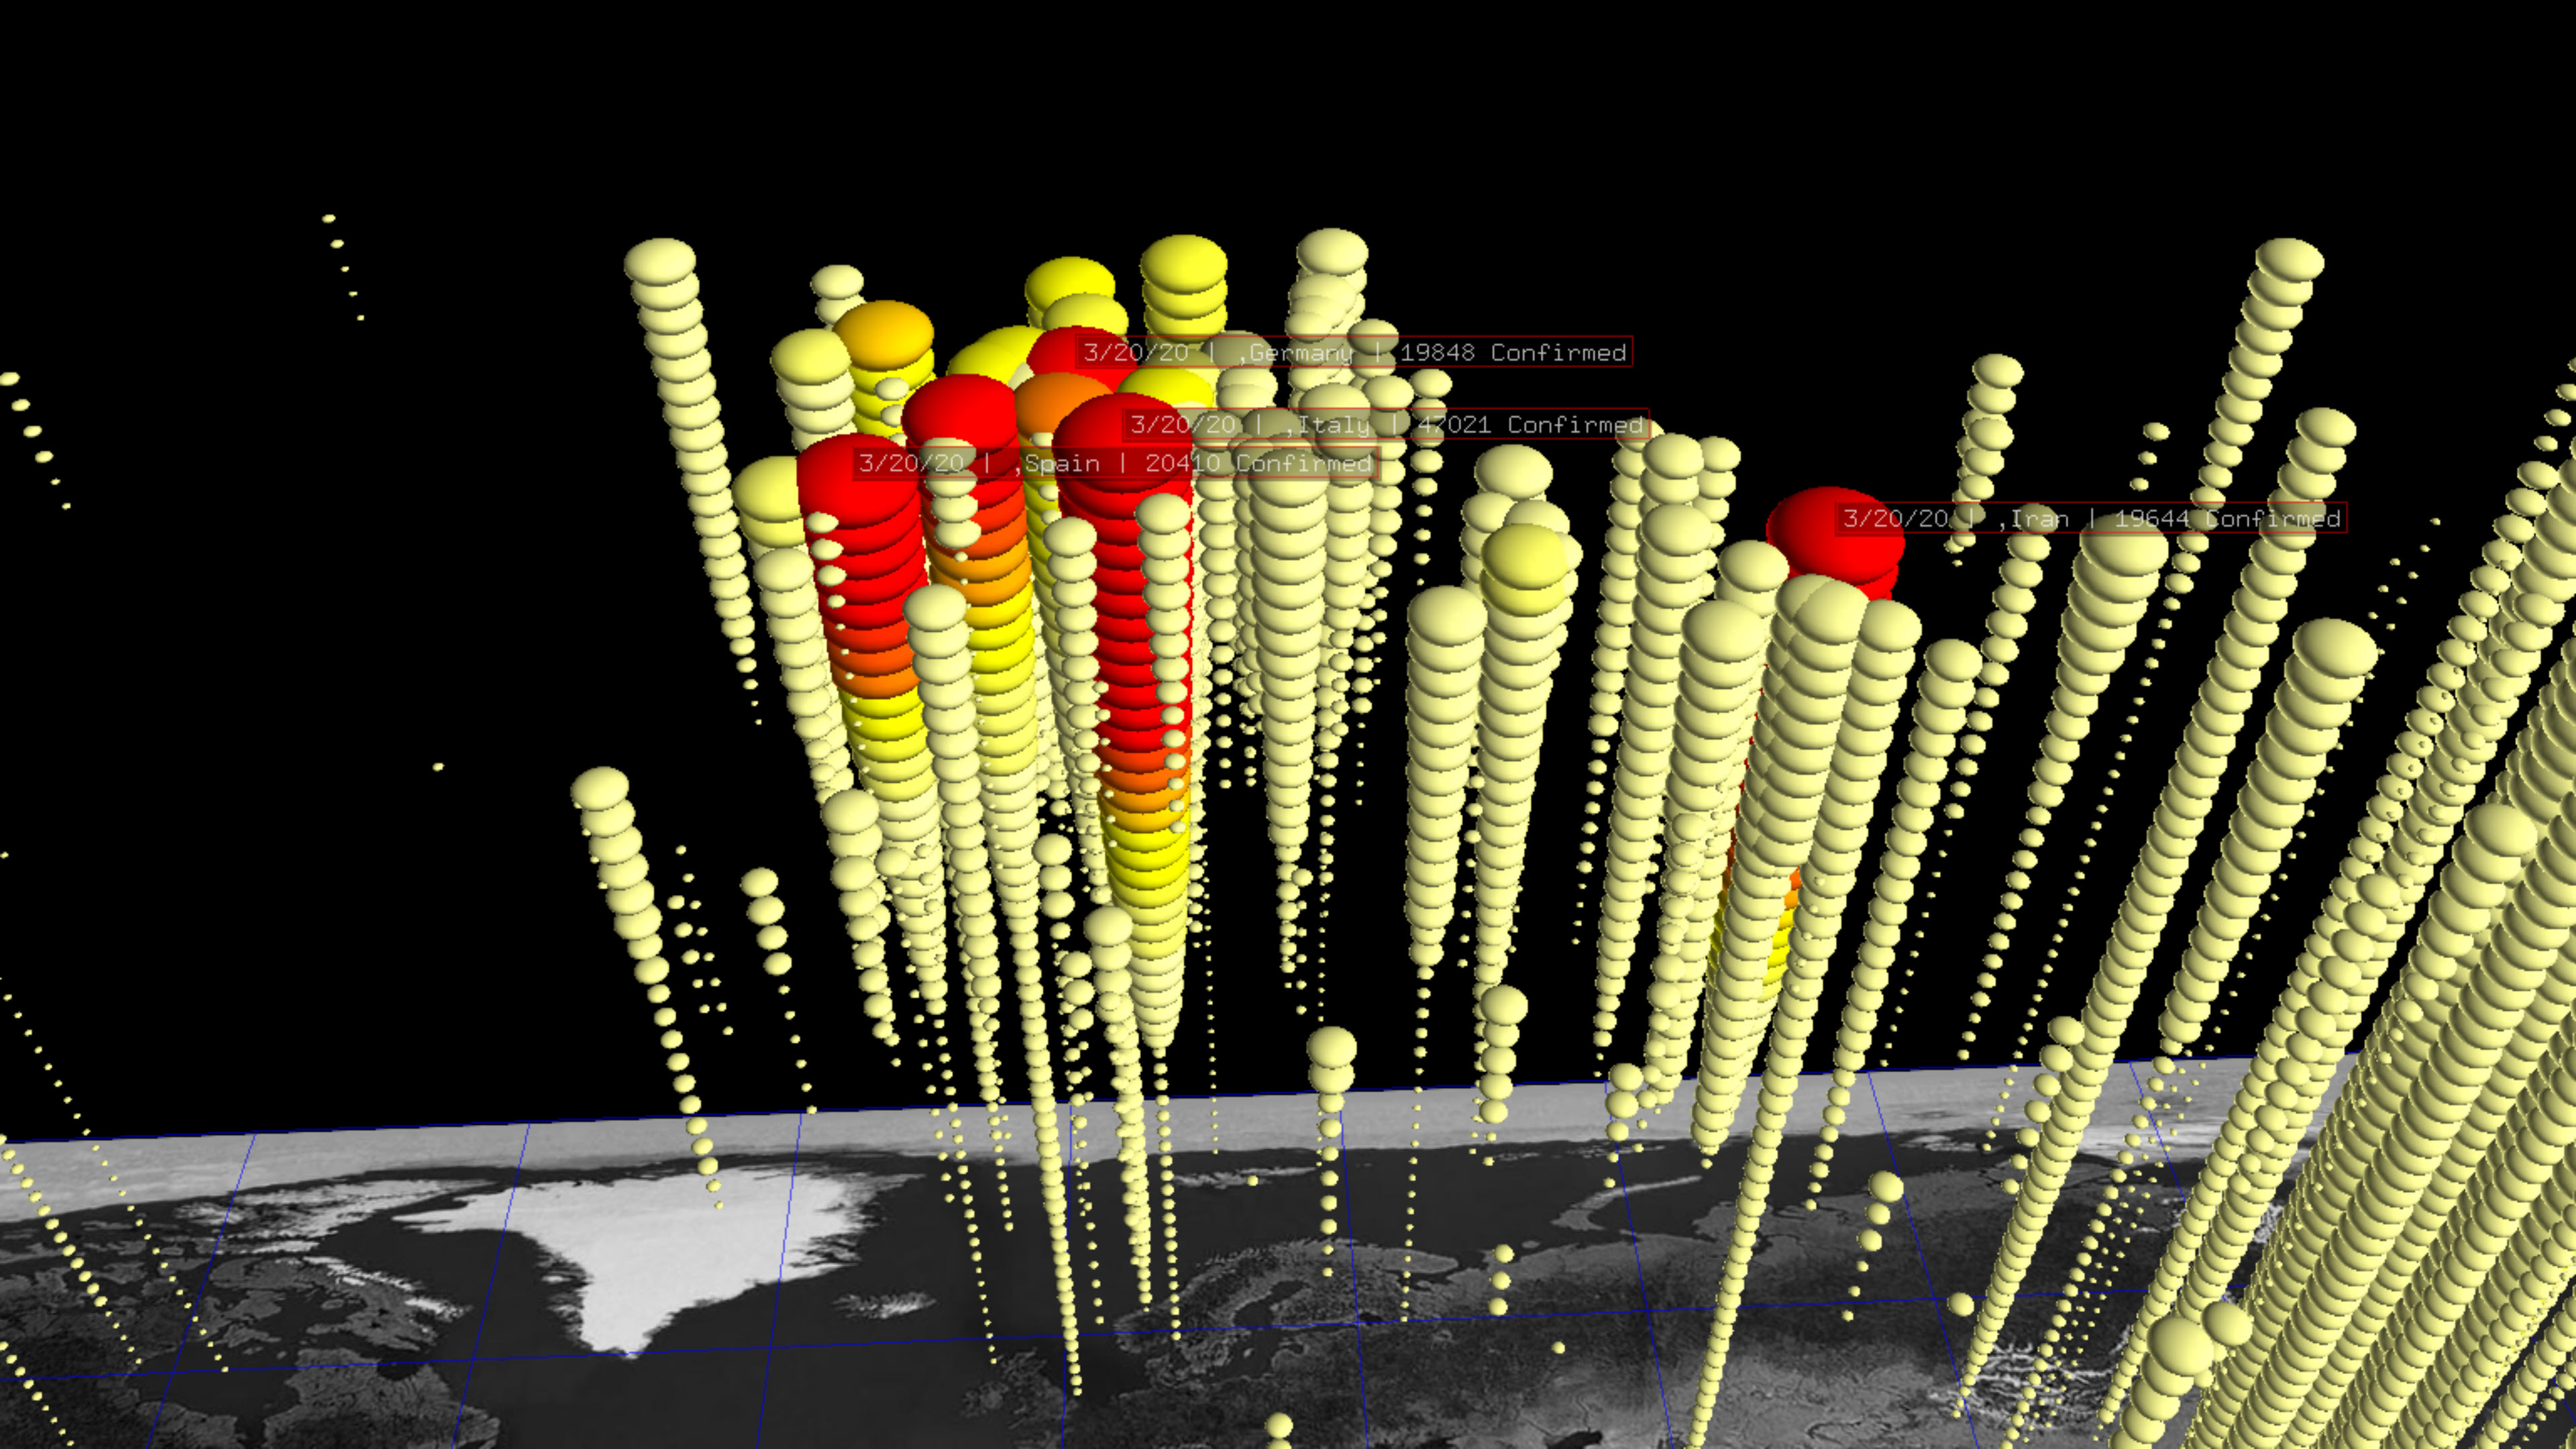
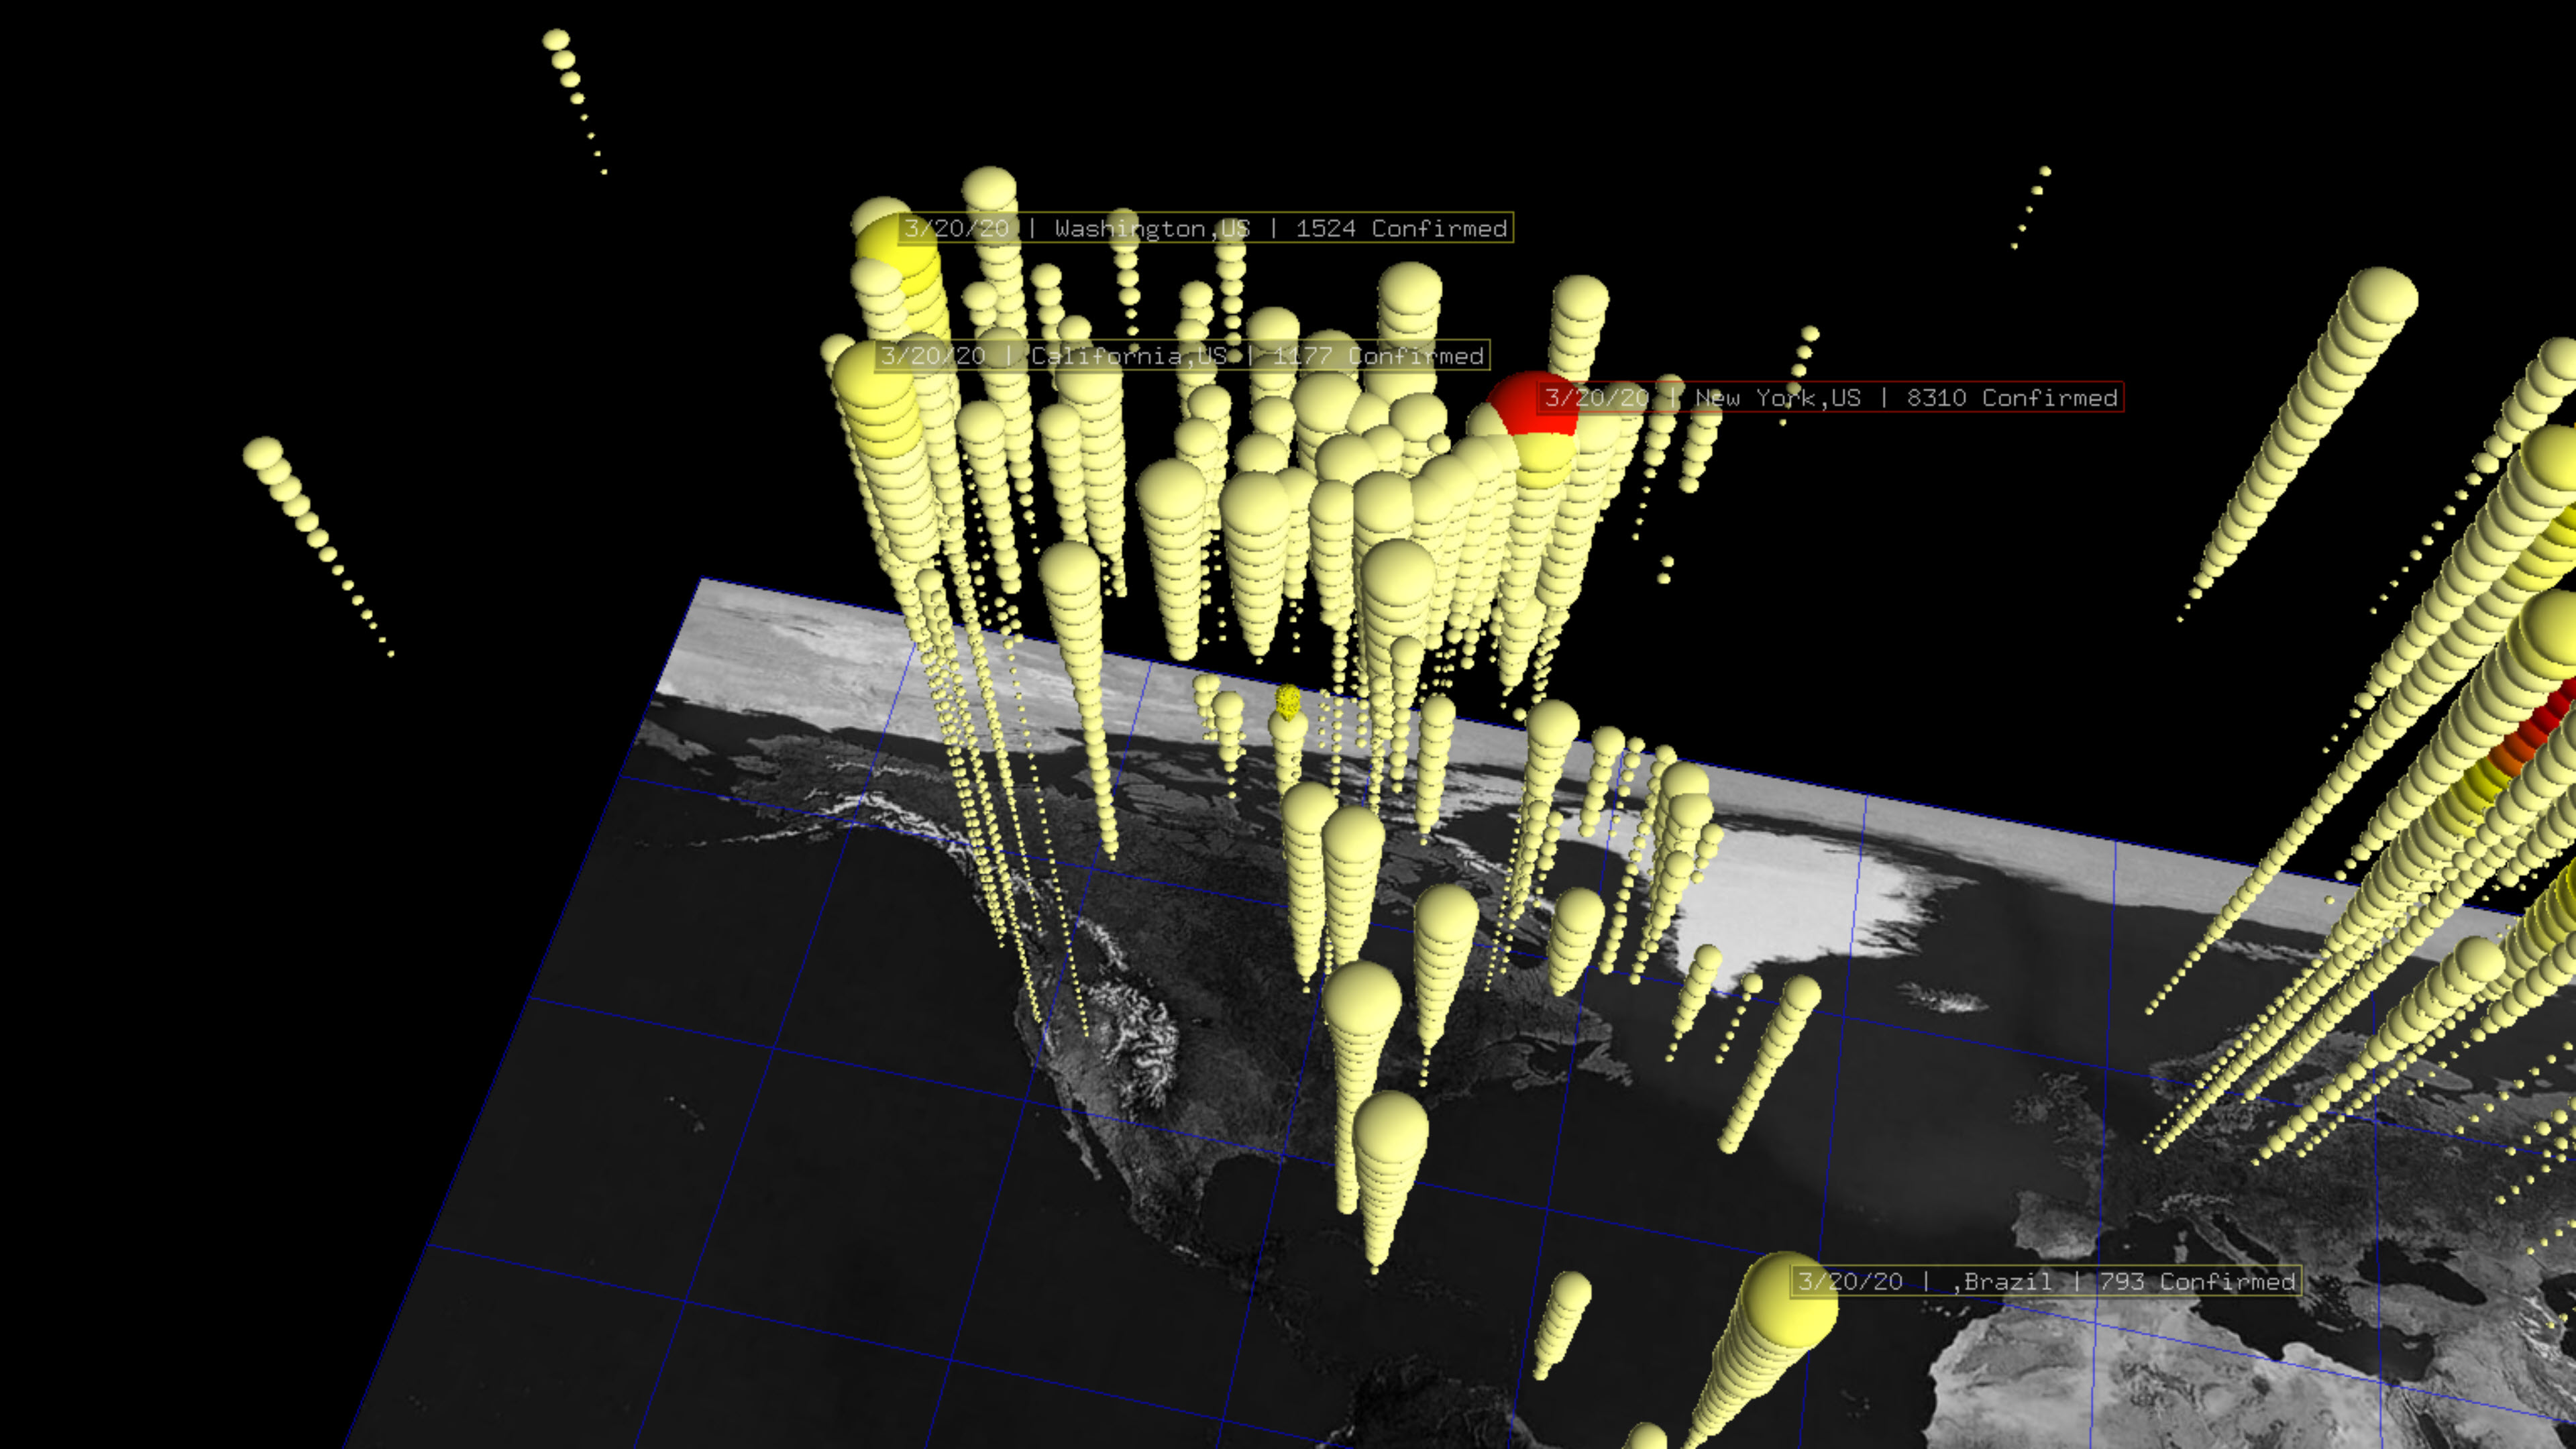
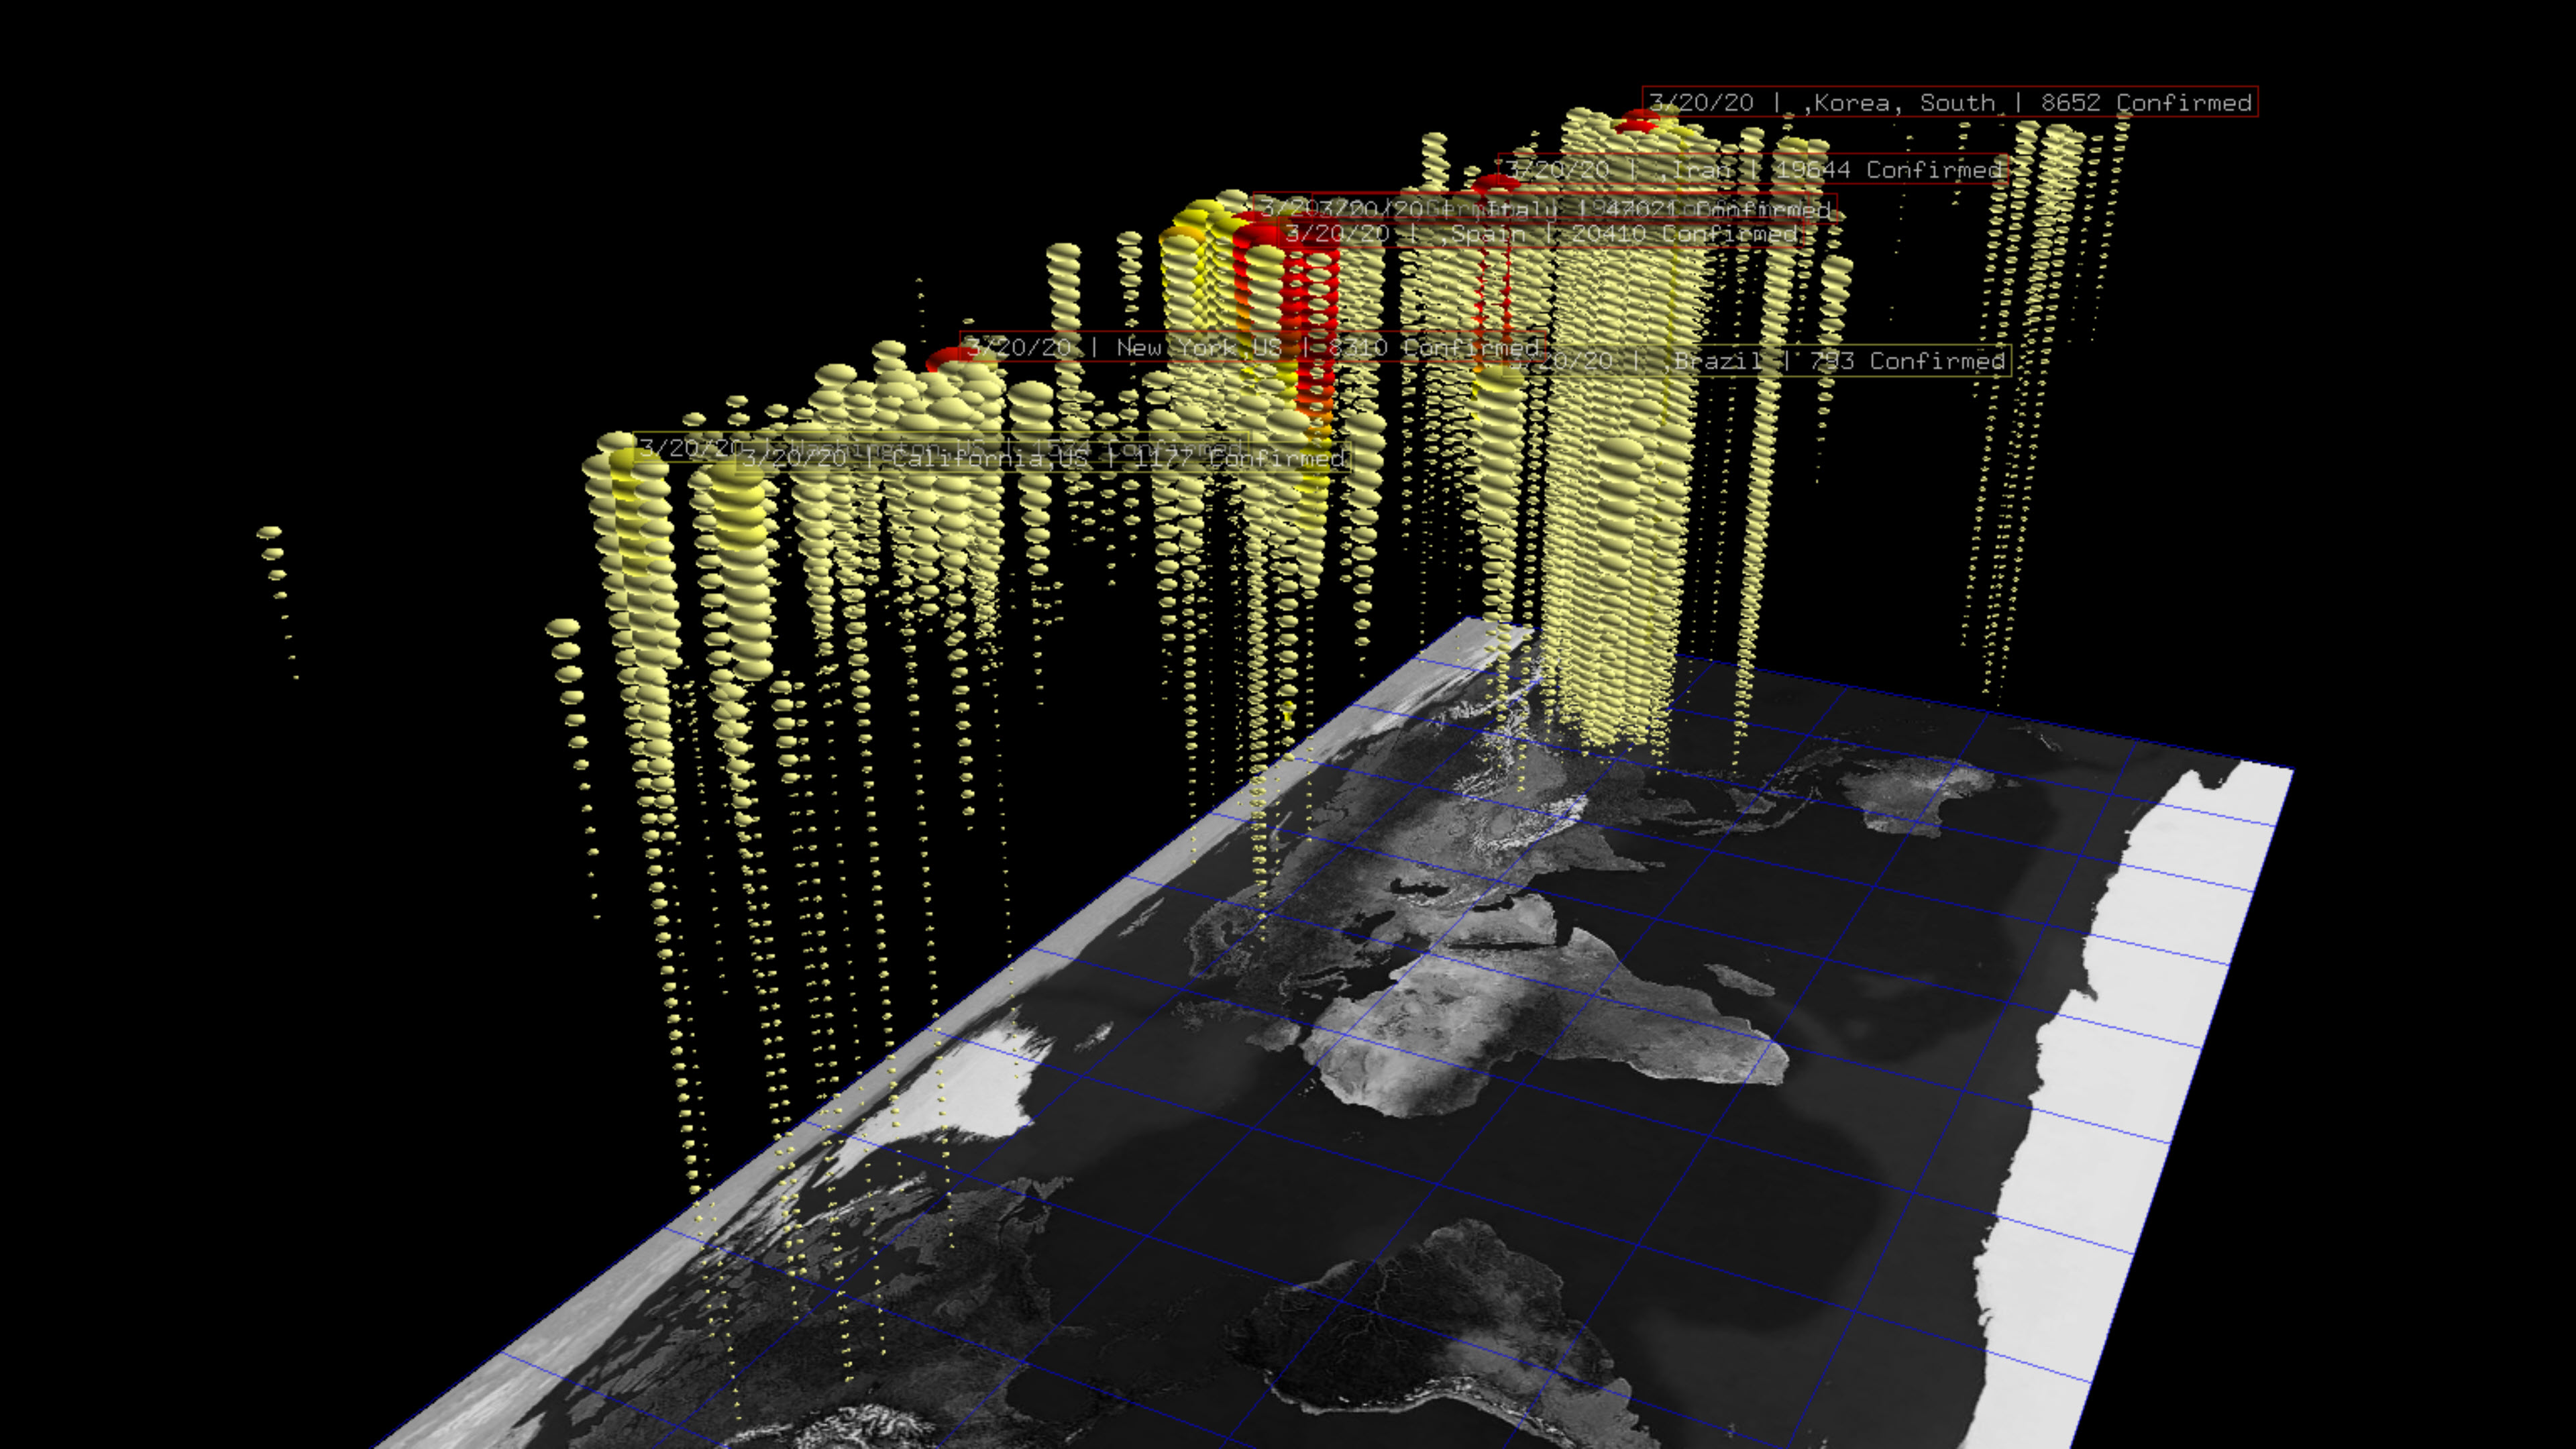
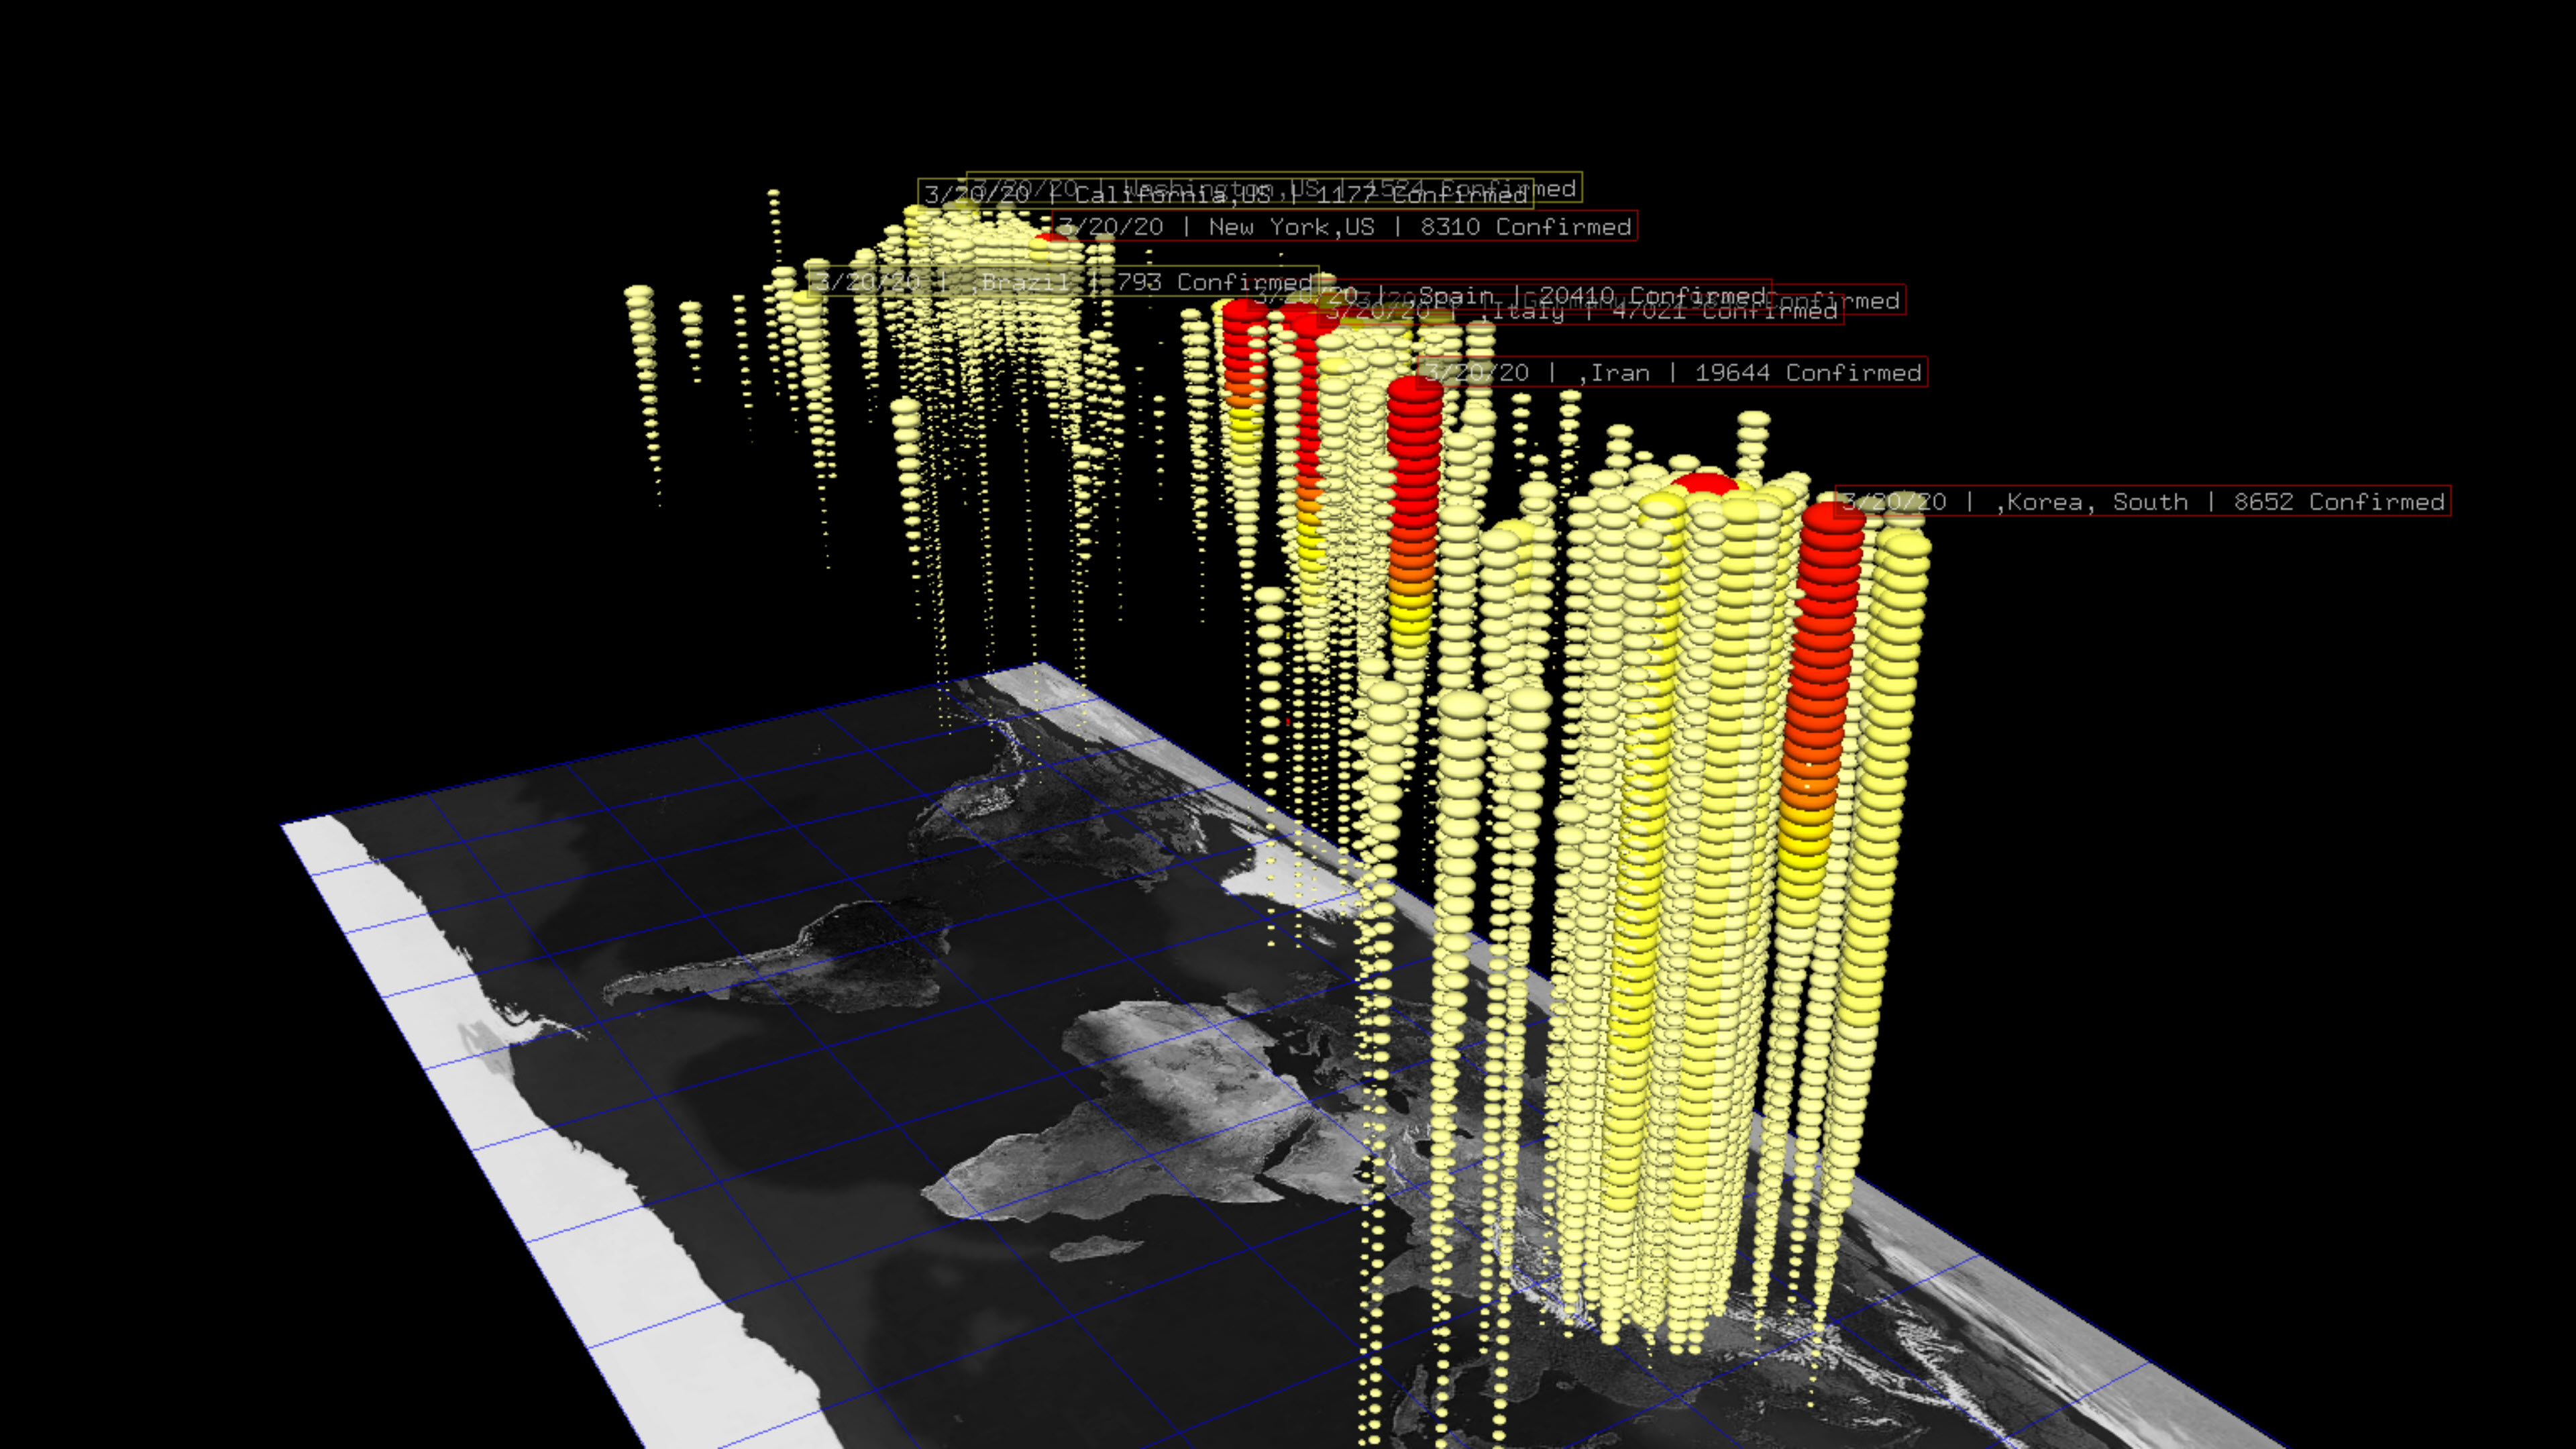
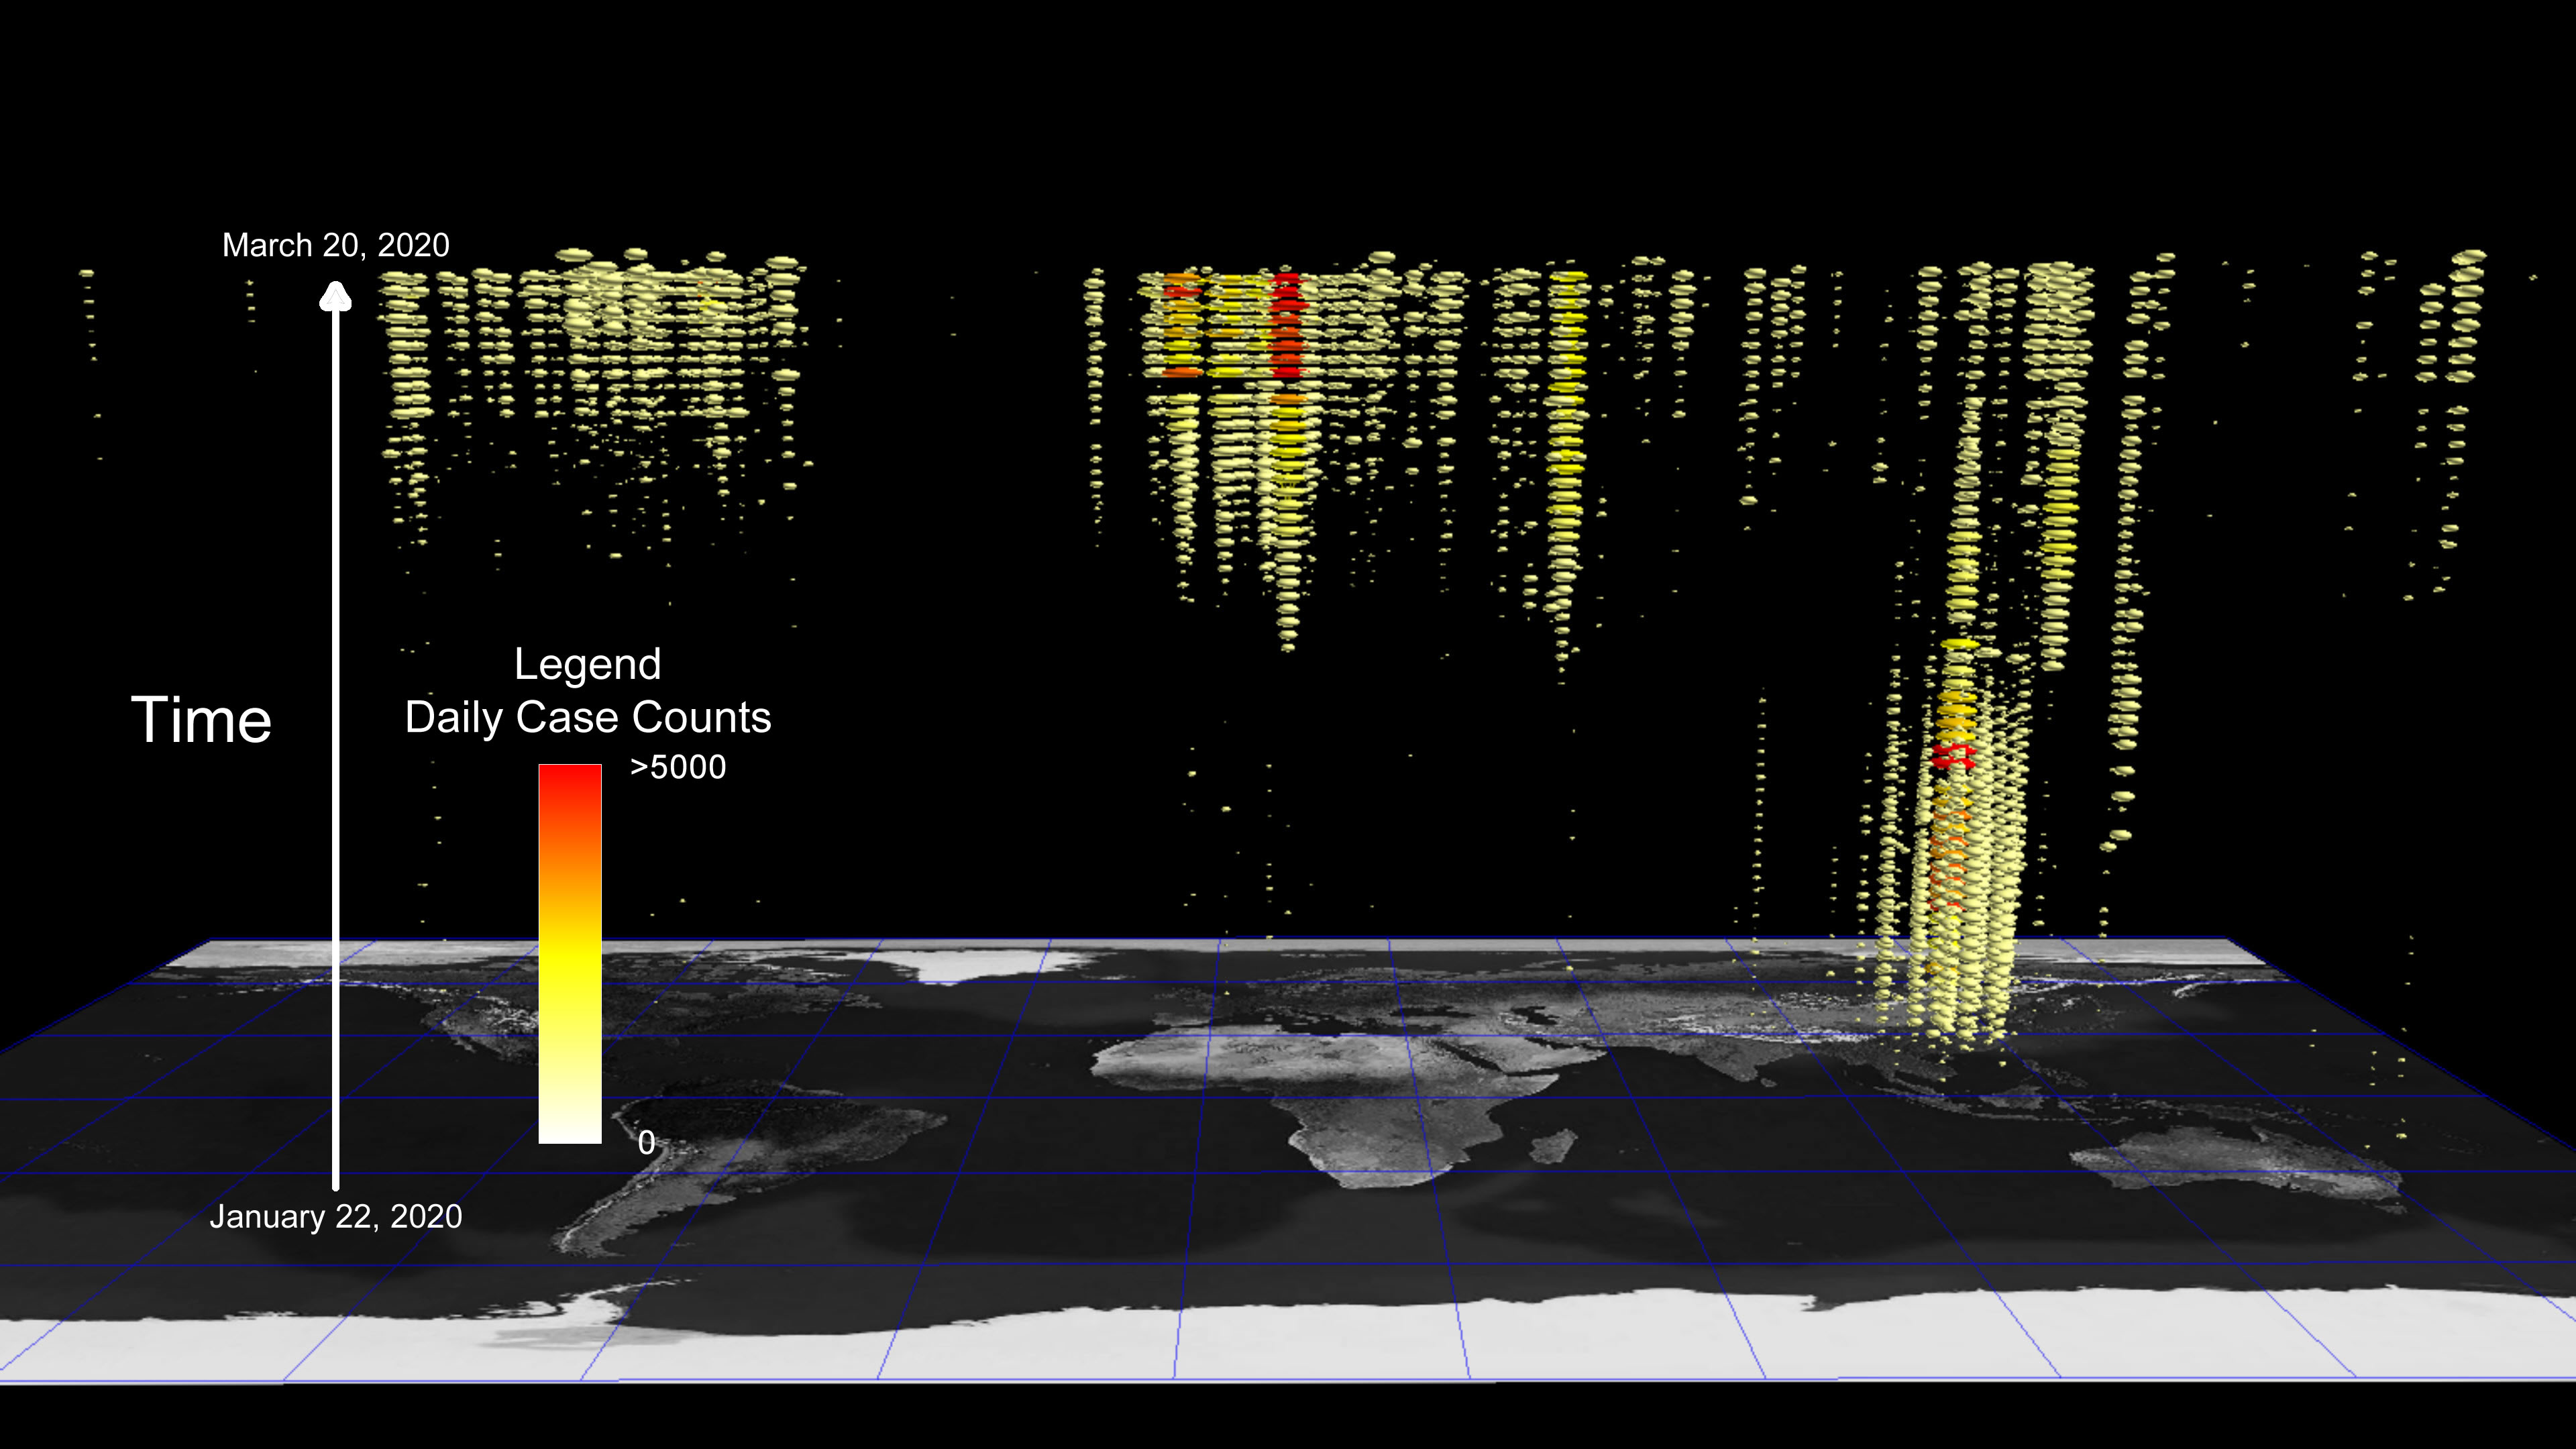
These images are visualizations of COVID-19 confirmed cases by country or region as of March 20,2020. They were created with the ANTz (Advanced NooTropic zietgiest) visualization tool. Learn more and download ANTz.
Time is vertical with earlier dates lower than later dates. Color and scale both represent the cumulative number of confirmed cases per day.
We include two different scaling methods, linear and log. Linear scale allows for a more intuitive sense of the relattive magnitudes of a country's cumulative number of cases. The drawback is that large numbers mean larger objects which obscure smaller objects. Log scale helps to avoid this problem. Color provides a common reference between the two methods.
Linear Scale
Download interactive visualization.
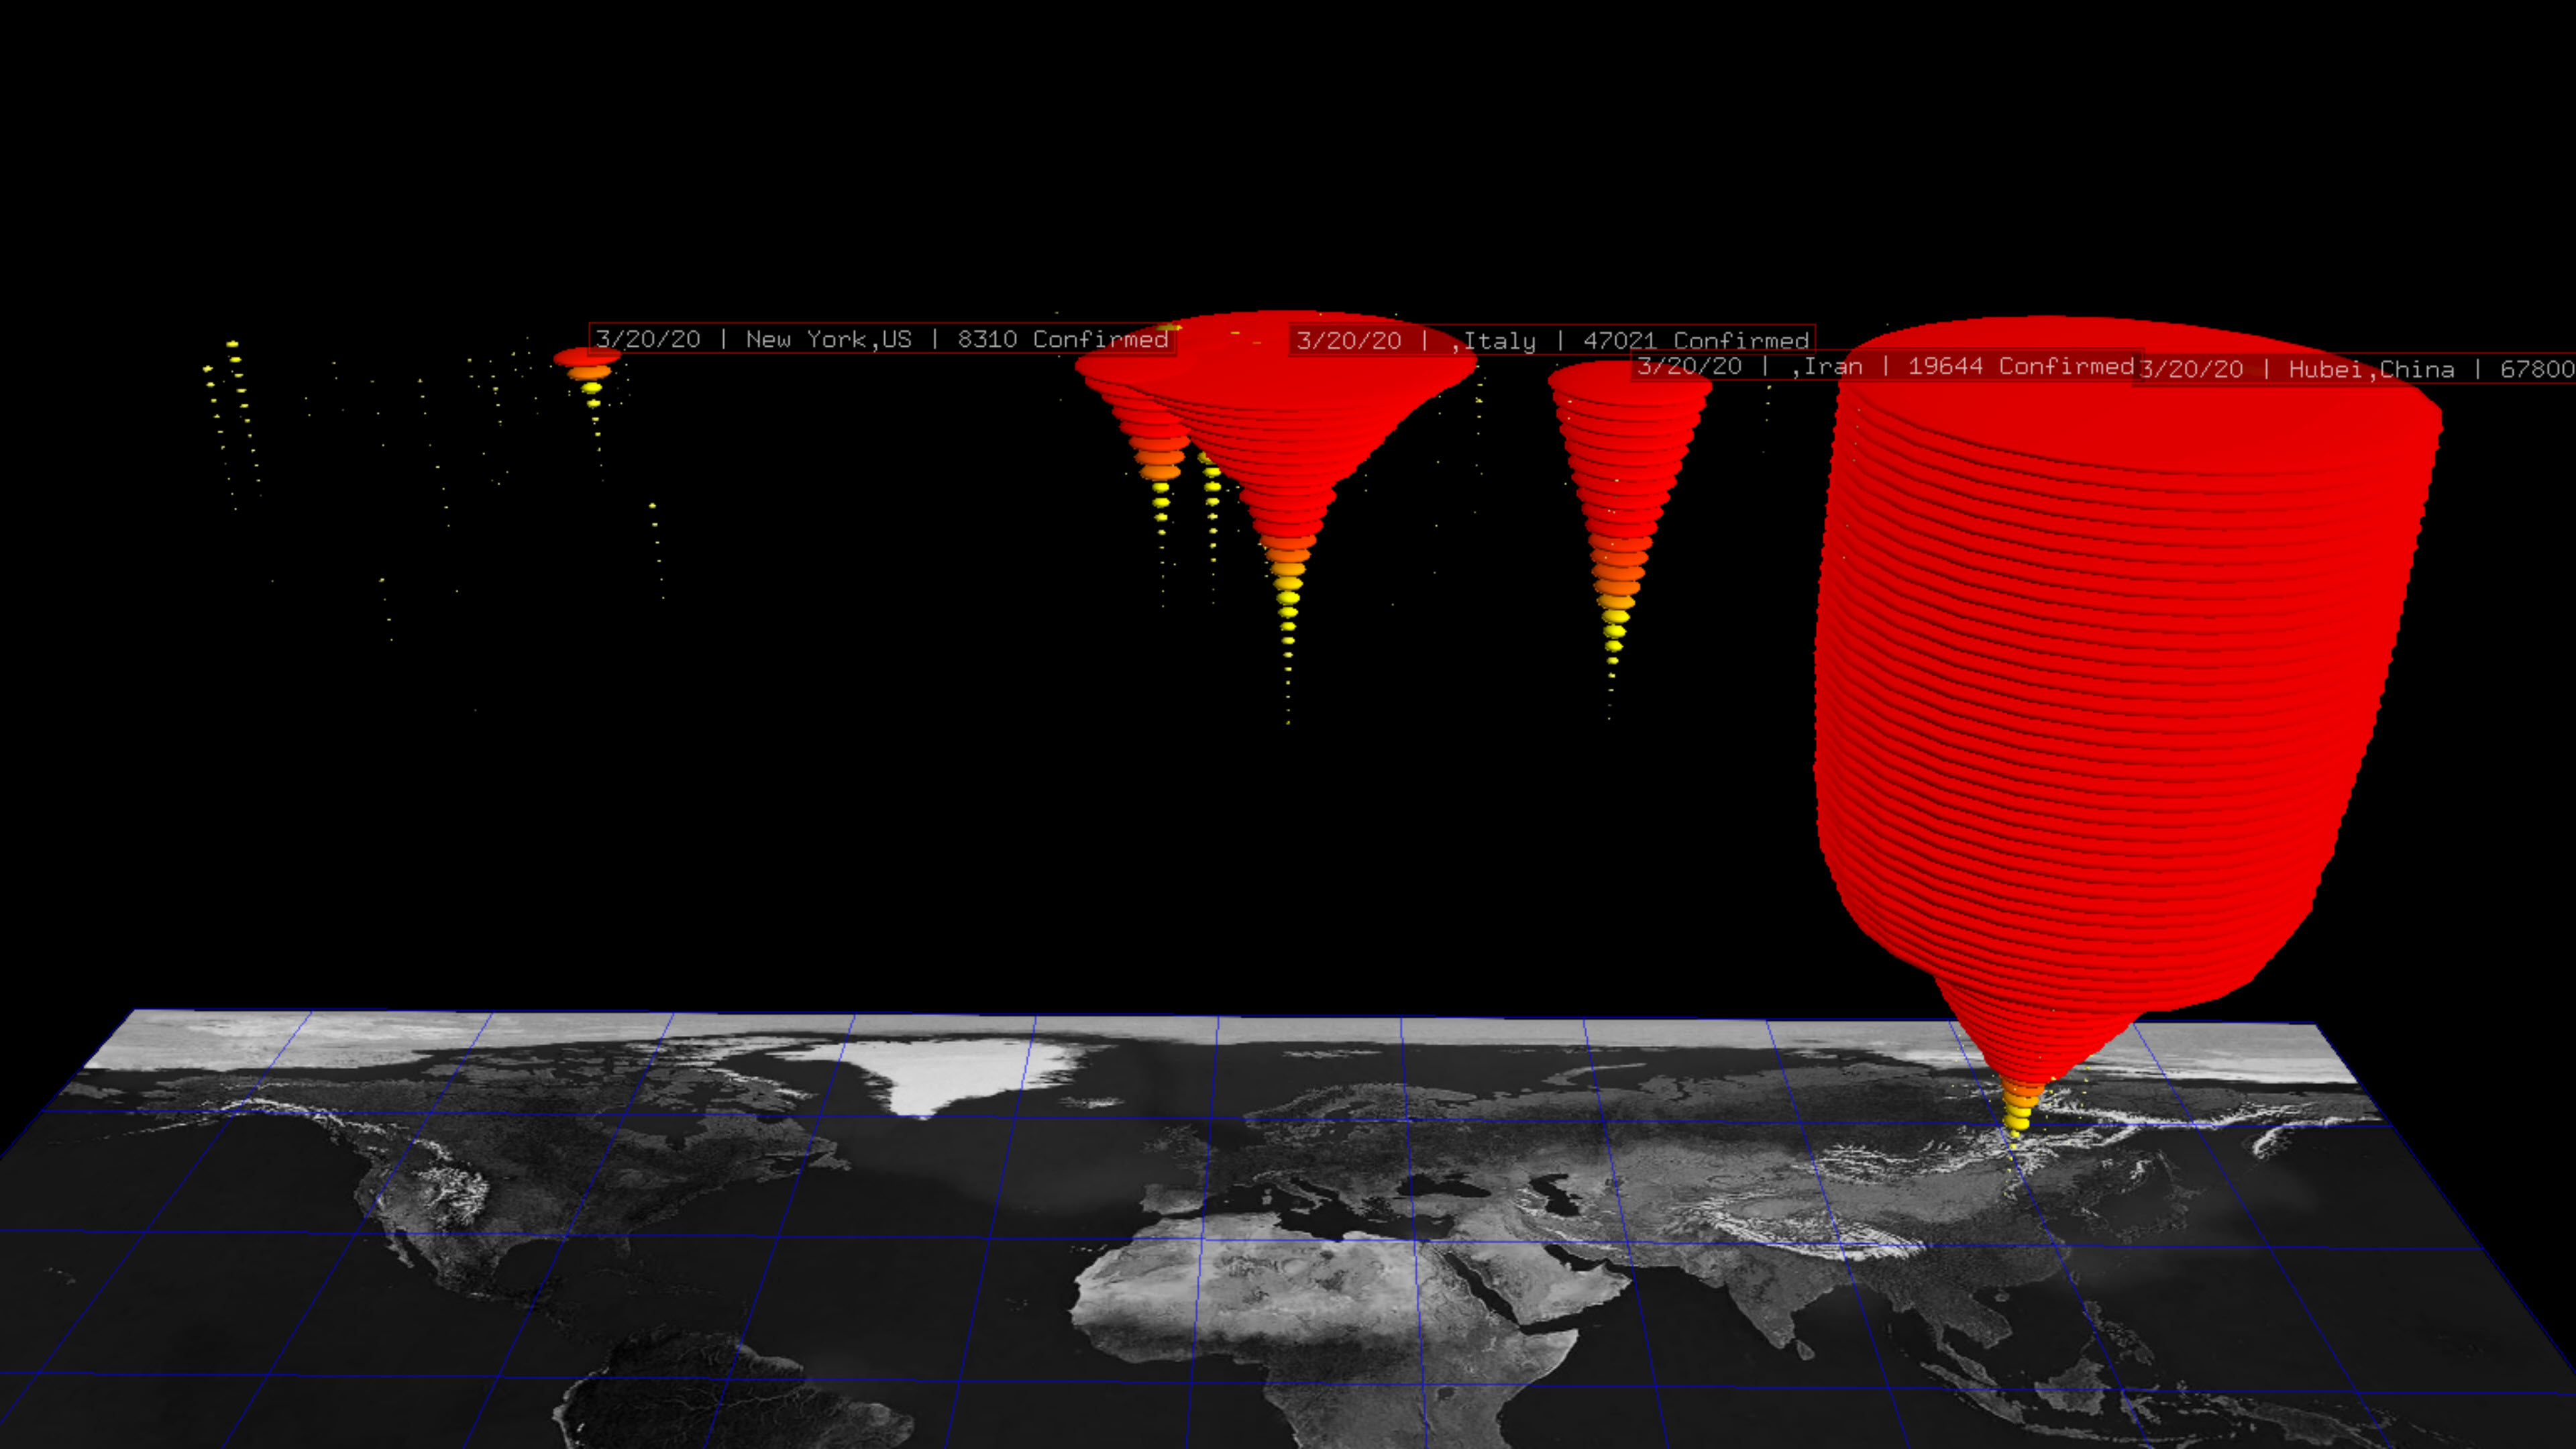
Log Scale
Download interactive visualization.
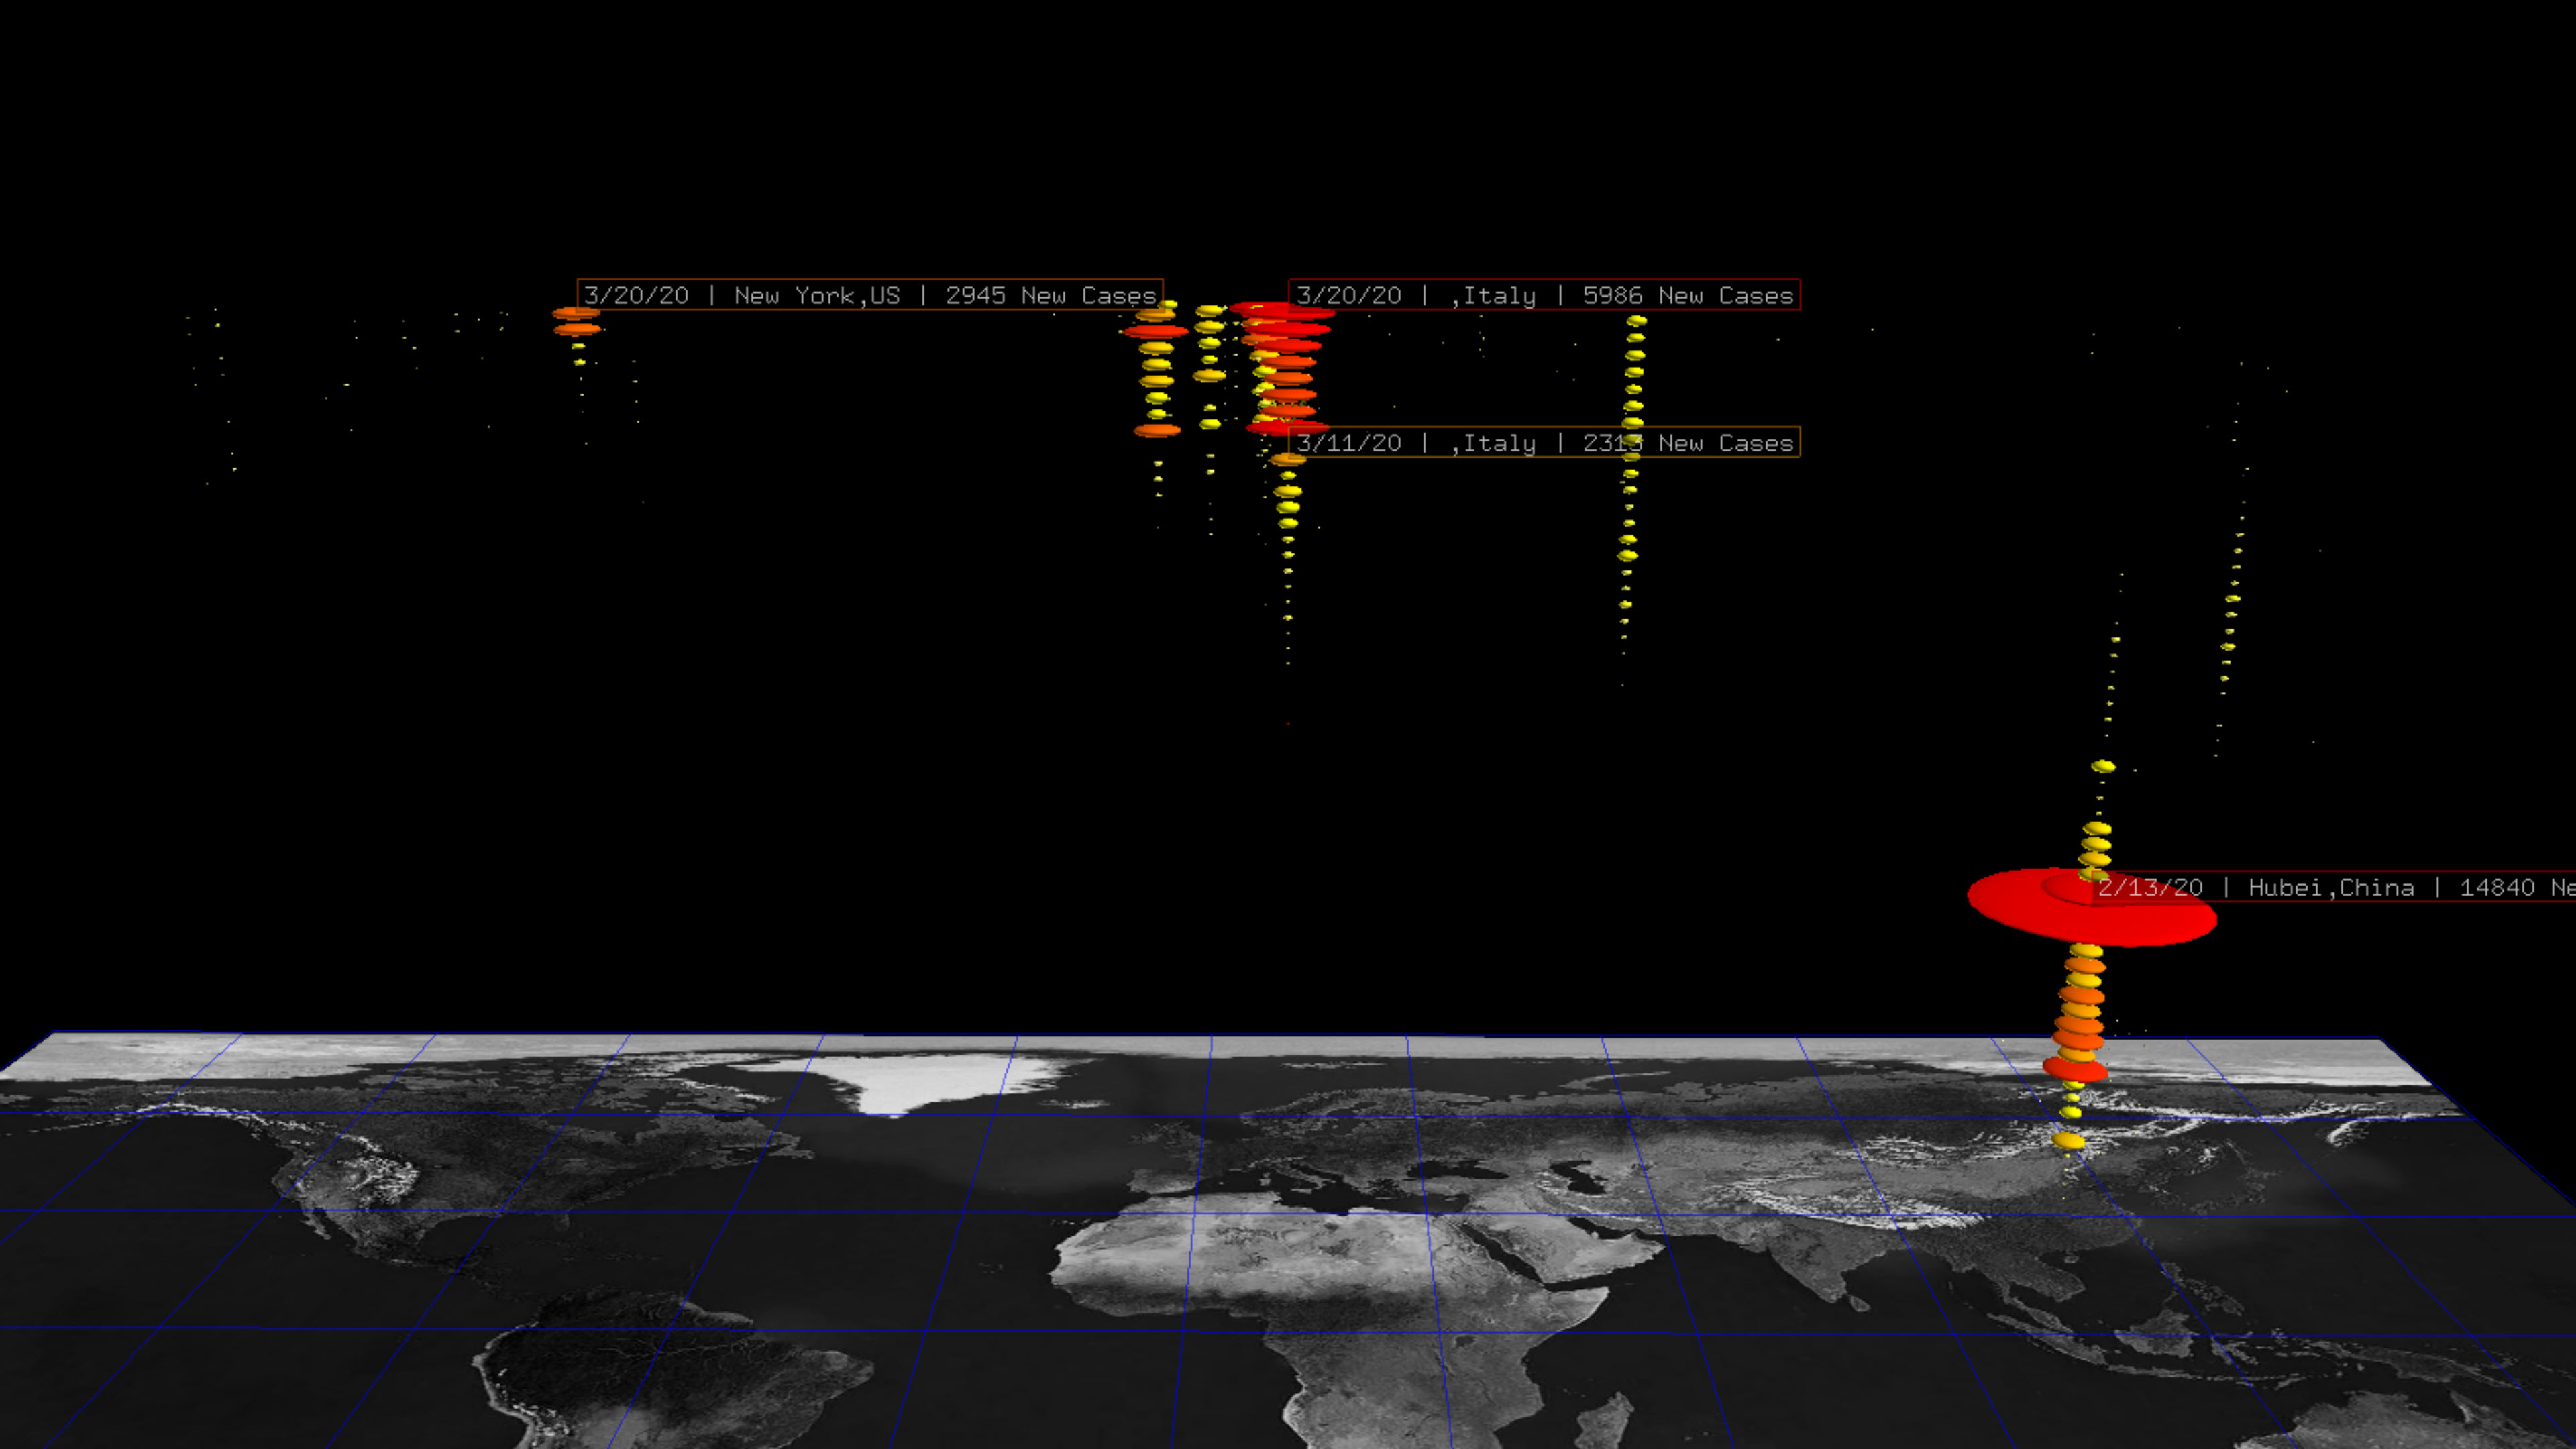
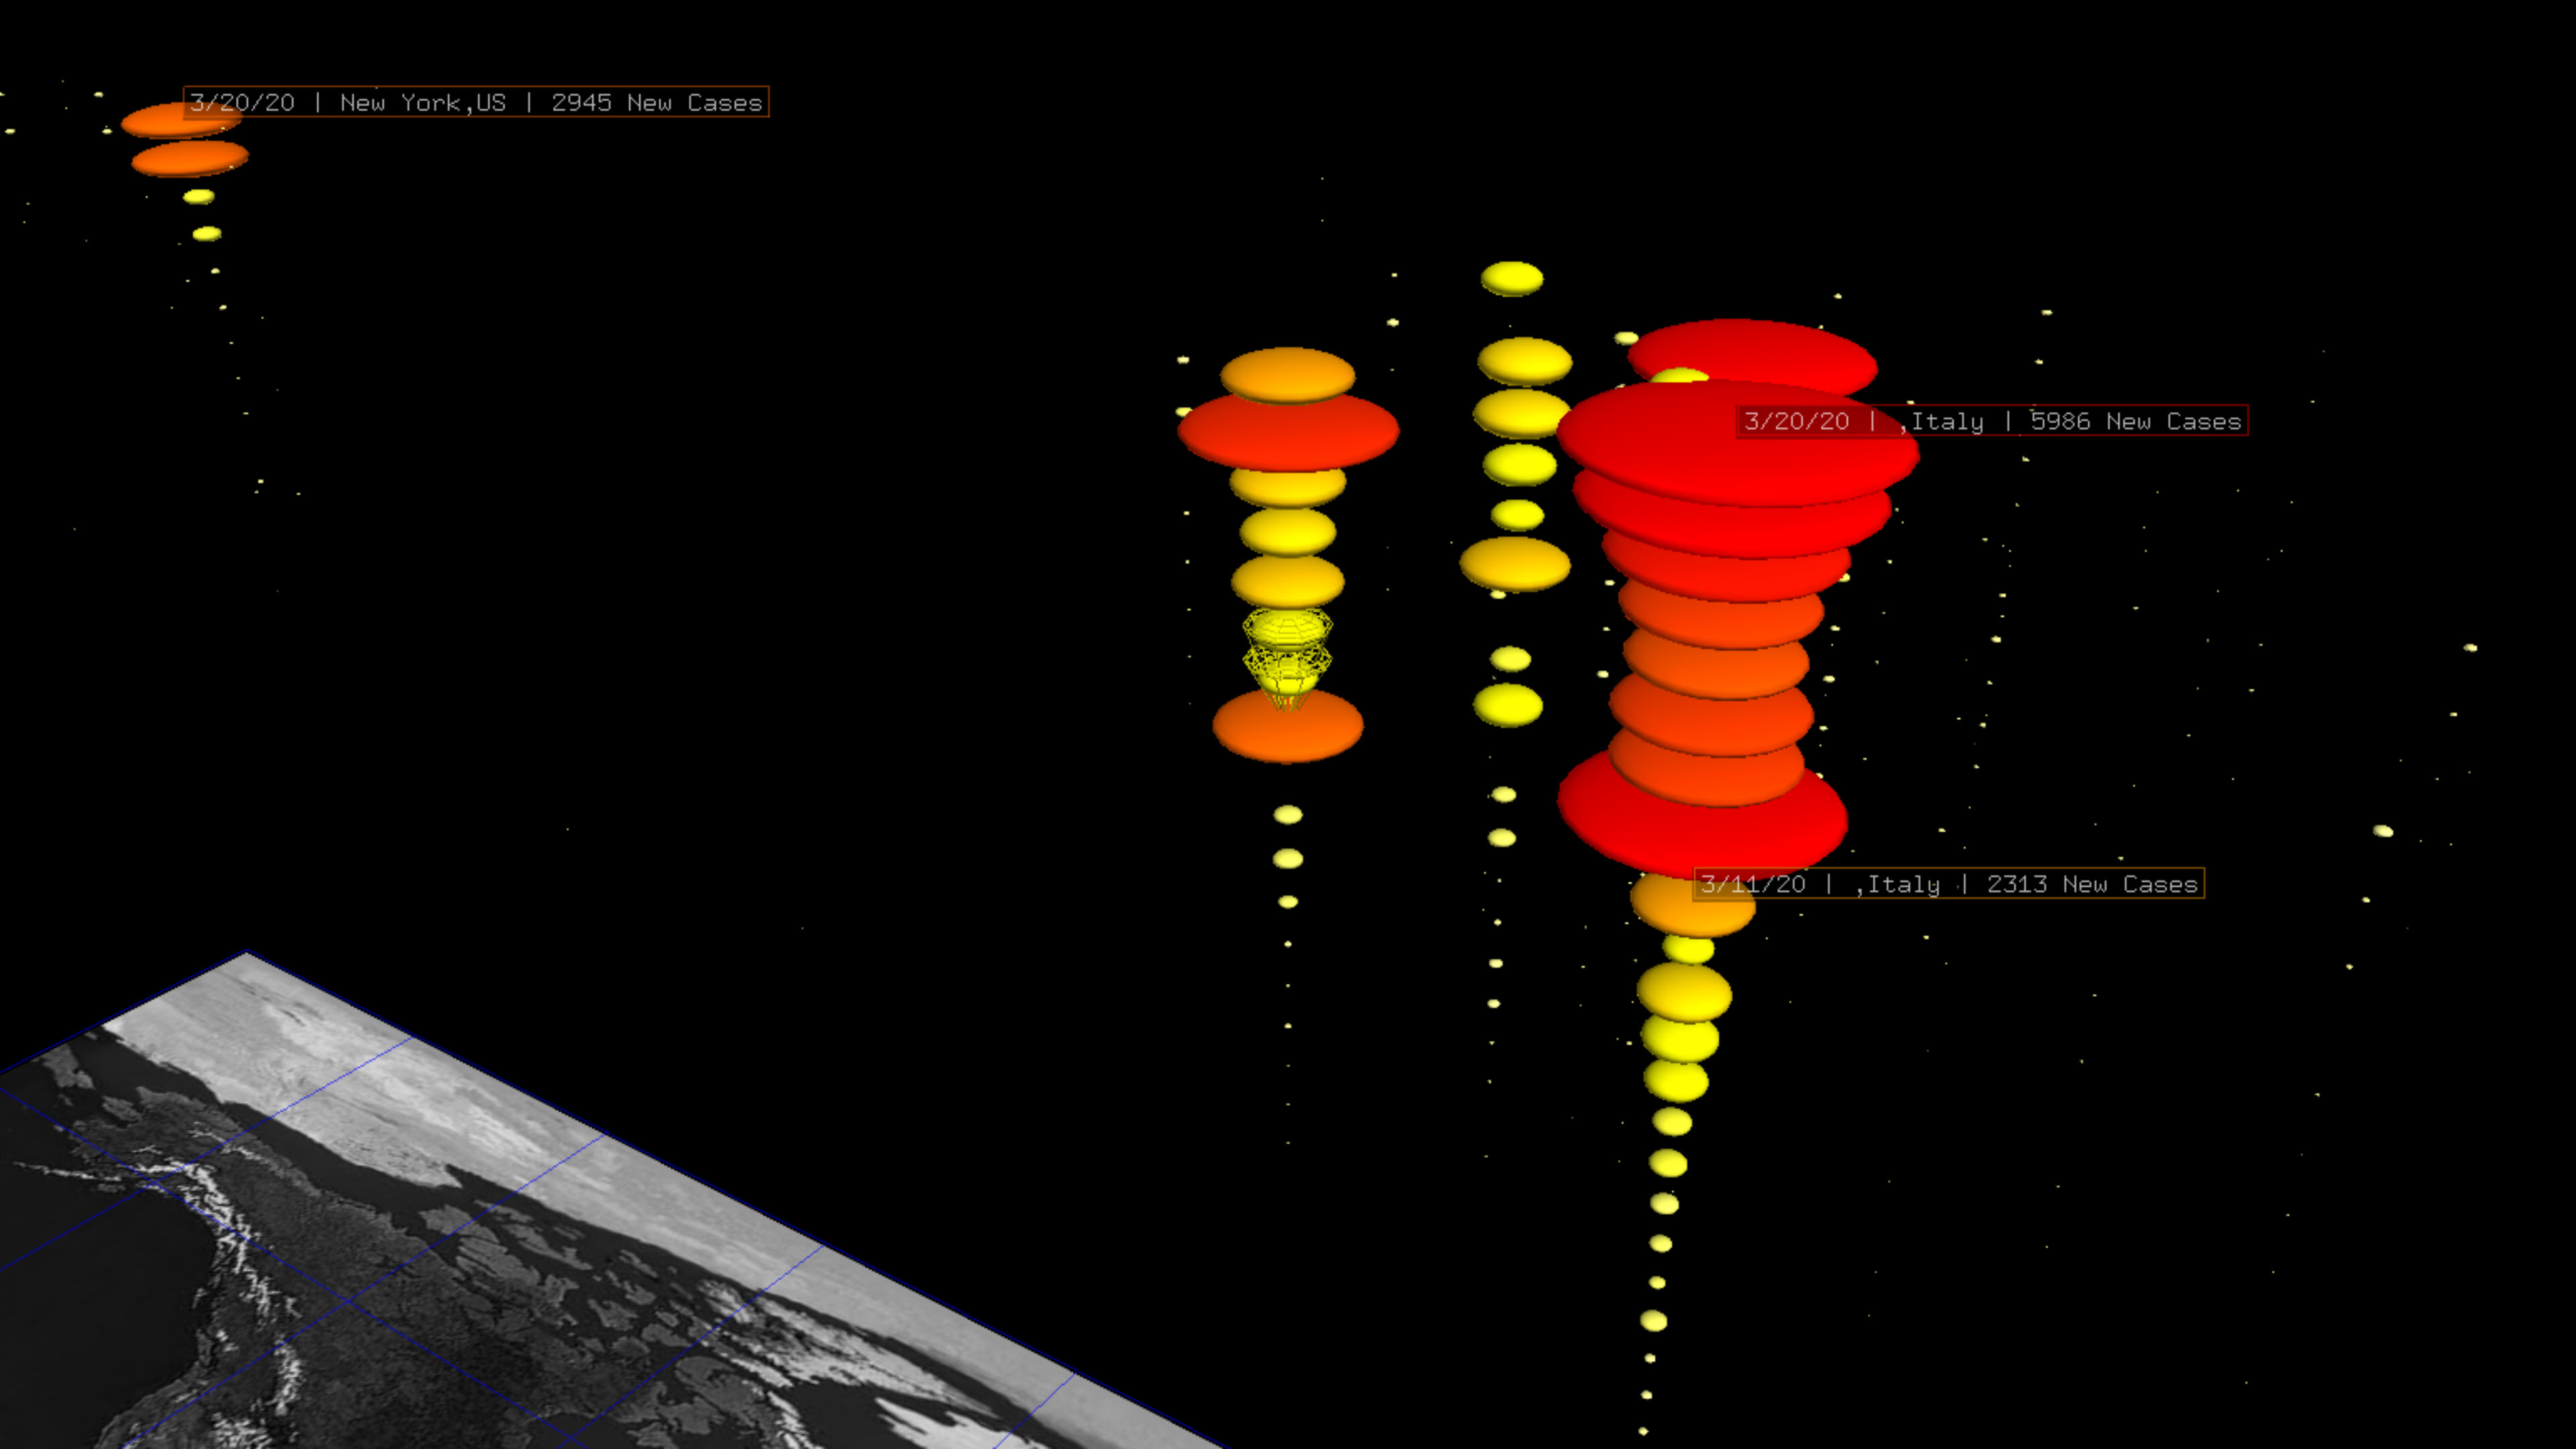
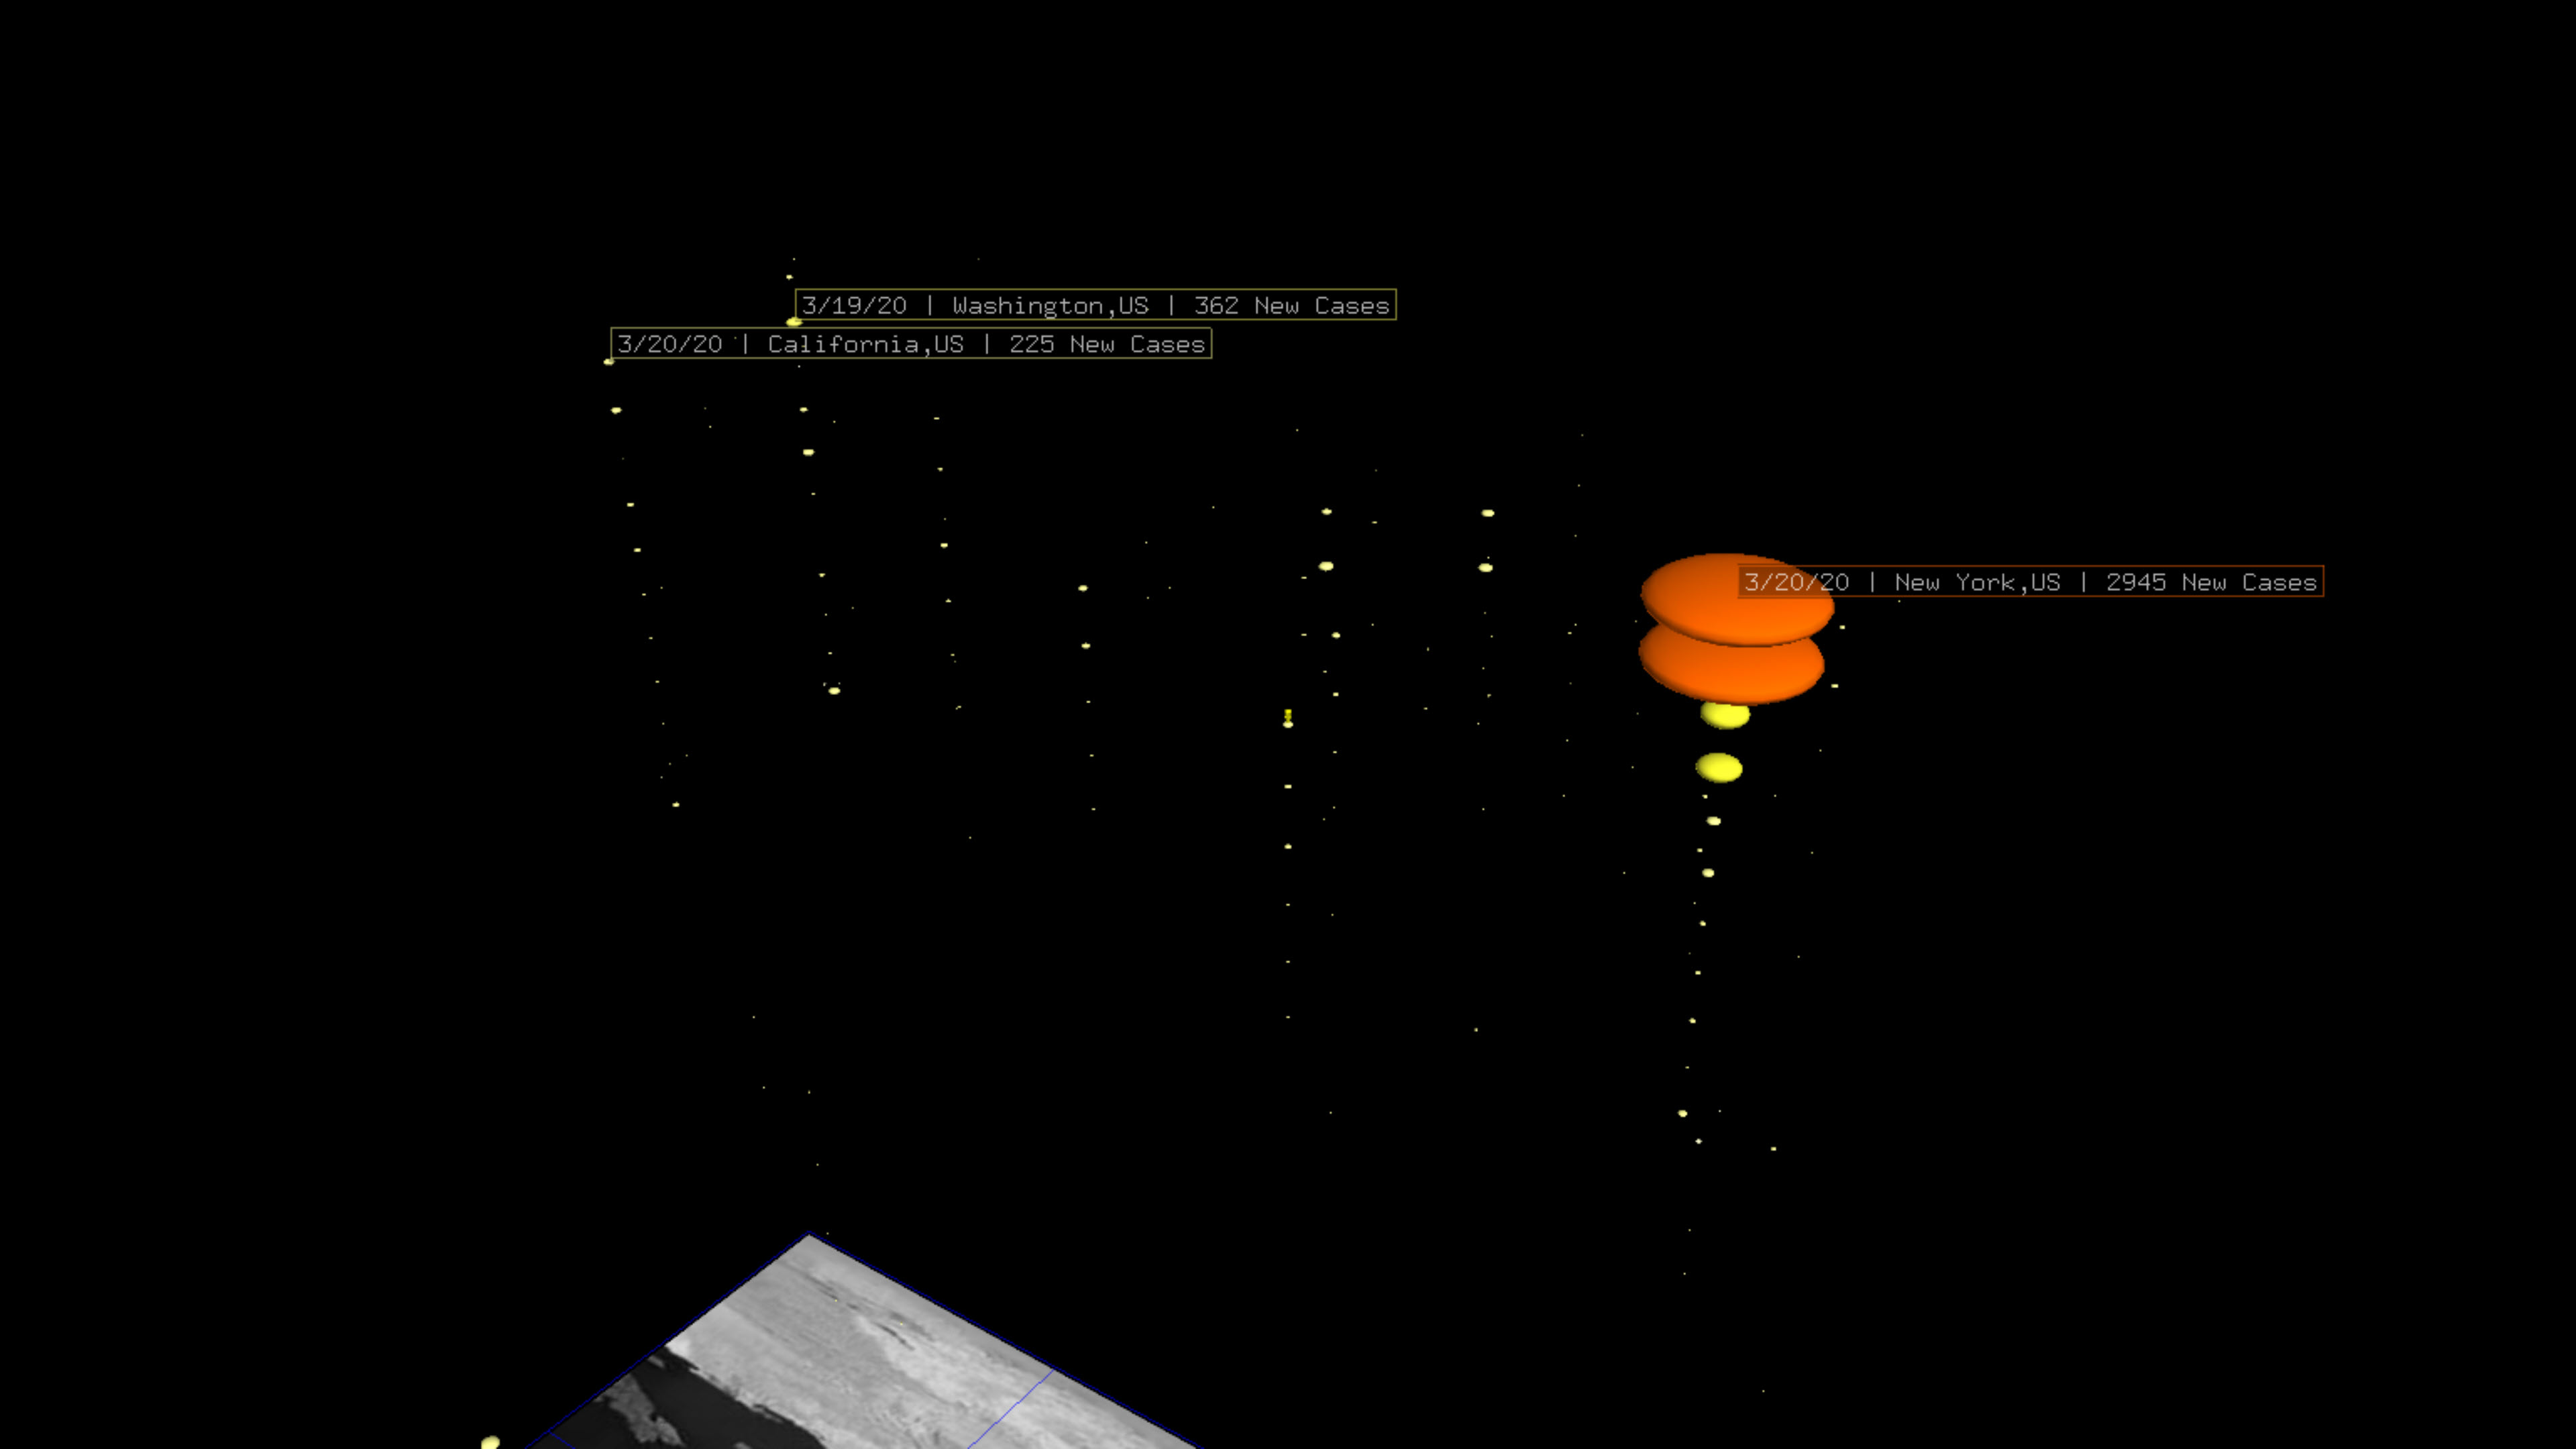
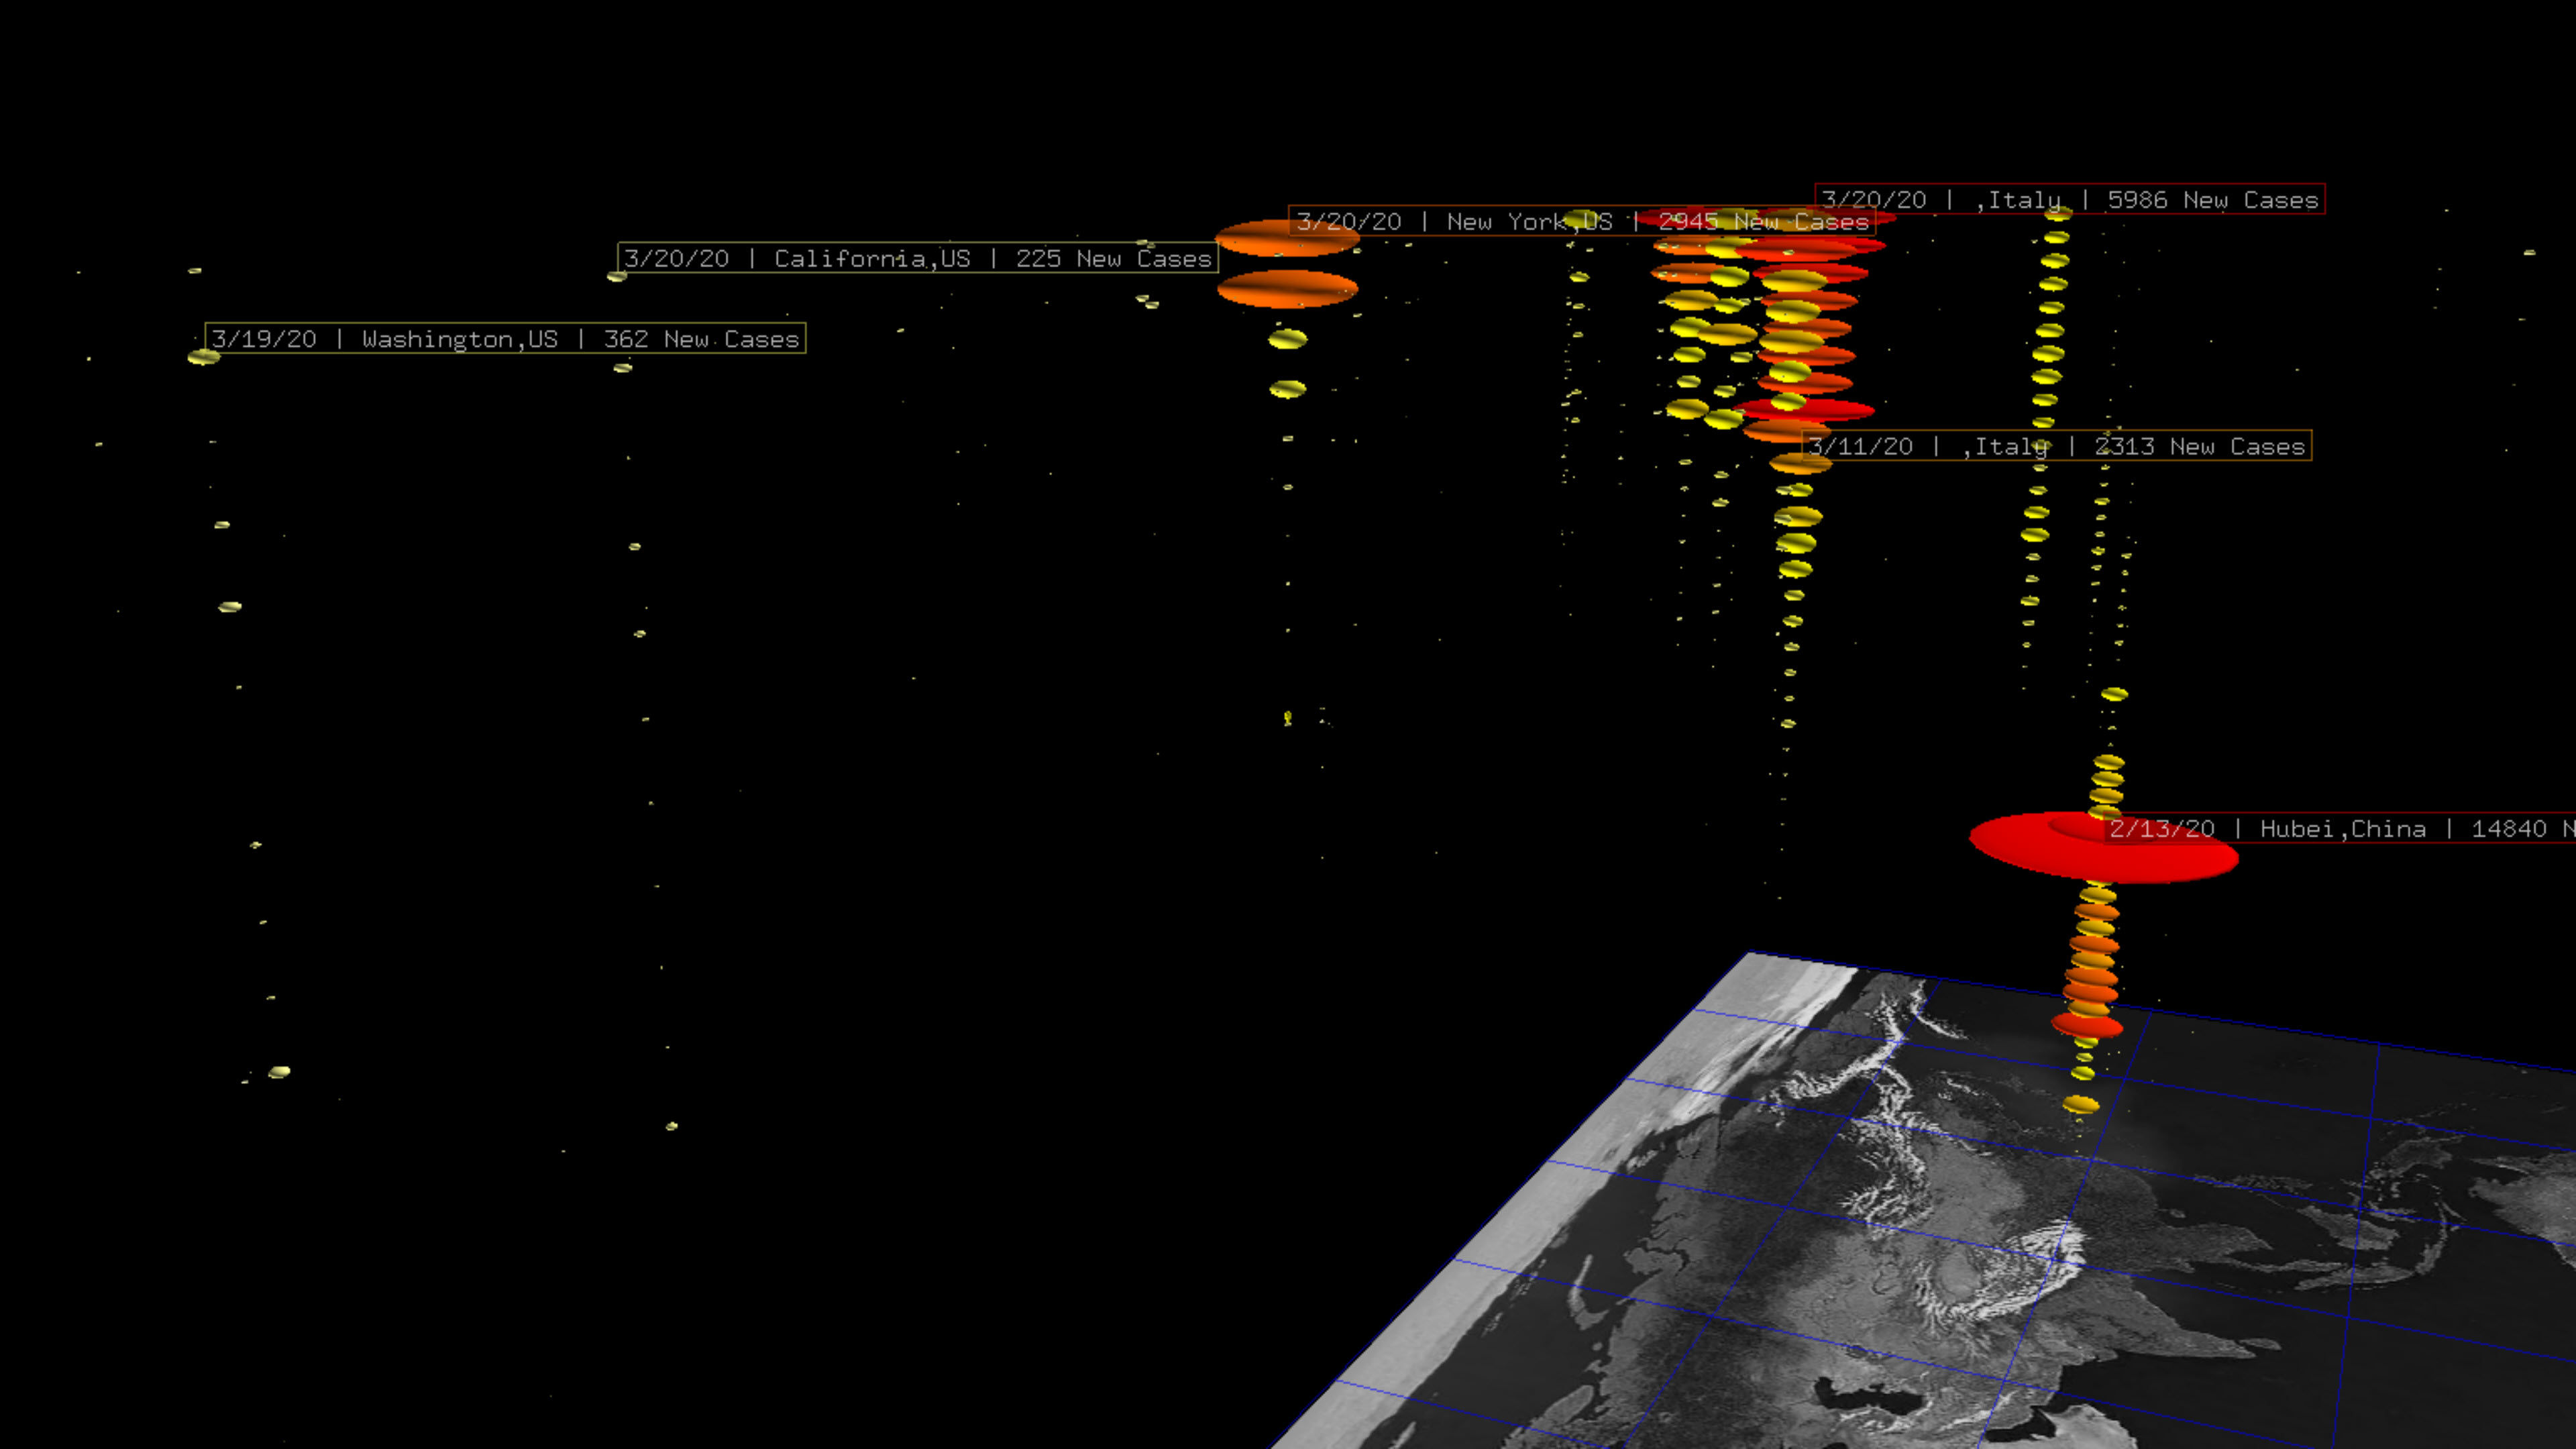
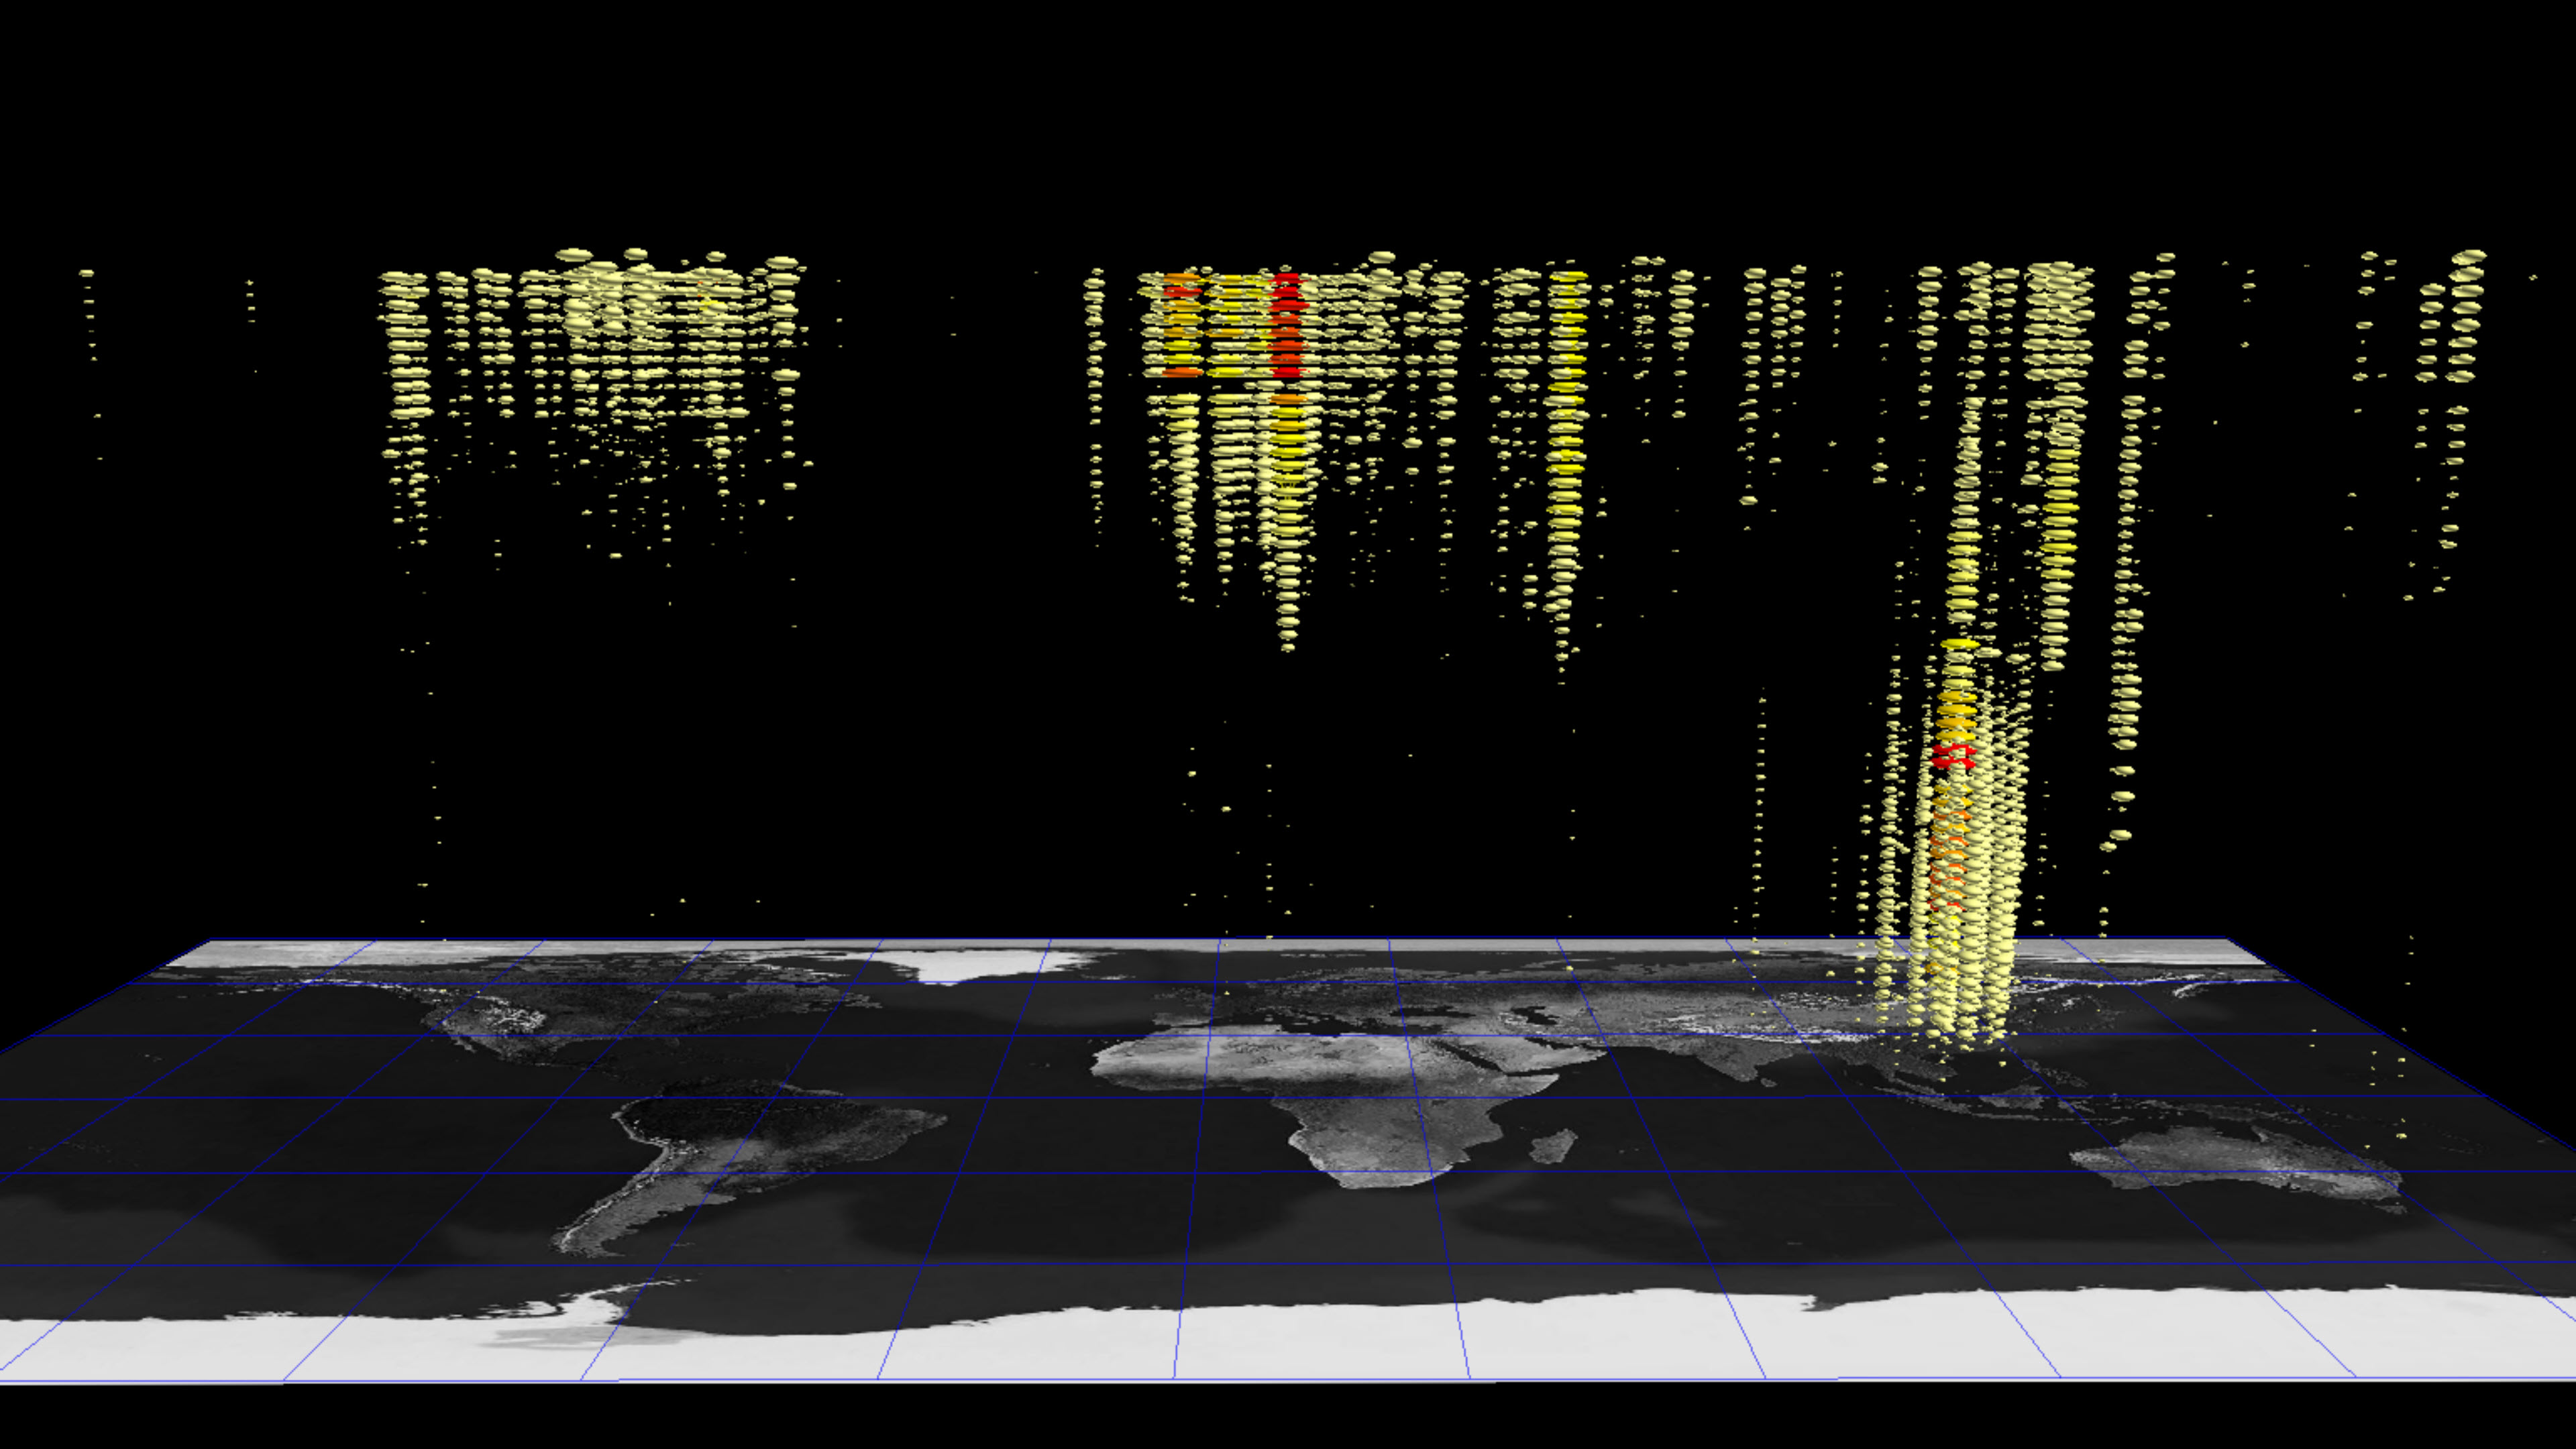
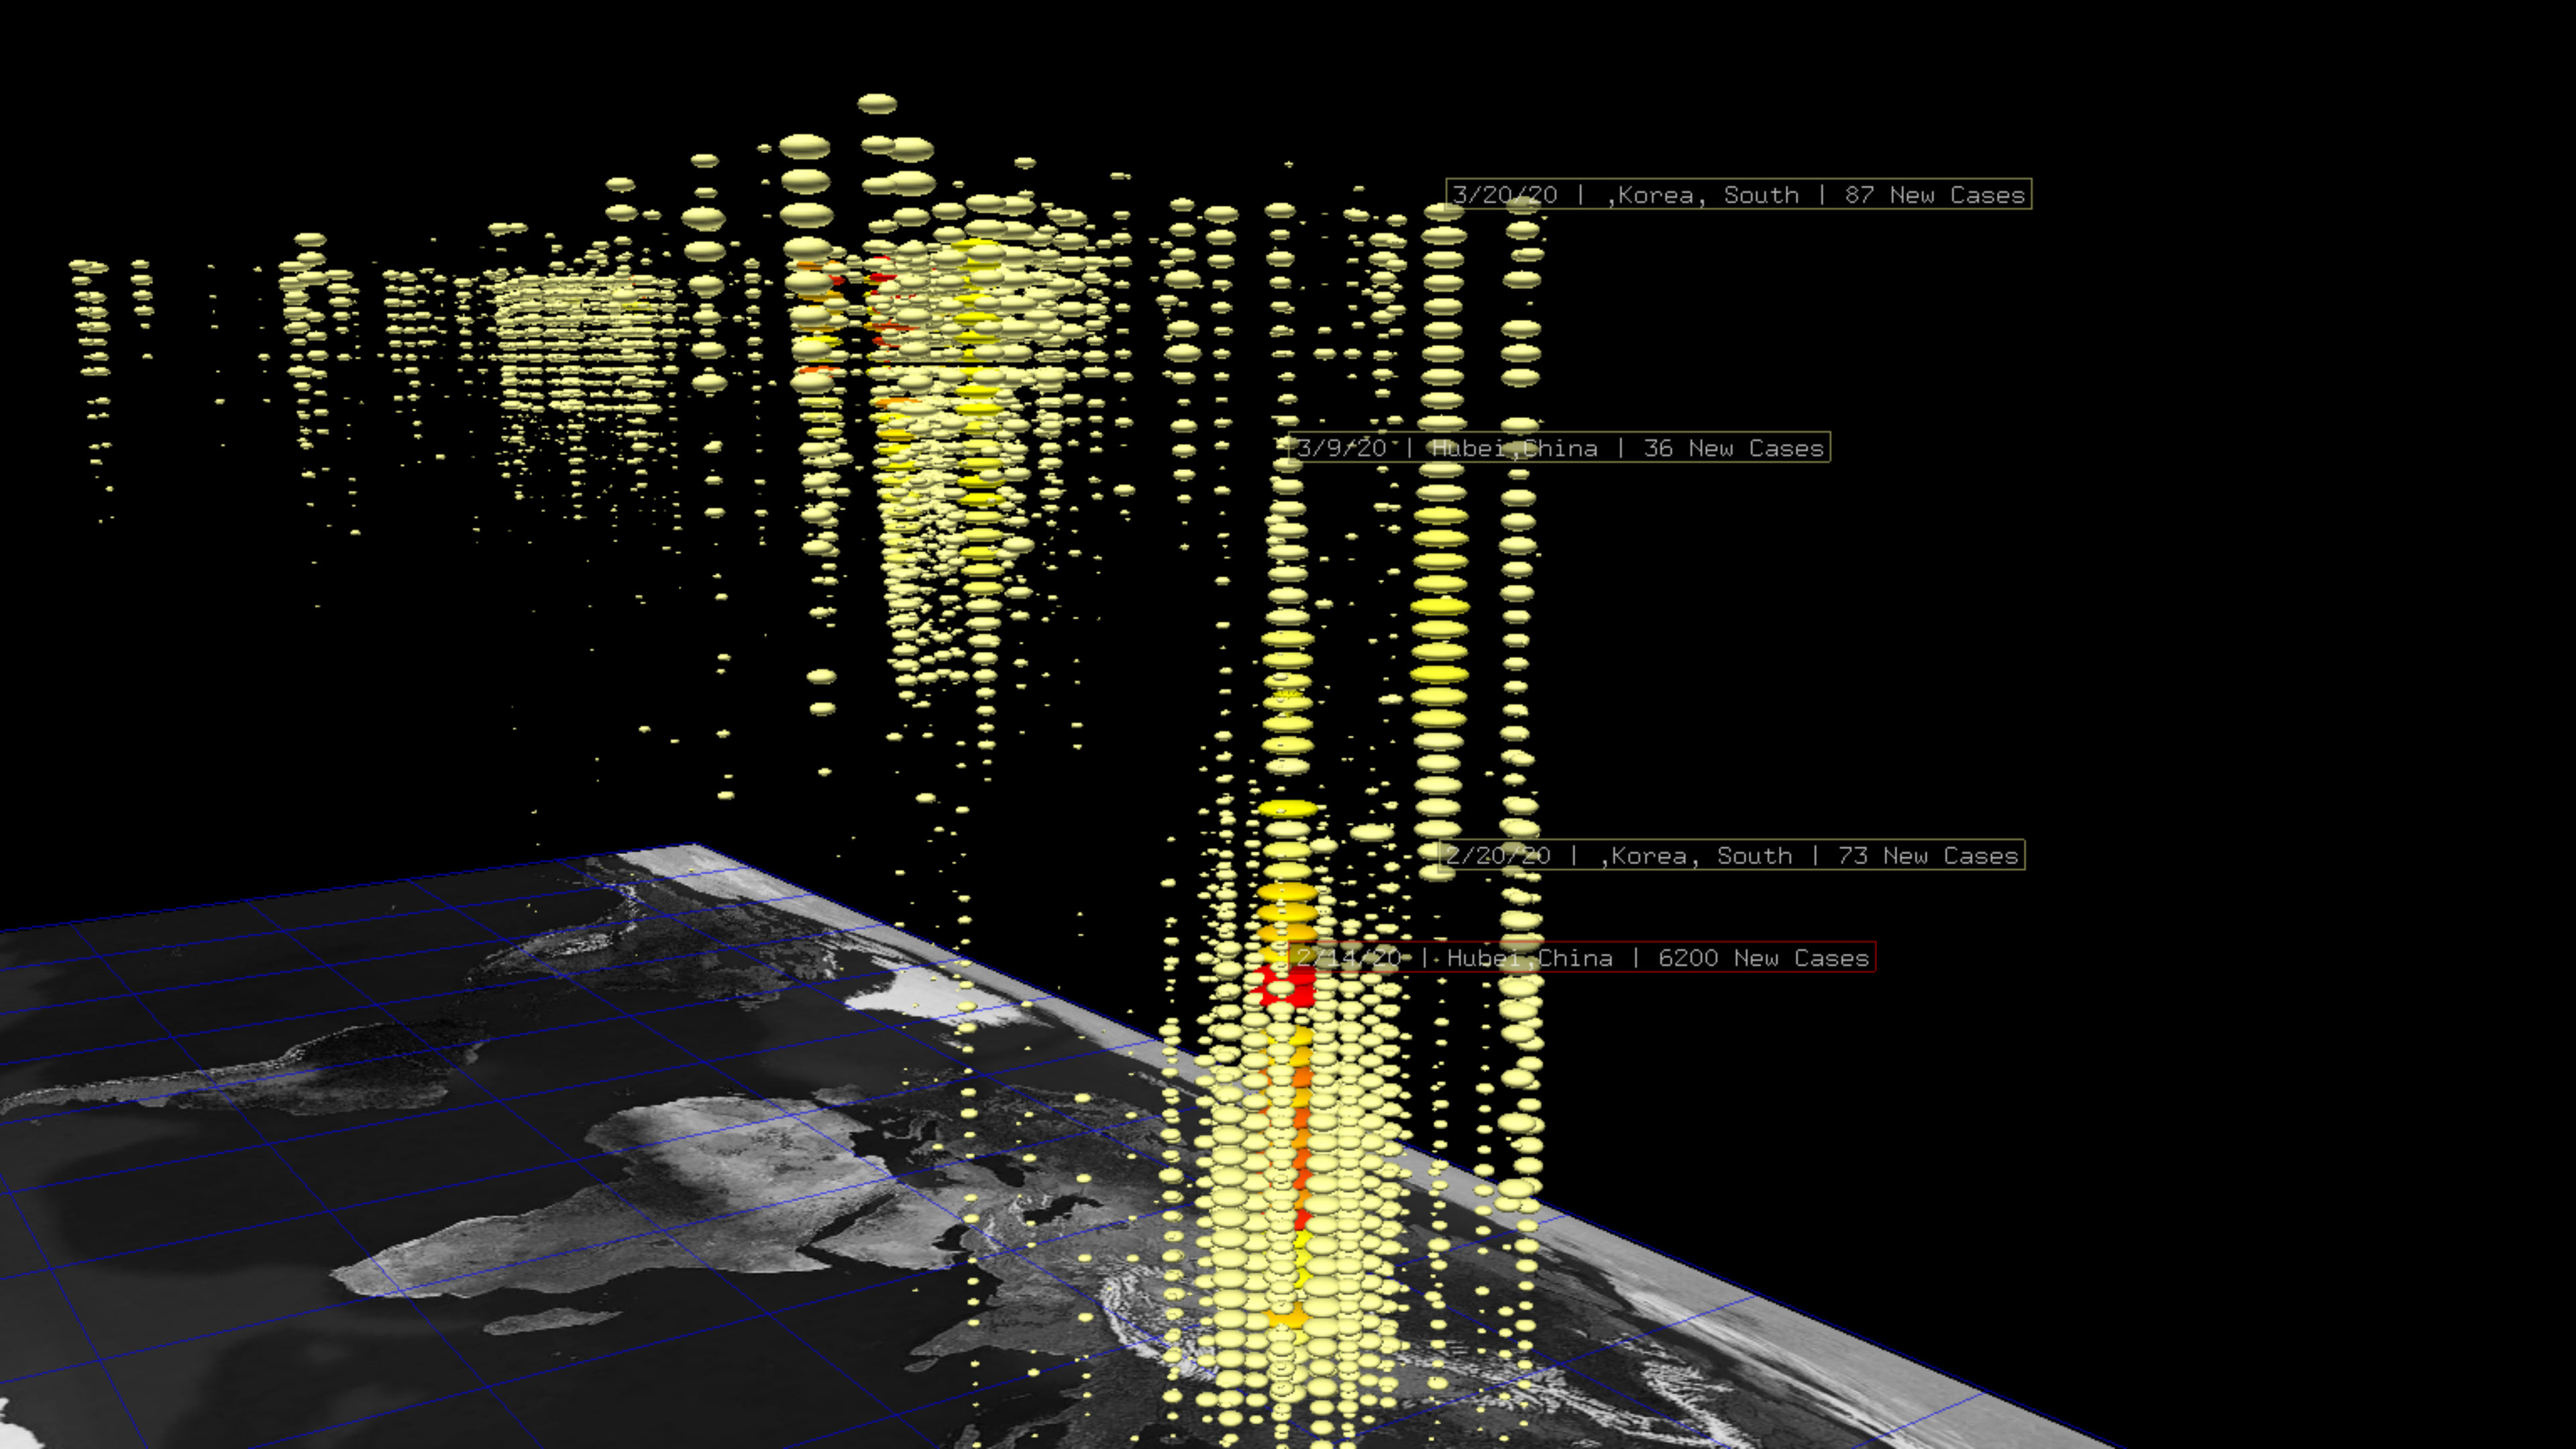
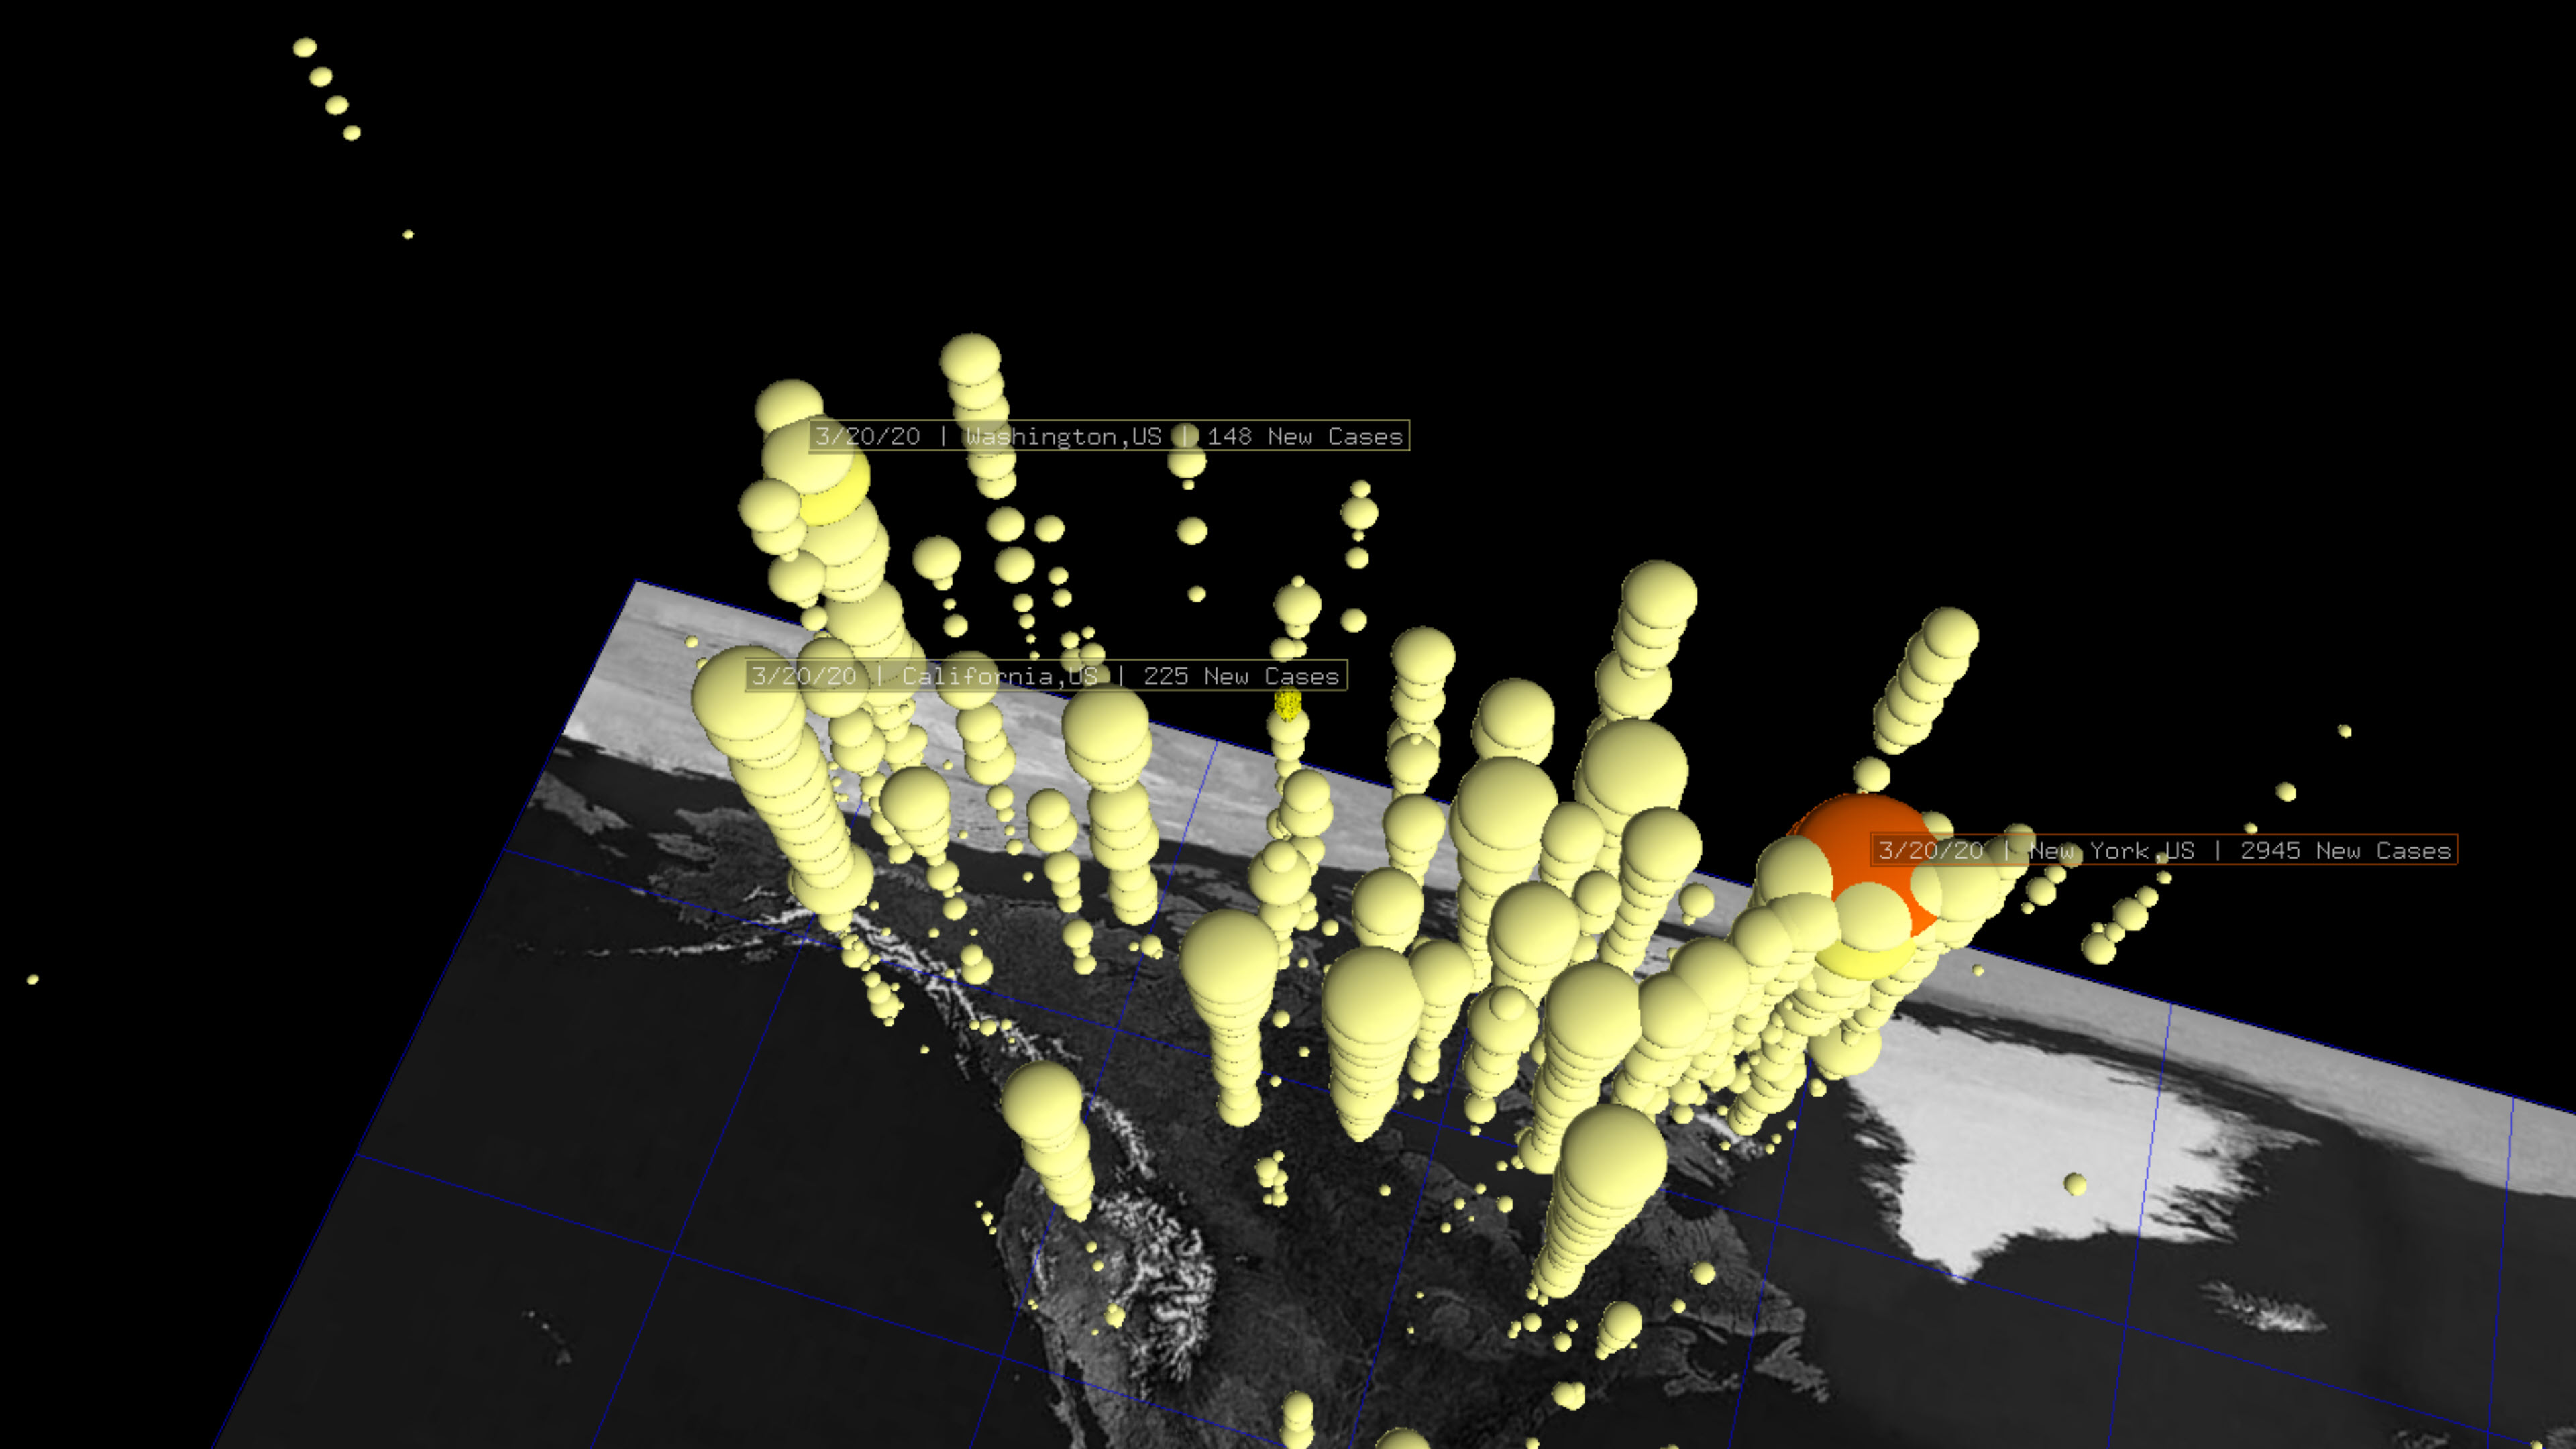
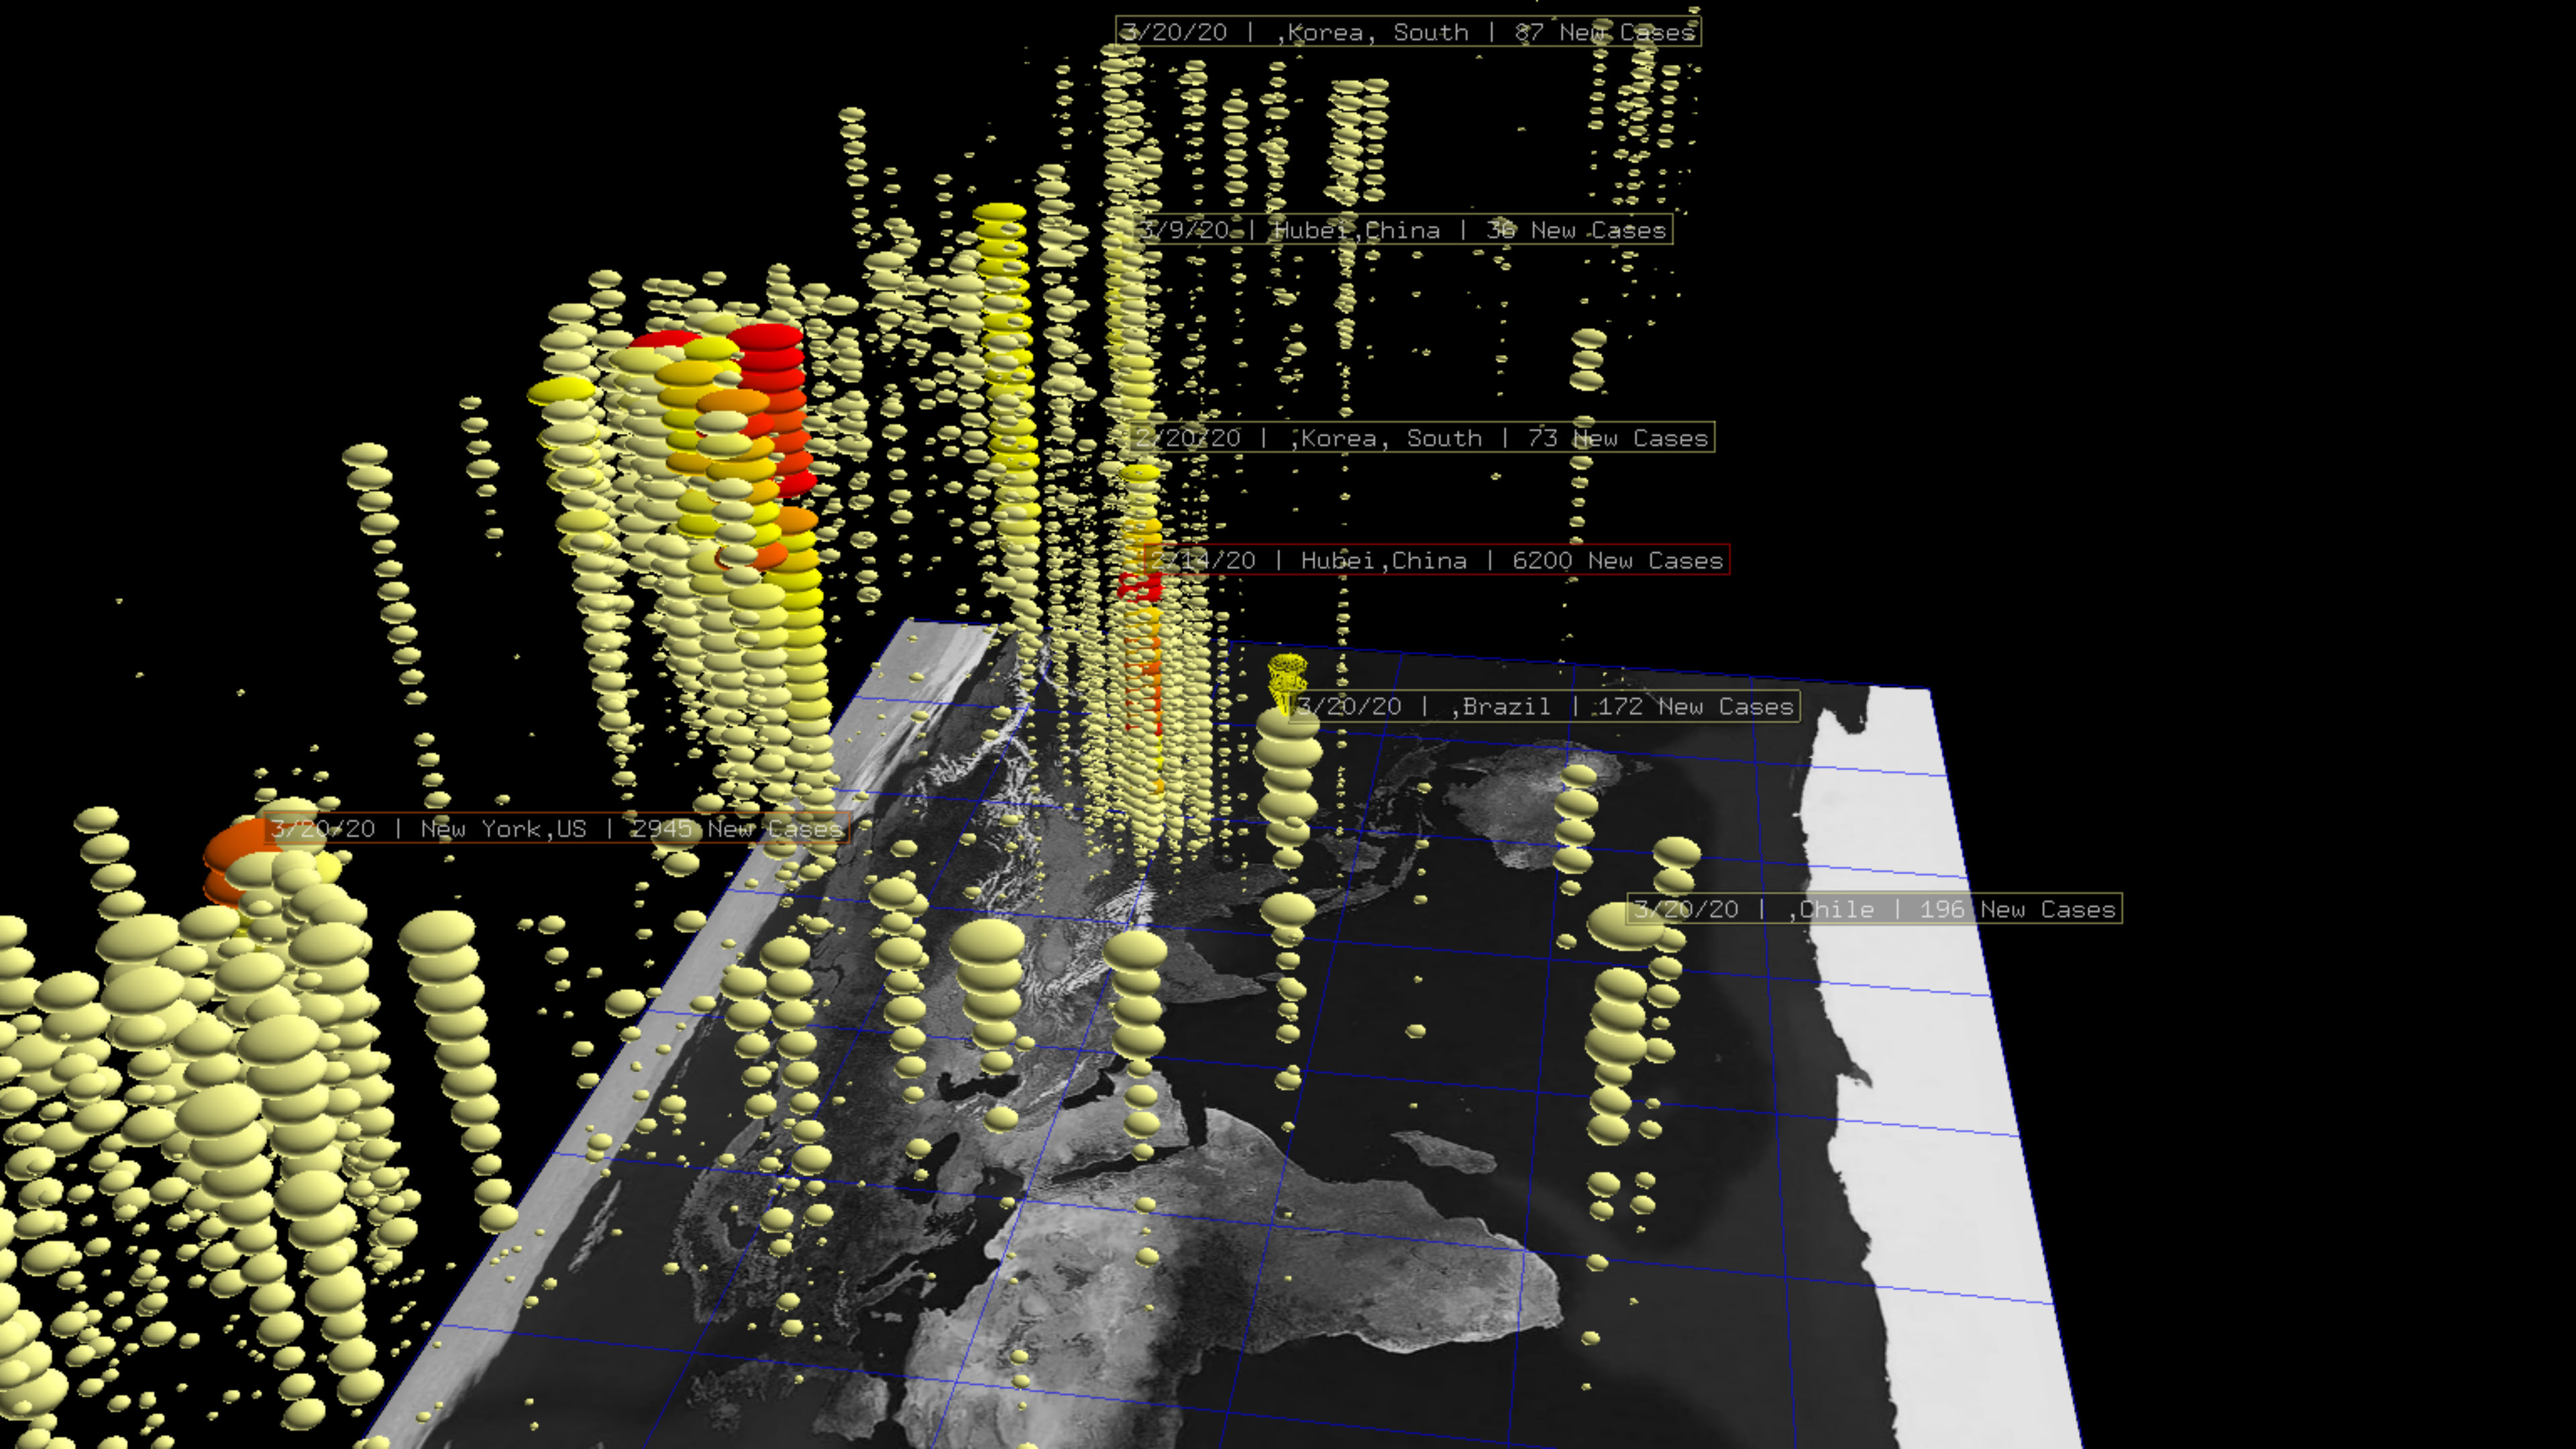
New Cases, March 20, 2020
These images are visualizations of COVID-19 new daily cases by country or region as of March 20,2020.
Linear Scale
Download interactive visualization.
Log Scale
Download interactive visualization.
Video
Watch a video of similar data from March 17, 2020.